Venn Keynote Diagrams
Elevate your Apple Keynote presentations with our premium gallery of Venn diagram templates. Designed specifically for the macOS ecosystem, these templates allow you to visualize relationships, overlaps, and logical sets with professional precision. Formerly known as chart templates - this collection now includes full dashboards, infographics, and the latest designs. Whether you are conducting a market analysis, explaining shared interests, or showcasing mathematical logic, our editable Venn circles provide the perfect balance of form and function. Each slide is optimized for high-resolution Retina displays, ensuring your overlaps and gradients look crisp and modern. Dive into our collection of circular, linear, and flower-style Venn designs to find the ultimate visual for your next big pitch or educational lecture. Experience the ease of "drag-and-drop" editing within Keynote and transform your data into a clear, compelling story today.
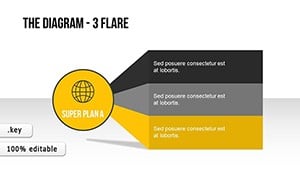 (527)
(527) Flare Venn Diagram Templates Keynote - Editable | ImagineLayoutID: #KD00217$18.00
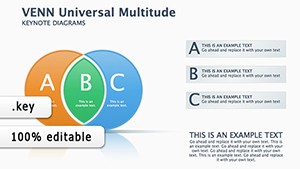 (370)
Universal Multitude Venn Keynote Diagrams Presentation | Download NowID: #KD00200$19.00
(370)
Universal Multitude Venn Keynote Diagrams Presentation | Download NowID: #KD00200$19.00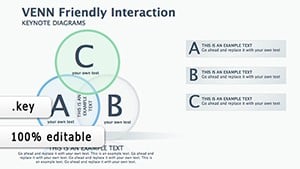 (971)
(971) Venn Friendly Interaction Keynote Diagrams for PresentationID: #KD00199$19.00
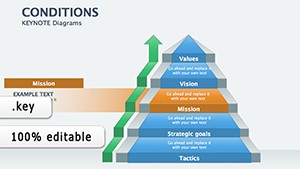 (918)
(918) Decision Flow Keynote Diagram TemplateID: #KD00198$22.00
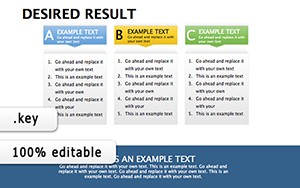 (1074)
 Desired Result Keynote Diagrams TemplateID: #KD00189$22.00
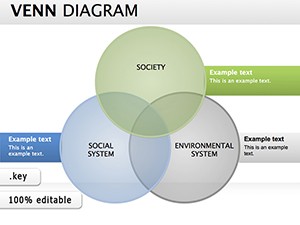 (913)
Selection Venn Keynote Diagrams: Reveal Hidden ConnectionsID: #KD00171$24.00
(913)
Selection Venn Keynote Diagrams: Reveal Hidden ConnectionsID: #KD00171$24.00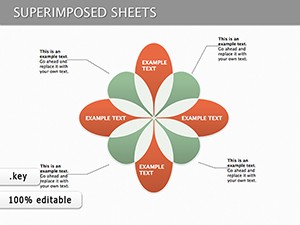 (324)
Venn Superimposed Sheets Keynote Diagrams: Reveal Hidden ConnectionsID: #KD00128$25.00
(324)
Venn Superimposed Sheets Keynote Diagrams: Reveal Hidden ConnectionsID: #KD00128$25.00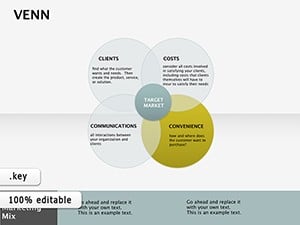 (1160)
Editable Venn Keynote Diagrams: Where Ideas Intersect and IlluminateID: #KD00085$12.00
(1160)
Editable Venn Keynote Diagrams: Where Ideas Intersect and IlluminateID: #KD00085$12.00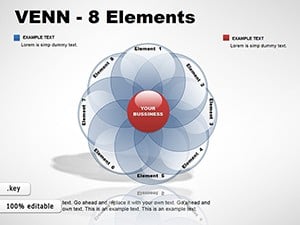 (712)
8-Element Venn Diagrams: Keynote Relationship VisualsID: #KD00045$24.00
(712)
8-Element Venn Diagrams: Keynote Relationship VisualsID: #KD00045$24.00 (775)
Editable Venn Diagrams Keynote Template: Map Overlaps with PrecisionID: #KD00044$25.00
(775)
Editable Venn Diagrams Keynote Template: Map Overlaps with PrecisionID: #KD00044$25.00 (83)
Venn Keynote Diagrams TemplateID: #KD00042$25.00
(83)
Venn Keynote Diagrams TemplateID: #KD00042$25.00 (619)
Venn Diagrams Keynote Template: Overlap Ideas with PrecisionID: #KD00019$24.00
(619)
Venn Diagrams Keynote Template: Overlap Ideas with PrecisionID: #KD00019$24.00
Mastering Data Relationships with Keynote Venn Diagrams
Venn diagrams are the gold standard for illustrating commonalities and differences between distinct groups. In a professional setting, a well-crafted overlapping circle diagram can be the difference between a confused audience and a convinced one. Our Keynote-specific templates are built to leverage Apple`s native design capabilities, offering smooth transitions and elegant styling that standard office software simply can't match. From simple two-set comparisons to complex five-set intersections, our layouts are engineered for maximum clarity.
Creative Applications for Overlapping Set Visuals
- Market Analysis: Identify the "sweet spot" where customer needs, competitor gaps, and your company`s strengths intersect.
- Project Management: Highlight the shared responsibilities between different departments or stakeholders.
- Educational Tools: Simplify complex logic or scientific concepts for students using clear, color-coded visual sets.
- Product Development: Map out feature sets and identify which functionalities are shared across different product tiers.
- Brand Positioning: Define your brand's unique value proposition by showing how it overlaps with market trends and consumer desires.
The Advantage of Professional Keynote Layouts
While Keynote provides basic shape tools, creating perfectly aligned, semi-transparent overlapping circles that maintain text readability is a time-consuming task. Our ready-to-use Venn slides come pre-formatted with optimal transparency layers and text placement. This means you don't have to worry about the intersection colors becoming "muddy" or the text getting lost in the background. We use a refined color palette that ensures high contrast and accessibility, making your presentation inclusive and easy to follow for all viewers.
Pro Tips for Impactful Venn Presentations
To make the most of your Keynote Venn infographics, focus on the "Heart" of the diagram - the central intersection where all sets meet. This is usually your most important data point. Use bold typography for this section to draw the eye immediately. If you are using more than three circles, consider using our "Petal" or "Linear" variations, which provide more space for text descriptions within the overlapping segments. Additionally, utilize Keynote`s "Magic Move" transition to animate the circles coming together, creating a dynamic effect that keeps your audience engaged during your explanation.
Frequently Asked Questions
A: While the templates come with fixed sets (2, 3, 4, or 5 circles), you can easily add or remove shapes. However, we recommend choosing the template that matches your specific number of sets for the best visual balance.
Q: Are these templates compatible with iPad?A: Yes! Our .key files are fully compatible with Keynote for iPad and iPhone, allowing you to edit and present on the go.
Q: How do I change the transparency of the overlapping sections?A: You can adjust the opacity of any shape through the "Style" tab in the Keynote inspector. Our templates come pre-set at 50-70% opacity for optimal visibility.
Q: Can I export these slides to PDF or PowerPoint?A: Yes, Keynote allows you to export your finished slides to multiple formats, though some specific Keynote animations may vary when converted to PowerPoint.