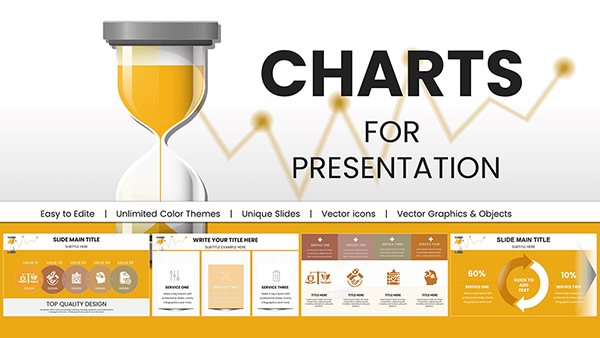
Timelines PowerPoint Charts
Formerly known as timelines powerpoint chart templates - this collection now covers PowerPoint timeline templates.
These layouts provide pre-aligned markers and date formatting so you spend your time on the business narrative rather than slide construction. A product manager updating the steering committee on feature rollout phases simply replaces placeholders and adjusts colors instead of rebuilding connectors from scratch.
The finance director presenting budget milestones to the CFO benefits from the same structure in a tight deadline scenario. The templates deliver clear visual hierarchy without decorative distractions. Customize and present immediately.
 (22)
(22) Project Timeline Management PowerPoint Charts for Dynamic Business PresentationsID: #PC00942$25.00
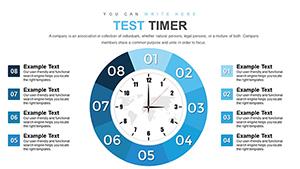 (283)
(283) Time Clock Dial PowerPoint Charts TemplateID: #PC00874$15.00
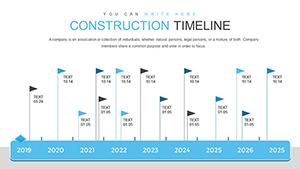 (1059)
Construction Timeline PowerPoint Charts: Streamline ProjectsID: #PC00864$18.00
(1059)
Construction Timeline PowerPoint Charts: Streamline ProjectsID: #PC00864$18.00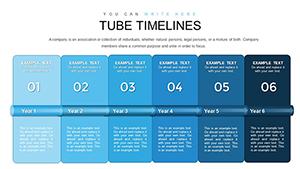 (846)
Modern Tube Timeline PowerPoint Charts TemplateID: #PC00855$15.00
(846)
Modern Tube Timeline PowerPoint Charts TemplateID: #PC00855$15.00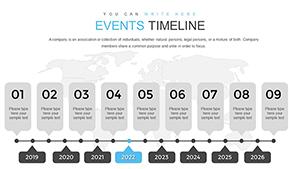 (452)
Events Timeline PowerPoint Charts: Chronicle Milestones MasterfullyID: #PC00838$13.00
(452)
Events Timeline PowerPoint Charts: Chronicle Milestones MasterfullyID: #PC00838$13.00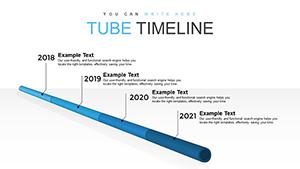 (1050)
Timeline Tube PowerPoint Charts Template: Craft Compelling NarrativesID: #PC00815$12.00
(1050)
Timeline Tube PowerPoint Charts Template: Craft Compelling NarrativesID: #PC00815$12.00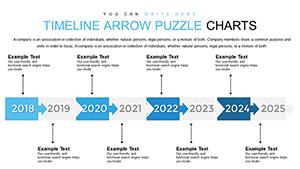 (199)
(199) Creative Infographic Timeline Arrow PowerPoint Template: Narrate with FlairID: #PC00797$18.00
 (1122)
 Professional Timeline PowerPoint Charts TemplateID: #PC00756$15.00
 (733)
Best Action Plan Steps PowerPoint Template for Project SuccessID: #PC00723$15.00
(733)
Best Action Plan Steps PowerPoint Template for Project SuccessID: #PC00723$15.00 (898)
Banking PowerPoint Charts TemplateID: #PC00703$24.00
(898)
Banking PowerPoint Charts TemplateID: #PC00703$24.00 (752)
Effective Problem Solving with PowerPoint Charts - Download TemplateID: #PC00702$23.00
(752)
Effective Problem Solving with PowerPoint Charts - Download TemplateID: #PC00702$23.00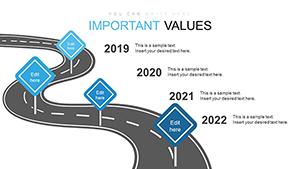 (557)
Roadmap and Signs PowerPoint Charts Template: Navigate Your Projects with ClarityID: #PC00630$15.00
(557)
Roadmap and Signs PowerPoint Charts Template: Navigate Your Projects with ClarityID: #PC00630$15.00 (521)
Timeline PowerPoint Charts - Instant Download | ImagineLayoutID: #PC00626free
(521)
Timeline PowerPoint Charts - Instant Download | ImagineLayoutID: #PC00626free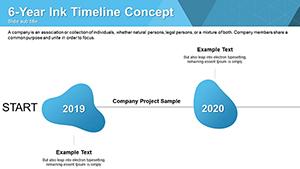 (491)
Free Ink Timelines PowerPoint Charts: Artistic Flow for Your StoriesID: #PC00624free
(491)
Free Ink Timelines PowerPoint Charts: Artistic Flow for Your StoriesID: #PC00624free (11)
Economic Analysis PowerPoint Charts: Illuminate Trends and ForecastsID: #PC00607$17.00
(11)
Economic Analysis PowerPoint Charts: Illuminate Trends and ForecastsID: #PC00607$17.00 (289)
Process Modeling Charts - Editable PPTX | ImagineLayoutID: #PC00589$17.00
(289)
Process Modeling Charts - Editable PPTX | ImagineLayoutID: #PC00589$17.00 (300)
Evolution of Business Process Management PowerPoint ChartsID: #PC00550$17.00
(300)
Evolution of Business Process Management PowerPoint ChartsID: #PC00550$17.00 (893)
Streamline Processes with Timeline PowerPoint ChartsID: #PC00545$13.00
(893)
Streamline Processes with Timeline PowerPoint ChartsID: #PC00545$13.00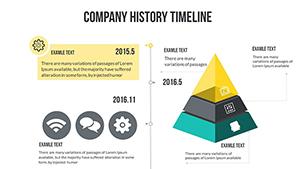 (355)
History Maker Timeline Charts for Architectural NarrativesID: #PC00518$18.00
(355)
History Maker Timeline Charts for Architectural NarrativesID: #PC00518$18.00 (587)
Timeline PowerPoint Charts - Ready to Present | ImagineLayoutID: #PC00514$18.00
(587)
Timeline PowerPoint Charts - Ready to Present | ImagineLayoutID: #PC00514$18.00 (1143)
Comprehensive Timeline PowerPoint Charts Template - EditableID: #PC00501$18.00
(1143)
Comprehensive Timeline PowerPoint Charts Template - EditableID: #PC00501$18.00 (708)
Project Timeline PowerPoint Charts TemplatesID: #PC00500$20.00
(708)
Project Timeline PowerPoint Charts TemplatesID: #PC00500$20.00 (960)
Dynamic Company Timeline PowerPoint Charts TemplateID: #PC00498$20.00
(960)
Dynamic Company Timeline PowerPoint Charts TemplateID: #PC00498$20.00 (400)
Timeline Maker PowerPoint Charts TemplateID: #PC00497$21.00
(400)
Timeline Maker PowerPoint Charts TemplateID: #PC00497$21.00 (710)
Strategic Planning PowerPoint Charts Template - Download & CustomizeID: #PC00495$22.00
(710)
Strategic Planning PowerPoint Charts Template - Download & CustomizeID: #PC00495$22.00 (898)
Important Information PowerPoint Chart Template: Organize Data EffectivelyID: #PC00491$18.00
(898)
Important Information PowerPoint Chart Template: Organize Data EffectivelyID: #PC00491$18.00 (137)
Animated Timeline and Process Flow PowerPoint Template - Fully Editable & Instant DownloadID: #PC00460$18.00
(137)
Animated Timeline and Process Flow PowerPoint Template - Fully Editable & Instant DownloadID: #PC00460$18.00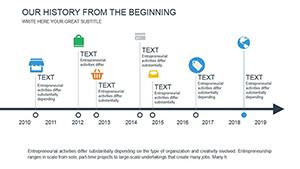 (234)
Engaging History Beginning PowerPoint Charts TemplateID: #PC00453$12.00
(234)
Engaging History Beginning PowerPoint Charts TemplateID: #PC00453$12.00 (301)
Professional PowerPoint Charts Template for Versatile Data VizID: #PC00442$16.00
(301)
Professional PowerPoint Charts Template for Versatile Data VizID: #PC00442$16.00 (925)
Decisive Definition PowerPoint Charts Template: Define Success VisuallyID: #PC00417$20.00
(925)
Decisive Definition PowerPoint Charts Template: Define Success VisuallyID: #PC00417$20.00 (144)
Strategic Tactical Planning PowerPoint Charts TemplateID: #PC00374$17.00
(144)
Strategic Tactical Planning PowerPoint Charts TemplateID: #PC00374$17.00 (201)
Stories Archive Dark PowerPoint Template: Editable Timelines for Historical NarrativesID: #PC00364$14.00
(201)
Stories Archive Dark PowerPoint Template: Editable Timelines for Historical NarrativesID: #PC00364$14.00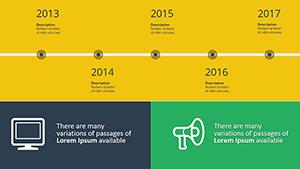 (278)
Timelines Stories Archive PowerPoint Charts Template - Download NowID: #PC00363$14.00
(278)
Timelines Stories Archive PowerPoint Charts Template - Download NowID: #PC00363$14.00
How Timeline PowerPoint Templates Accelerate Executive Reporting Cycles
A project manager at a tech startup has forty-eight hours before the quarterly steering committee meeting. The current status report shows delayed features across three product lines, and the existing slide deck looks like a wall of text. Opening the construction timeline layout lets her drag milestone markers, color-code risk levels, and add dependency arrows in under twenty minutes. The discussion with leadership moves immediately to resource allocation rather than slide legibility.
An HR director onboarding two hundred new employees needs to communicate the company journey from founding to current scale. The history maker timeline chart provides vertical roadmap placeholders already spaced for key events. She inserts acquisition dates and growth metrics, then duplicates the slide for regional variations. New hires grasp the narrative without the director spending hours on manual formatting.
A strategy consultant pitching market entry to a manufacturing client board must show five-year expansion phases. The modern tube layout separates pre-launch, launch, and scale stages with clear connectors. Custom text boxes highlight revenue projections per phase. The client team sees the logic at a glance and the conversation turns to partnership details instead of design feedback.
When the finance lead prepares an investment timeline for the CFO review, the events timeline slide organizes cash flow milestones alongside regulatory approvals. Swapping placeholder numbers updates the entire visual story. The CFO approves the plan faster because the structure already mirrors the decision-making flow they expect.
The Hidden Time Cost of Manually Creating Timelines in PowerPoint
Starting from a blank slide means deciding on arrow thickness, date label alignment, and phase color contrast for every single milestone. By slide ten, column widths drift and font sizes no longer match. Those micro-decisions compound across a thirty-slide deck, pulling focus from the actual business logic. The templates lock those choices into the slide master so every update stays consistent without re-checking spacing on every revision.
Workflow Benefits When Reusing Timeline Slides Across Departmental Decks
Large organizations run the same reporting cadence every quarter. A reusable timeline slide master lets marketing, operations, and finance teams pull the same base layout, update only the dates and metrics, then merge into the master deck. Chart formatting stays identical whether the presentation goes to the board or to external auditors, reducing version-control headaches and ensuring the visual language remains uniform company-wide.
A Practical Tip for Reusable Milestone Markers in Large Presentations
Group the date marker, connecting line, and text box into a single shape object before duplicating across slides. This way, when you update one phase color for branding, the change propagates without breaking alignment on later slides. Test the group in slide sorter view to confirm the timeline reads left-to-right even after heavy edits.
Slide Master and Aspect Ratio Setup for Reliable Timeline Exports
Set the slide master aspect ratio to 16:9 before populating timelines. This prevents distortion when the deck is exported to PDF for distribution or projected on widescreen displays. Embedded fonts ensure date labels render identically on any machine, avoiding the fallback substitutions that can shift milestone positions in printed board packs.
What Sets These Timeline Charts Apart for Corporate Storytelling
Every layout here starts from the argument structure - headline claim, supporting evidence, call to action - rather than decorative icons or unnecessary animations. You gain complete editing freedom on shapes and text without locked layers, letting the timeline serve the story instead of distracting from it. The result is decks that feel built for the boardroom, not the template marketplace.
If your next presentation needs to show decision branches rather than sequential time, head over to the Tree Diagram PowerPoint Templates for organizational charts and root-cause analysis. For location-based data in Apple Keynote, the Central America Keynote Maps Templates provide editable country outlines that pair well when timelines intersect with geography. Combine elements from both categories when your story requires time plus hierarchy or regional context.
Browse the collection and select the layout that aligns with your current reporting cycle.
Are all timeline templates provided in PPTX format?
Yes, every file in this collection downloads as a native PPTX format. This ensures full compatibility with Microsoft PowerPoint 2016 and all newer versions, including the latest Microsoft 365 releases. The slide master contains the pre-configured layouts so you can replace dates and text without rebuilding connectors. If you plan to share with colleagues on older installations, the embedded fonts option during save-as protects visual consistency across devices.
Do these PowerPoint timeline templates work with Google Slides?
Yes, the files import directly into Google Slides without conversion loss. Text placeholders, shapes, and color schemes transfer intact, though you may need to reapply any custom animations manually since Google Slides handles transitions differently. The 16:9 aspect ratio remains locked, preserving the timeline flow on shared screens or exported PDFs.
Can I customize colors, shapes, and text in these timeline charts without restrictions?
All shapes, lines, and text boxes are fully editable with no locked elements or grouped restrictions beyond standard PowerPoint behavior. You can change milestone colors to match brand guidelines, adjust arrow styles for emphasis, and resize date markers while the underlying structure stays intact. This level of freedom lets departments maintain consistent timelines even when corporate branding updates occur mid-year.
What PowerPoint version do I need to open these timeline charts?
The templates open cleanly in PowerPoint 2016 and above. Earlier versions may display minor layout shifts in complex tube or arrow designs because of differences in shape rendering engines. If you encounter issues, the recommended workaround is to open in Microsoft 365 online first, then download the updated PPTX for desktop use. Google Slides compatibility serves as an alternative for teams without the latest desktop license.
How do I ensure the timeline looks consistent when exporting to PDF for board meetings?
Before exporting, confirm the slide master aspect ratio is set to 16:9 and use the embed fonts option in the save menu. This prevents substitution issues that could misalign milestone labels on recipient machines. Test the PDF output on a second screen to verify the visual hierarchy reads correctly at print scale, especially for long horizontal timelines that span multiple columns.