Decisive Definition PowerPoint Charts Template: Define Success Visually


Clarity in communication often spells the difference between confusion and conviction. The Decisive Definition PowerPoint Charts Template, with its 11 editable slides, masterfully combines timelines and puzzles to define concepts decisively. Informed by design standards from the International Association of Business Communicators (IABC), it's suited for marketers, educators, and executives. Imagine unraveling a project's puzzle pieces in a timeline format, engaging stakeholders effortlessly. This template's modern vibe captivates, with users experiencing heightened audience retention. Versatile in PowerPoint or Google Slides, it streamlines creation, letting ideas shine.
Defining Features for Impact
Timelines trace progress; puzzles interlock ideas - customizable with drags, colors, fonts. Sleek aesthetics trump bland defaults. A marketer noted puzzle slides clarifying campaign flows, boosting team synergy.
Slide Details Unpacked
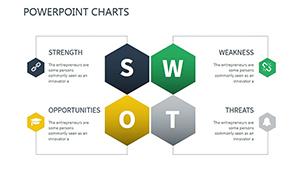
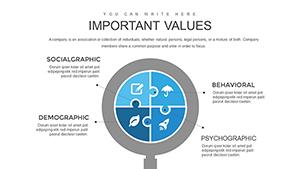
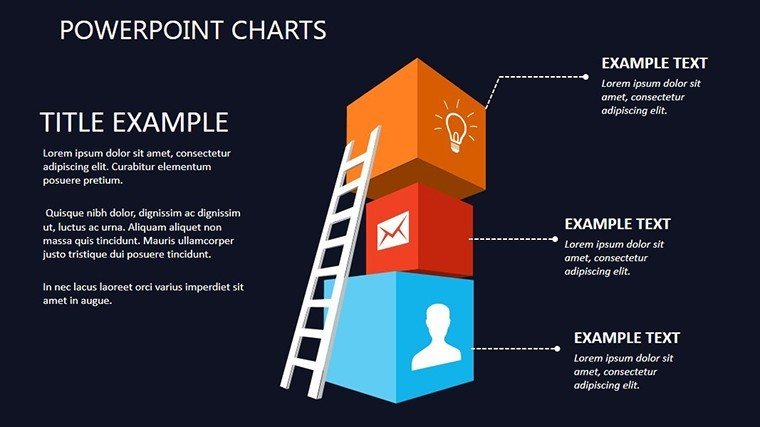
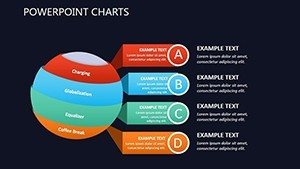
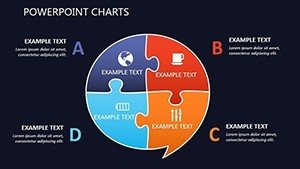
- Slide 1: Concept Puzzle Overview - Assembles key definitions holistically.
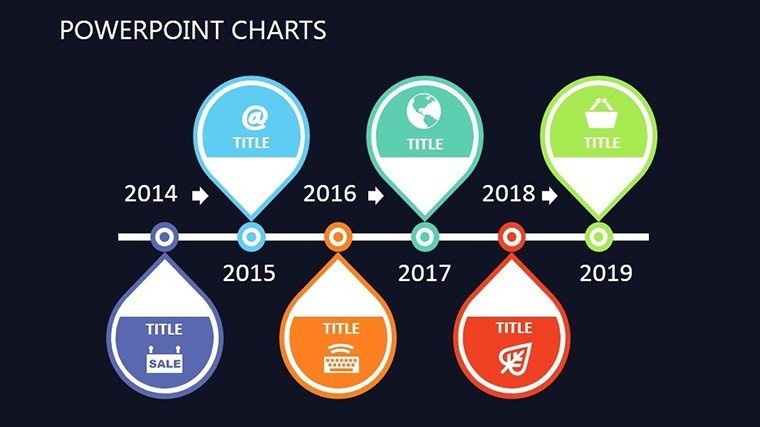
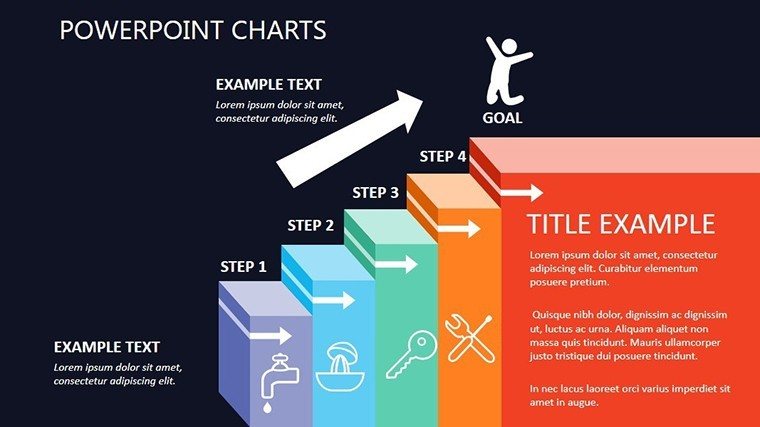
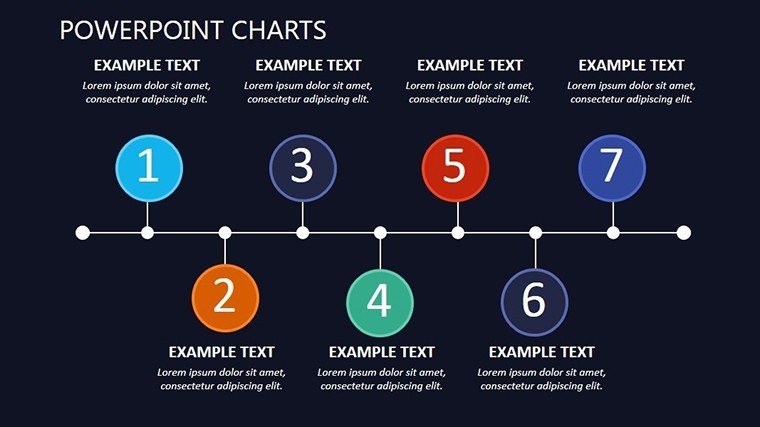
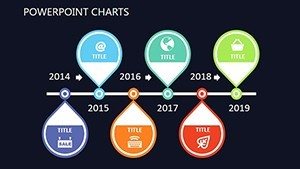
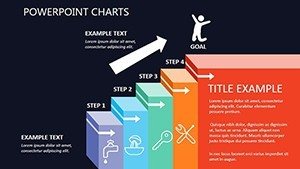
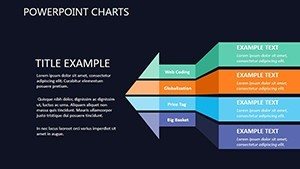
- Slide 2-4: Timeline Progressions - Linear paths for milestones, editable durations.
- Slide 5: Definition Gantt - Hybrid for phased definitions.
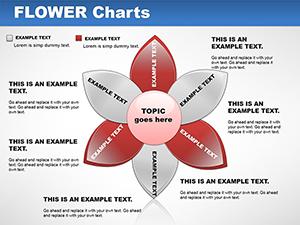
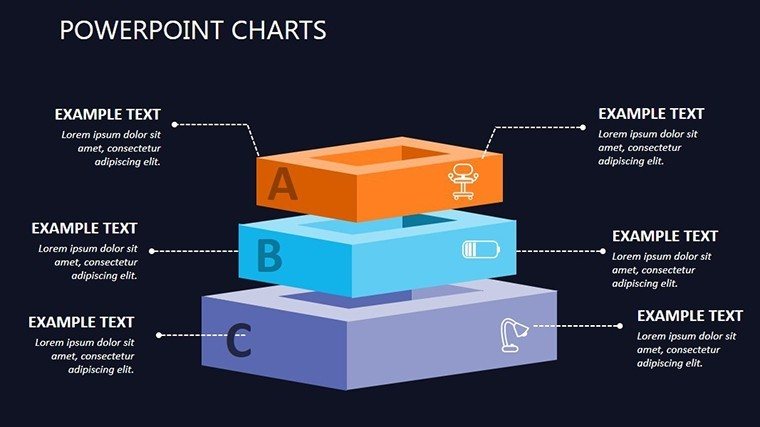
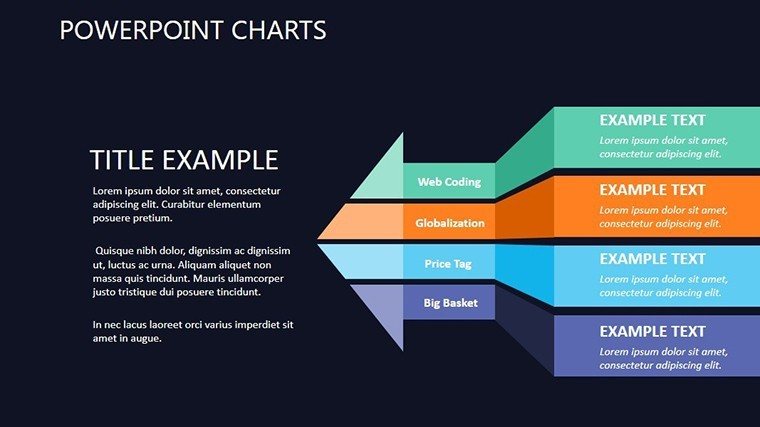
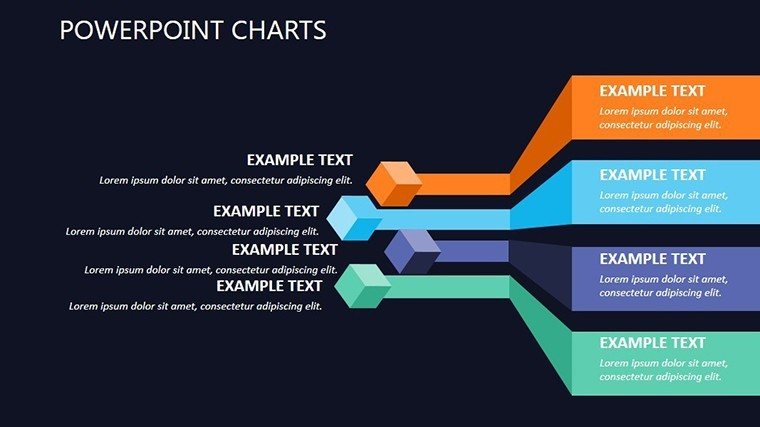
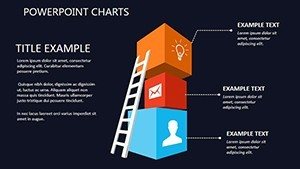
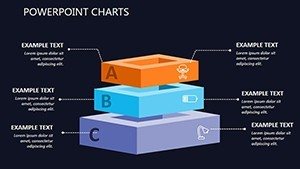
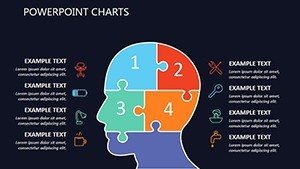
- Slide 6-7: Puzzle Interlocks - Connects variables visually.
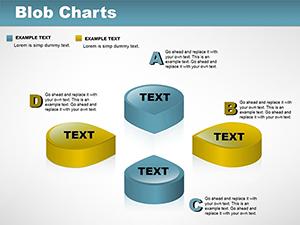
- Slide 8: Scatter Definitions - Plots relationships dynamically.
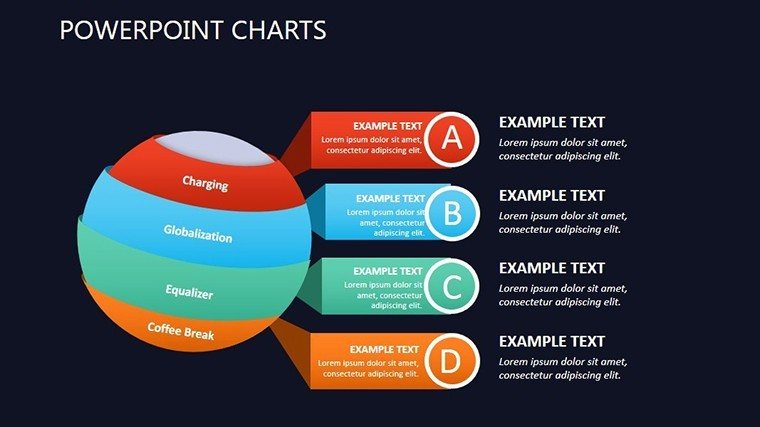
- Slide 9-10: Dashboard Puzzles - Integrates metrics for overviews.
- Slide 11: Conclusive Timeline - Wraps with forward paths.
Adaptable for diverse narratives.
Usage Across Scenarios
For sales, define pitches with pies; training, puzzle processes. A consultant used timelines for reports, enhancing client understanding. Benefits: time savings, engagement spikes, message precision. Tip: Layer puzzles for depth. Humorously, it's your clarity compass in foggy meetings.
Tips for Mastery
- Start simple: Build from core definitions outward.
- Visual balance: Alternate timelines and puzzles.
- Brand infuse: Match aesthetics consistently.
- Animate wisely: Reveal pieces progressively.
- Feedback refine: Iterate post-use.
Expert-derived for peak performance.
Unmatched Value
Exceeds basics with puzzle innovation; $20.00 buys versatility unmatched.
Define your edge - obtain the Decisive Definition PowerPoint Charts Template and present with purpose.
Frequently Asked Questions
- Customization level?
- Complete, including shapes and transitions.
- For educational use?
- Excellent for concept breakdowns.
- Handles timelines well?
- Yes, with dynamic scaling.
- Team-friendly?
- Shares easily via Google Slides.
- Puzzle complexity?
- From basic to intricate interlocks.
- Export options?
- High-res for prints or digital.