Silhouettes & People PowerPoint Charts
Formerly known as silhouettes people powerpoint chart templates - this collection now includes people silhouettes powerpoint templates for charts.
This category offers a selection of people silhouette layouts ready for PowerPoint and Keynote. HR managers, project leads, and marketing analysts use them to represent teams and customer groups without using real photos.
Choose these when you need consistent human icons that match your brand colors or when privacy rules prevent photo use in reports. For example, an HR director in manufacturing maps workforce distribution by department in an annual planning session using one template to show headcount balance at a glance.
Downloading saves time compared to building from scratch and ensures the focus stays on business decisions rather than slide design.
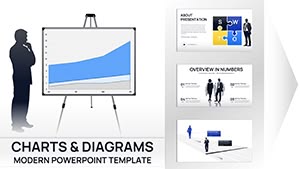 (12)
(12) Business Silhouettes PPT Charts Template - Editable SlidesID: #PC01110$15.00
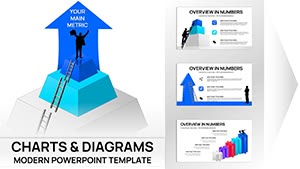 (10)
(10) Career Personal Trainer Proposal Charts PowerPoint TemplateID: #PC01098$18.00
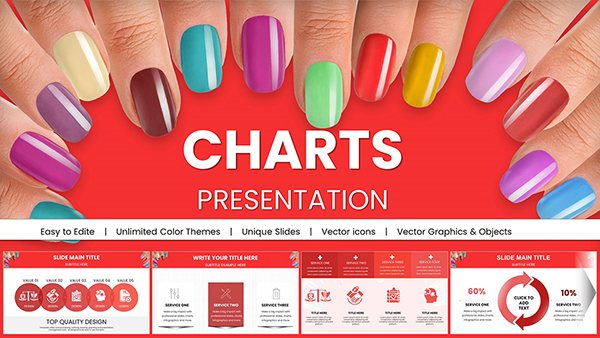 (946)
(946) Manicure PowerPoint Charts Presentation TemplateID: #PC01009$25.00
 (330)
Healthy Foods Infographic PowerPoint Charts Template: Your Guide to Nutrient-Rich PresentationsID: #PC00881$15.00
(330)
Healthy Foods Infographic PowerPoint Charts Template: Your Guide to Nutrient-Rich PresentationsID: #PC00881$15.00 (752)
(752) Preventing Sexual Violence PowerPoint Charts: Advocacy and Education ToolID: #PC00879$15.00
 (280)
Medicine: Personal Protective Equipment (PPE) PowerPoint Charts TemplateID: #PC00878$15.00
(280)
Medicine: Personal Protective Equipment (PPE) PowerPoint Charts TemplateID: #PC00878$15.00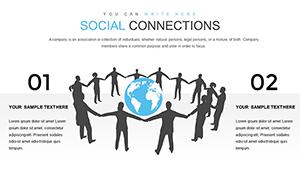 (775)
Social Connections and Happiness PowerPoint Charts TemplateID: #PC00844$14.00
(775)
Social Connections and Happiness PowerPoint Charts TemplateID: #PC00844$14.00 (1112)
Celebrate Data: Happy New Year and Christmas PowerPoint Charts TemplateID: #PC00152$15.00
(1112)
Celebrate Data: Happy New Year and Christmas PowerPoint Charts TemplateID: #PC00152$15.00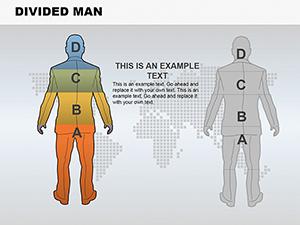 (619)
Divided Man PowerPoint Charts Template PresentationID: #PC00144$15.00
(619)
Divided Man PowerPoint Charts Template PresentationID: #PC00144$15.00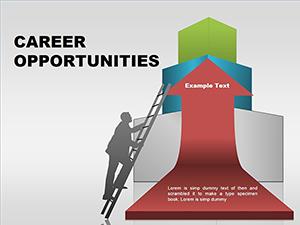 (144)
Career Personal Trainer PowerPoint Charts TemplateID: #PC00036$14.00
(144)
Career Personal Trainer PowerPoint Charts TemplateID: #PC00036$14.00 (1036)
Dynamic Business Silhouettes PPT Charts Template | Fully Editable Slides for Board MeetingsID: #PC00034$10.00
(1036)
Dynamic Business Silhouettes PPT Charts Template | Fully Editable Slides for Board MeetingsID: #PC00034$10.00
Use Cases
HR managers in manufacturing companies use the templates during workforce planning sessions to show department headcount distribution. The situation requires clear visuals for leadership to approve hiring budgets in the annual review. The silhouettes scale automatically when data changes and keep the slide layout intact across different presentation versions.
Marketing analysts in consumer goods firms apply them in customer segmentation reports to the product team. In a strategy meeting the icons illustrate buyer personas by age group or region. Pre-built group arrangements let the presenter highlight shifts in market focus without recreating the entire graphic.
Project leads in consulting firms deploy the templates in status updates to clients to represent team roles on a project timeline. The visual helps stakeholders understand resource allocation at each phase. The consistent silhouette style across slides builds recognition and reduces confusion in long decks.
Training coordinators in financial services use the designs in workshop materials to map customer journey stages with participant roles. The icons make abstract processes relatable and support group discussions on service improvements during the session.
Comparison vs. default PowerPoint or Keynote shapes or blank slides
Default shape libraries in PowerPoint or Keynote offer only basic stick figures that look dated and require manual alignment for groups. These templates provide ready silhouettes in multiple poses and group configurations that match modern business aesthetics immediately. Building arrangements from blank slides demands hours of resizing and positioning to achieve balanced spacing. The category options include layered team structures and process flows that are difficult to recreate consistently. You avoid mismatched proportions or awkward overlaps that distract during presentations. Overall the templates deliver a polished appearance that supports the message in HR reports and client workshops without extra effort.
Best-practice advice for using the templates in this category
Group related silhouettes together on the slide and apply the same color family to represent one category such as department or persona. Keep the total number of figures under twenty to maintain readability from the back of the room. Add subtle labels or numbers next to each silhouette rather than inside the figure to prevent visual clutter. Align all elements to the slide grid for clean spacing that works on both widescreen and standard formats. Combine the silhouettes with a short explanatory title that ties the visual directly to the business goal being discussed.
Technical Tip for Working with These Templates
To recolor multiple silhouettes at once select all figures in the group and use the format painter or shape fill tool to apply a new color scheme in one step. For resizing an entire team arrangement hold the shift key while dragging a corner handle to preserve proportions across all elements. If you need to add new figures copy one existing silhouette and paste it into the group then adjust size and position. This workflow works identically in PowerPoint and after import into Keynote. Always save a copy of the original group before ungrouping so you can restore the layout quickly if needed.
Why Choose ImagineLayout Versions of These Templates
ImagineLayout versions draw directly from consulting frameworks used in real client engagements at firms like McKinsey and BCG. The layouts prioritize decision-making clarity over decorative extras so every silhouette serves a specific business question. Other marketplaces often supply generic versions with limited poses or styles that require additional rework to fit high-stakes decks. Here the focus stays on clean data flow and brand consistency without extra steps. The result is a set of templates that consultants and executives actually reuse across multiple quarters and projects because they fit the workflow of board meetings and strategy sessions exactly.
FAQ
How do I download the PowerPoint templates from this category?
After adding any template to your cart and completing the checkout process you receive an email with direct download links. The files arrive in standard .pptx format ready to open in PowerPoint 2010 or newer. You can also access all purchased files anytime from your account dashboard on the site. The process takes under two minutes once payment is confirmed and works on both Windows and Mac systems.
Are these templates compatible with Keynote?
Yes the templates import into Keynote with only minor formatting adjustments needed in most cases. Open the .pptx file directly in Keynote and the silhouette elements retain their editable properties including colors and grouping. You may need to regroup objects after import but the overall layout and proportions stay intact. This compatibility lets teams using mixed software environments share the same files without rebuilding slides from scratch.
Can I fully customize the silhouettes in the templates?
Every element including individual figures, colors, sizes, and arrangement groups can be changed using standard PowerPoint or Keynote tools. You can add new silhouettes, recolor entire teams, and adjust spacing to fit your data. Vector graphics ensure no quality loss during edits or resizing. This full flexibility supports last-minute updates right before a training workshop while keeping the design consistent across your entire presentation.
What licensing applies to the downloaded templates?
The license permits use in any number of your own business or academic presentations including client work and internal reports. You may not resell or redistribute the template files themselves as standalone products. Commercial use in paid workshops or conferences is allowed as long as the focus remains on your content rather than the template design. This arrangement gives teams freedom to apply the files across multiple projects without additional fees.
Do the templates include options for different chart variations?
Yes the collection contains single person icons, team group arrangements, process flow silhouettes, and demographic breakdowns. Each variation comes with several layout options so you can pick the one that best matches your data story. All variations remain fully editable and follow the same consistent style guidelines. This range covers most people-related scenarios encountered in HR analytics, market segmentation, and training materials without needing to combine multiple files.