Pyramids PowerPoint Charts
These pyramid chart templates for PowerPoint and Keynote deliver ready-made layouts that show progressive stages or ranked priorities so a finance director never spends the first hour manually stacking triangles. The collection is built for analysts and strategy leads who must communicate layered concepts to leadership teams.
Imagine the sales lead preparing the annual funnel review for the board: he drops quarterly targets into the pre-linked charts, the colors update automatically, and the visual story is complete before the meeting starts.
Choose the layout that matches your hierarchy and open the file.
 (13)
(13) Gender Equality in the Labour Market PowerPoint Template and ChartsID: #PC01156$15.00
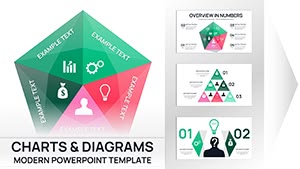 (8)
(8) Conceptual Plan PowerPoint Charts - 29 Strategic Framework Slides for Executive Presentations | Fully EditableID: #PC01111$18.00
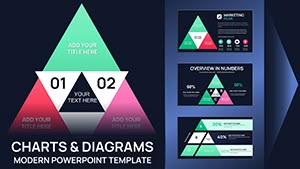 (15)
Triangle Pyramid Chart Template PowerPoint DownloadID: #PC01097$15.00
(15)
Triangle Pyramid Chart Template PowerPoint DownloadID: #PC01097$15.00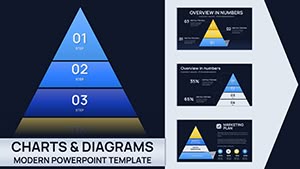 (13)
Layered Pyramid Chart Template PowerPoint - 36 SlidesID: #PC01093$20.00
(13)
Layered Pyramid Chart Template PowerPoint - 36 SlidesID: #PC01093$20.00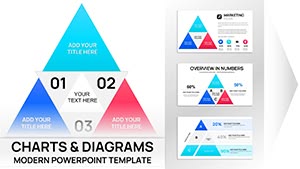 (14)
Triangle Pyramid Charts for PowerPoint - 28 SlidesID: #PC01092$15.00
(14)
Triangle Pyramid Charts for PowerPoint - 28 SlidesID: #PC01092$15.00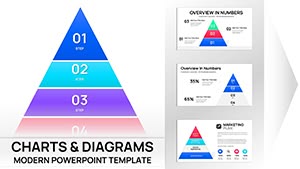 (13)
Classic Pyramid Charts PowerPoint TemplateID: #PC01069$20.00
(13)
Classic Pyramid Charts PowerPoint TemplateID: #PC01069$20.00 (544)
(544) Professional Leadership PowerPoint Charts: Inspire and Lead with ClarityID: #PC01065$18.00
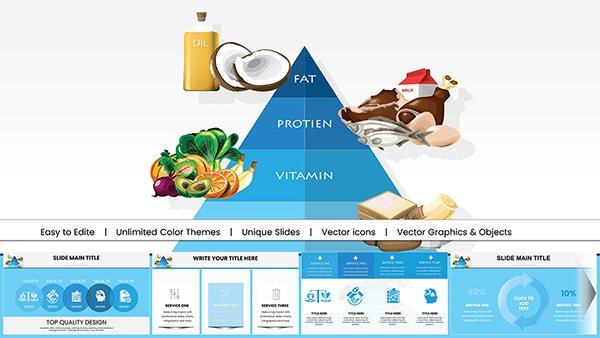 (356)
(356) Food Pyramid PowerPoint Charts for NutritionID: #PC00989$18.00
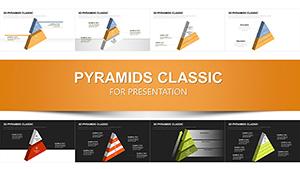 (793)
Infographic 3D Pyramids PowerPoint Charts TemplateID: #PC00290$23.00
(793)
Infographic 3D Pyramids PowerPoint Charts TemplateID: #PC00290$23.00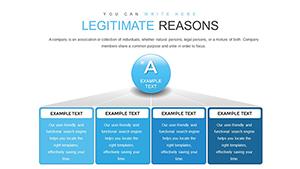 (394)
Legitimate Business Success PowerPoint Charts Template: Unlock Professional ExcellenceID: #PC00872$18.00
(394)
Legitimate Business Success PowerPoint Charts Template: Unlock Professional ExcellenceID: #PC00872$18.00 (649)
Pyramid Hierarchy Diagrams - Editable PPTX | ImagineLayoutID: #PC00857$16.00
(649)
Pyramid Hierarchy Diagrams - Editable PPTX | ImagineLayoutID: #PC00857$16.00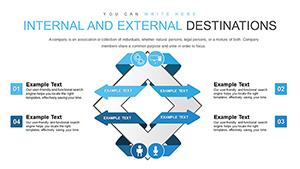 (1197)
Internal And External Destinations PowerPoint Charts TemplateID: #PC00848$15.00
(1197)
Internal And External Destinations PowerPoint Charts TemplateID: #PC00848$15.00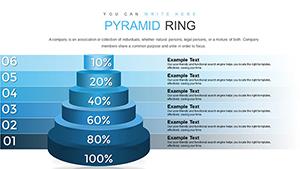 (625)
Pyramid Ring PowerPoint Charts TemplateID: #PC00847$18.00
(625)
Pyramid Ring PowerPoint Charts TemplateID: #PC00847$18.00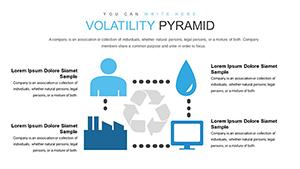 (273)
Volatility Pyramid PowerPoint Charts Template: Elevate Your Financial NarrativesID: #PC00842$10.00
(273)
Volatility Pyramid PowerPoint Charts Template: Elevate Your Financial NarrativesID: #PC00842$10.00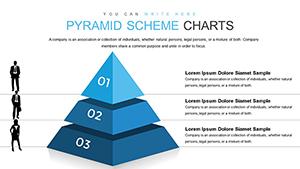 (309)
Pyramid Scheme PowerPoint Template: Empower Awareness and PreventionID: #PC00816$18.00
(309)
Pyramid Scheme PowerPoint Template: Empower Awareness and PreventionID: #PC00816$18.00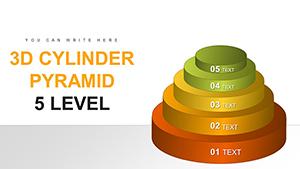 (972)
3D Cylinder Pyramid PowerPoint Charts: Elevate Multi-Level DataID: #PC00746$17.00
(972)
3D Cylinder Pyramid PowerPoint Charts: Elevate Multi-Level DataID: #PC00746$17.00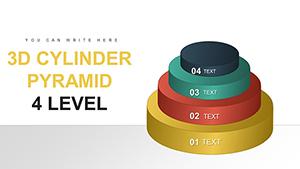 (614)
Transform Your Data into Dynamic 3D Stories with Our Cylinder Pyramid PowerPoint TemplateID: #PC00745$17.00
(614)
Transform Your Data into Dynamic 3D Stories with Our Cylinder Pyramid PowerPoint TemplateID: #PC00745$17.00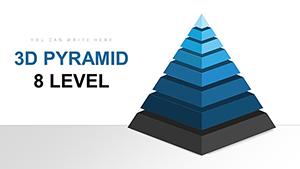 (1100)
8-Level 3D Pyramids PowerPoint Charts Template: Visualize Hierarchies with DepthID: #PC00730$22.00
(1100)
8-Level 3D Pyramids PowerPoint Charts Template: Visualize Hierarchies with DepthID: #PC00730$22.00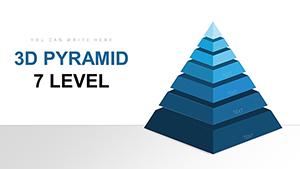 (203)
3D Pyramid PowerPoint Charts: 7-Level Template for Immersive DataID: #PC00729$22.00
(203)
3D Pyramid PowerPoint Charts: 7-Level Template for Immersive DataID: #PC00729$22.00 (771)
3D Shapes Pyramids PowerPoint Charts Template: Build Compelling StructuresID: #PC00728$20.00
(771)
3D Shapes Pyramids PowerPoint Charts Template: Build Compelling StructuresID: #PC00728$20.00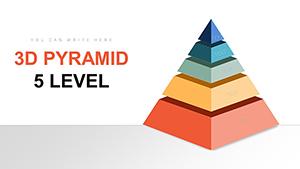 (17)
5-Level 3D Pyramid PowerPoint Charts Template: Unlock Hierarchical InsightsID: #PC00727$20.00
(17)
5-Level 3D Pyramid PowerPoint Charts Template: Unlock Hierarchical InsightsID: #PC00727$20.00 (170)
3D Pyramid PowerPoint Charts - Editable PPTX | ImagineLayoutID: #PC00726$20.00
(170)
3D Pyramid PowerPoint Charts - Editable PPTX | ImagineLayoutID: #PC00726$20.00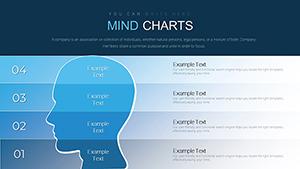 (1145)
Mind PowerPoint Charts - Download Template PresentationID: #PC00657$20.00
(1145)
Mind PowerPoint Charts - Download Template PresentationID: #PC00657$20.00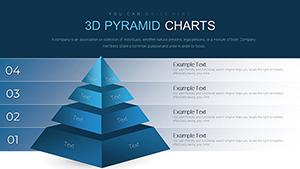 (239)
3D Pyramid PowerPoint Template for Hierarchies - Fully Editable & Instant DownloadID: #PC00652$24.00
(239)
3D Pyramid PowerPoint Template for Hierarchies - Fully Editable & Instant DownloadID: #PC00652$24.00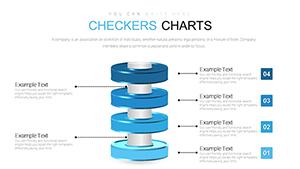 (459)
Checkers Pyramid PowerPoint Charts Template: Revolutionize Your Visual NarrativesID: #PC00645$15.00
(459)
Checkers Pyramid PowerPoint Charts Template: Revolutionize Your Visual NarrativesID: #PC00645$15.00 (324)
Price Strategy PowerPoint Charts: Master Pricing DynamicsID: #PC00608$22.00
(324)
Price Strategy PowerPoint Charts: Master Pricing DynamicsID: #PC00608$22.00 (703)
Maslow Needs Pyramid PowerPoint Charts TemplateID: #PC00598$23.00
(703)
Maslow Needs Pyramid PowerPoint Charts TemplateID: #PC00598$23.00 (1156)
World Economic Situation PowerPoint Charts: Presentation TemplateID: #PC00591$24.00
(1156)
World Economic Situation PowerPoint Charts: Presentation TemplateID: #PC00591$24.00 (425)
Economic Condition PowerPoint Charts TemplateID: #PC00588$20.00
(425)
Economic Condition PowerPoint Charts TemplateID: #PC00588$20.00 (836)
Strategic Balance Planning PowerPoint Charts - Presentation TemplateID: #PC00575$22.00
(836)
Strategic Balance Planning PowerPoint Charts - Presentation TemplateID: #PC00575$22.00 (1184)
Helpful Tips PowerPoint Chart Template for Engaging InfographicsID: #PC00572$20.00
(1184)
Helpful Tips PowerPoint Chart Template for Engaging InfographicsID: #PC00572$20.00 (196)
Workflow Business Process PowerPoint Chart TemplateID: #PC00569$22.00
(196)
Workflow Business Process PowerPoint Chart TemplateID: #PC00569$22.00 (46)
Loyalty Factors PowerPoint Charts: Build Stronger Connections VisuallyID: #PC00565$18.00
(46)
Loyalty Factors PowerPoint Charts: Build Stronger Connections VisuallyID: #PC00565$18.00
Which Pyramid Layout Best Matches Your Specific Hierarchy Story
Some decks need a classic four-layer sales funnel while others require a five-tier organizational model or a nutrition-style food pyramid. These files give you both 2D and 3D variants plus data-linked versions so you select once and the rest of the deck follows the same visual grammar.
Real-World Uses That Turned Numbers Into Immediate Decisions
A product director presents feature-priority ranking to the steering committee. Using the Layered Pyramid Chart Template she places high-impact items at the base and shows resource allocation narrowing upward; the committee instantly agrees on funding cuts to the top tier.
An operations manager maps process maturity across five sites. The Triangle Pyramid Charts template visualizes each site`s stage; leadership spots the lagging location and allocates training budget before the quarter closes.
A marketing lead shows brand-awareness progression for a new campaign. The Classic Pyramid Charts template illustrates awareness to advocacy layers; the CMO approves media spend increase on the spot.
A consultant explains Maslow`s hierarchy to a client HR team. The Food Pyramid PowerPoint Charts template repurposed for needs levels makes the abstract model concrete and the client adopts the framework for their wellness program.
What You Lose When You Stack Shapes Manually
You must decide exact percentages for each layer, align every triangle edge across slides, choose a color palette that passes accessibility checks, and then recheck every chart when data updates. Those steps eat the exact time you needed for the insight itself.
How Structured Charts Keep 60-Slide Decks Coherent Across Departments
Once the slide master holds the corporate palette and chart style, every new pyramid slide inherits the settings. Finance can update numbers in the linked Excel and the visuals refresh without reformatting. The entire reporting package stays visually uniform even when four teams contribute.
One Technical Detail That Prevents Chart Drift in PowerPoint
Always link the chart data to an external Excel file rather than embedding. When you refresh the source the pyramid layers scale automatically while preserving your custom colors and labels. This keeps the 16:9 aspect ratio intact even after multiple updates.
Why These Files Are Built for Corporate Storytelling
No decorative gradients or unnecessary 3D shadows. Every element serves the data. You retain full control over text size, line weights, and legend placement so the slide meets brand guidelines and still reads clearly from the back of the boardroom.
Picking the Right Companion Collection for Your Next Deliverable
When you need connection maps rather than layered ranks the relationship keynote templates handle stakeholder networks. For regulated documentation the medical Word templates cover hospital protocols. For print sales materials the automotive brochure templates manage tri-fold vehicle specs.
If your hierarchy story is the missing visual the full pyramid chart collection is ready to open.
Do these pyramid charts work in both PowerPoint and Keynote?
Yes, every file is provided in native PPTX and Keynote formats. The data links and shape groups behave identically in both; only the interface names differ. If you switch platforms mid-project the exported PDF remains pixel-perfect regardless of the source application.
Can I update the numbers without rebuilding the entire pyramid?
All charts are data-linked. Change the source Excel or embedded table once and the layer heights and percentages recalculate automatically while your custom colors and labels stay locked. This eliminates the usual copy-paste errors that appear when someone edits a static shape.
What license allows sharing inside my company?
The license permits unlimited internal use and client presentations. You may distribute the PPTX or Keynote files to colleagues and embed the charts in shared decks. Resale of the original template files is not allowed.
Do the files support 16:9 and 4:3 aspect ratios?
Each template ships with both 16:9 and 4:3 masters. Switch the slide size in PowerPoint or Keynote and the pyramid scales proportionally without distortion because the shapes are grouped and percentage-based rather than fixed-pixel.
How do I keep the corporate palette consistent across every chart?
Update the theme colors on the slide master once; every pyramid chart inherits the new palette on the next refresh. The data-linked versions also pull the updated scheme so a single change propagates through the entire 50-slide reporting deck.