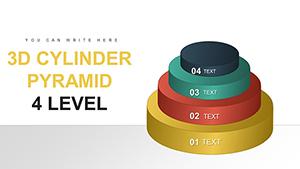
3D Cylinder Pyramid PowerPoint Charts: Elevate Multi-Level Data

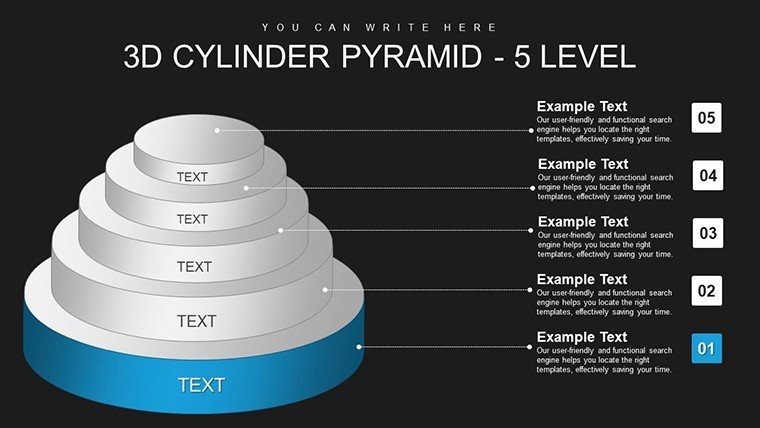
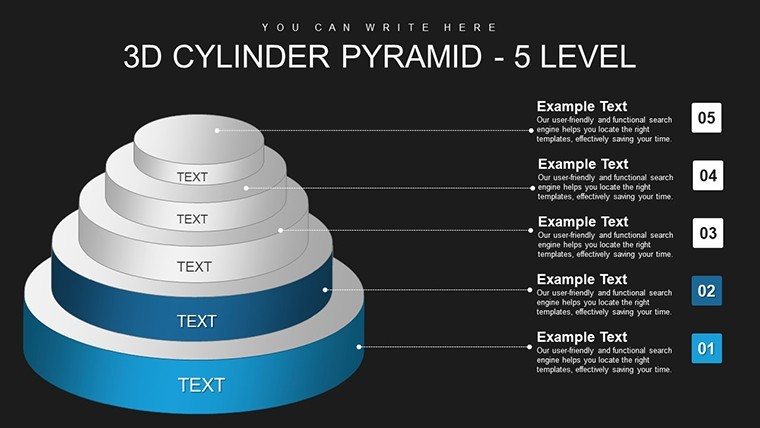
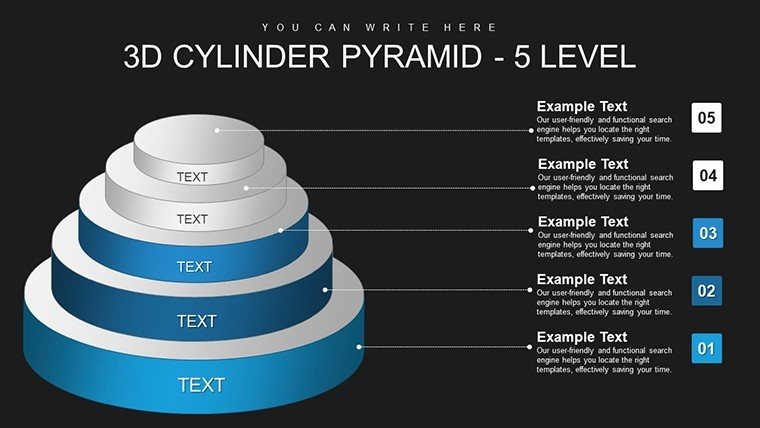

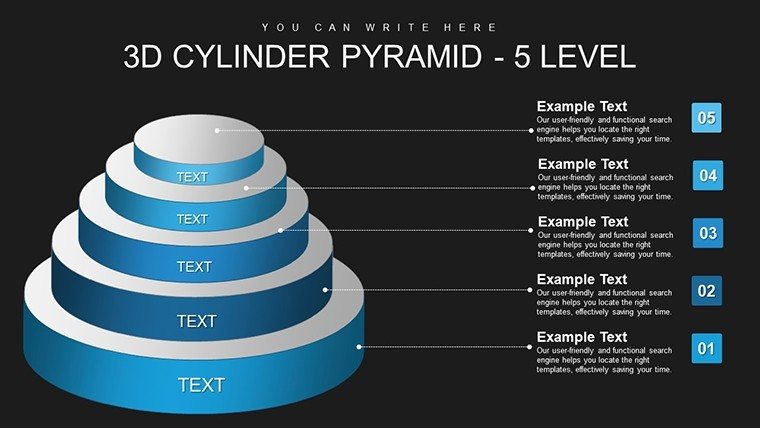


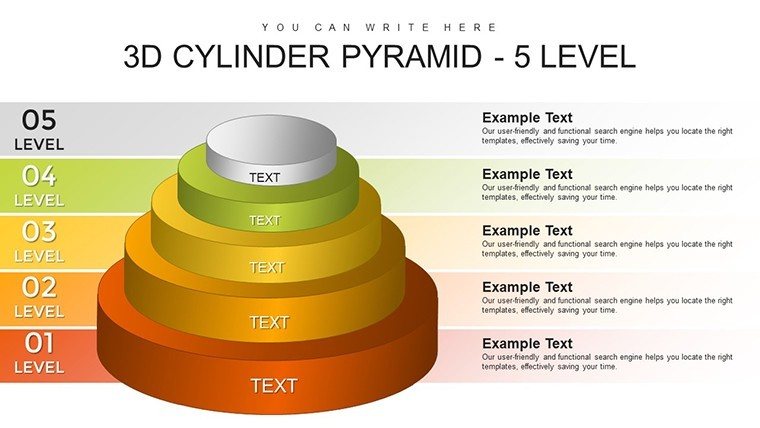
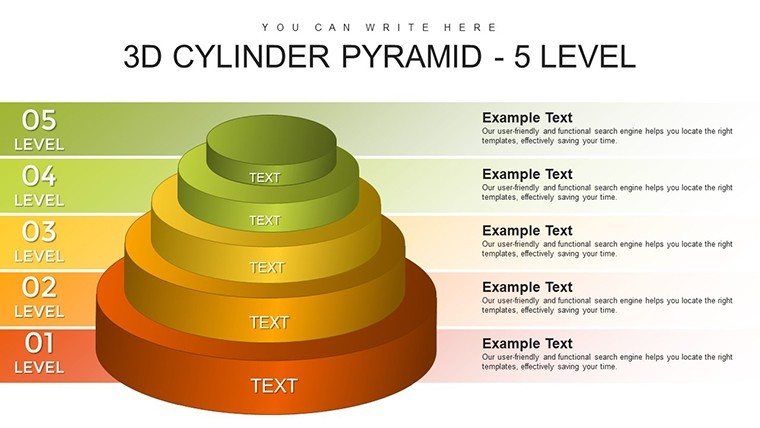

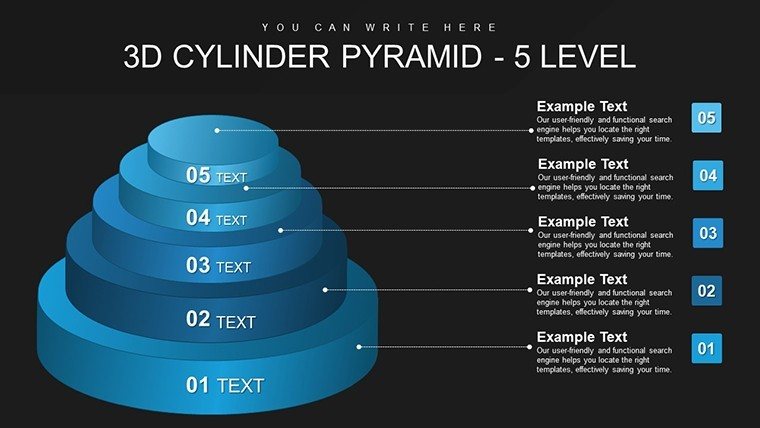

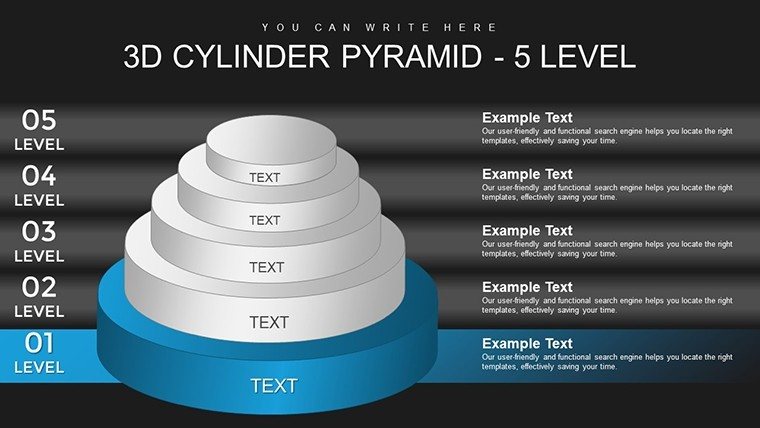
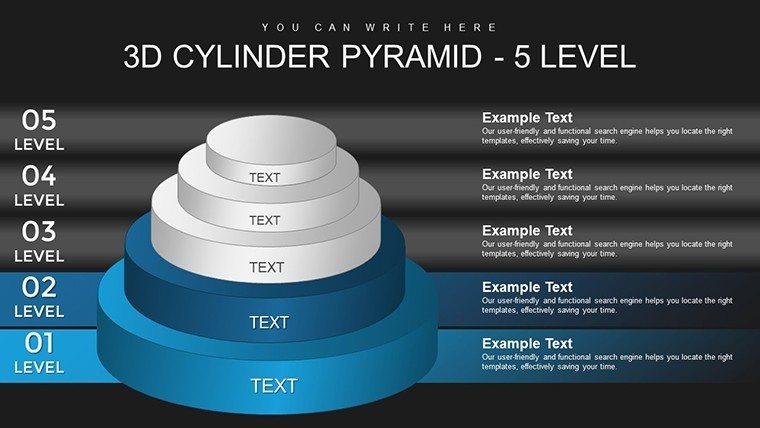

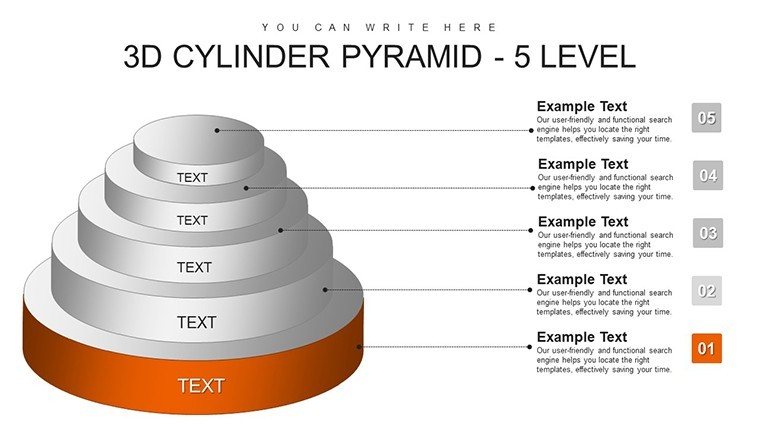


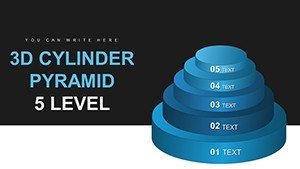


Visualize the ascent of your ideas with our 3D Cylinder Pyramid PowerPoint Charts Template, where data builds layer by layer into towering insights. This 26-slide powerhouse, blending 3D and pyramid elements, is perfect for professionals unraveling multi-tiered concepts - from business hierarchies to research frameworks. Address the hurdle of flat presentations by adding dimensional depth that draws viewers in, much like architectural models bring blueprints to life. With five levels for progressive detail, it's suited for executives outlining strategies or educators dissecting theories. Instant downloads and easy edits mean you're presentation-ready in minutes, backed by design tenets from the Bauhaus movement for timeless appeal. Transform complexity into clarity, inspiring action in boardrooms or classrooms, and witness engagement soar as in acclaimed case studies from Stanford's design school.
Innovative Features for Immersive Visuals
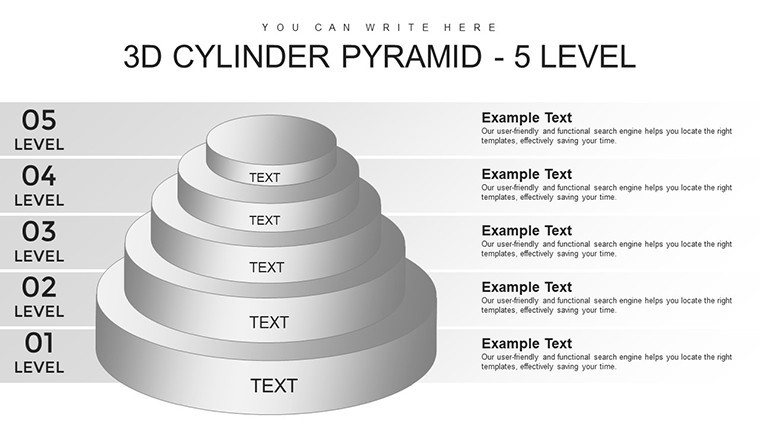
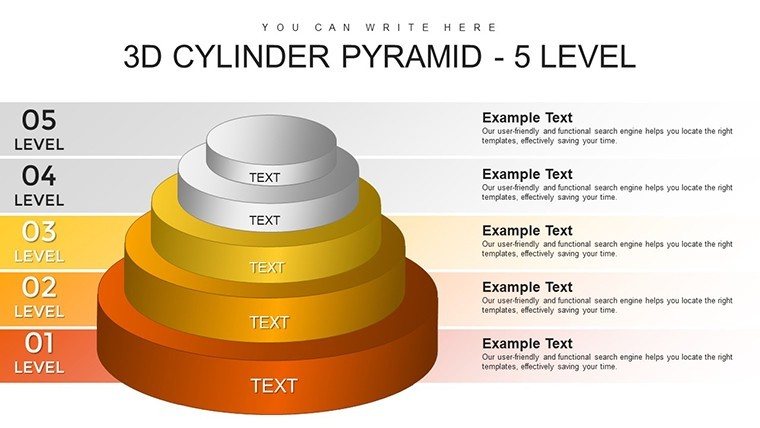
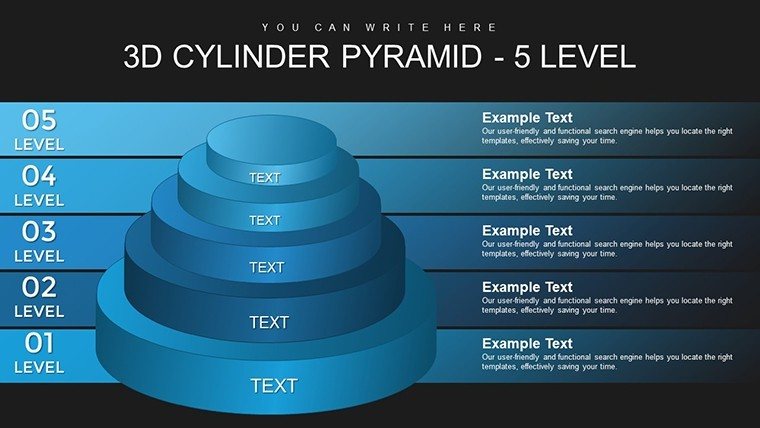
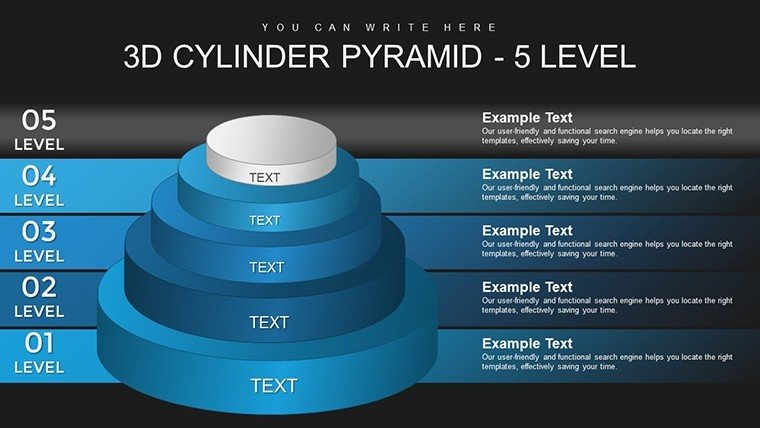
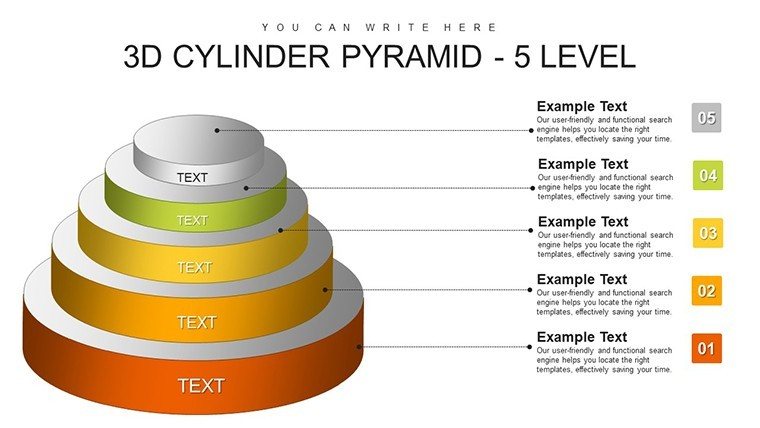
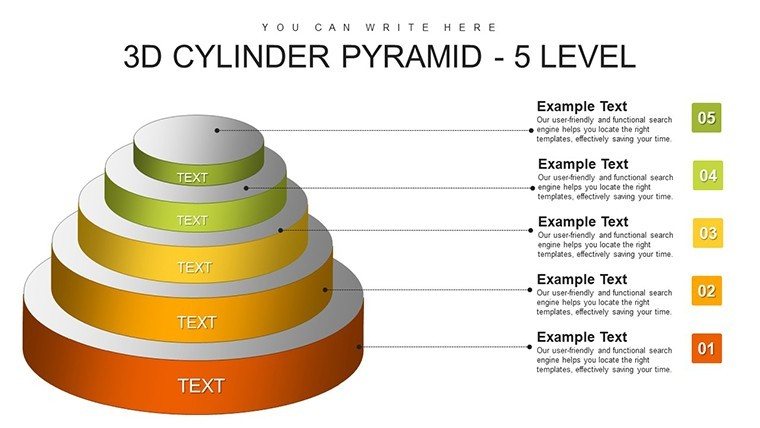
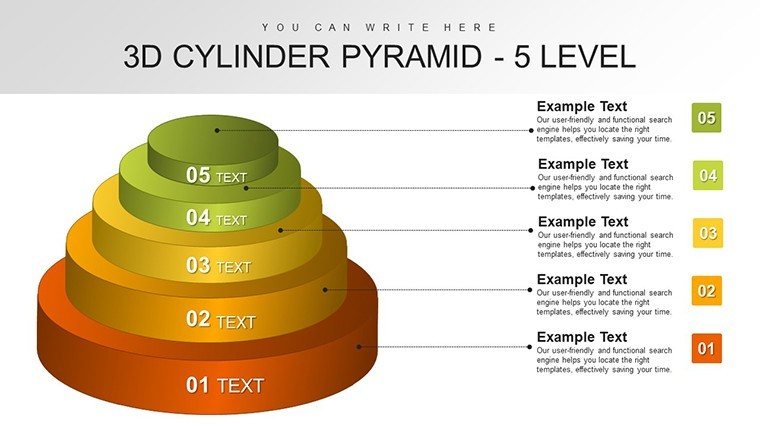
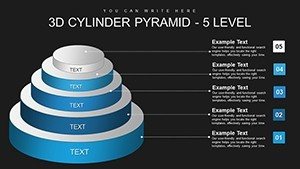
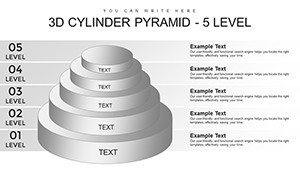
The template's allure stems from its 3D cylinder integration, creating pyramidal stacks that rotate for multi-angle views. 26 editable slides offer customization galore: alter heights for emphasis, swap colors for branding, and insert content seamlessly. High-quality vectors scale without loss, while font flexibility ensures readability. Surpassing basic pyramids, it includes shadow effects for realism and animation paths for level-by-level builds. Authoritative through alignment with visual communication standards from the IDSA, it empowers users to craft narratives that resonate.
Slide-by-Slide Exploration
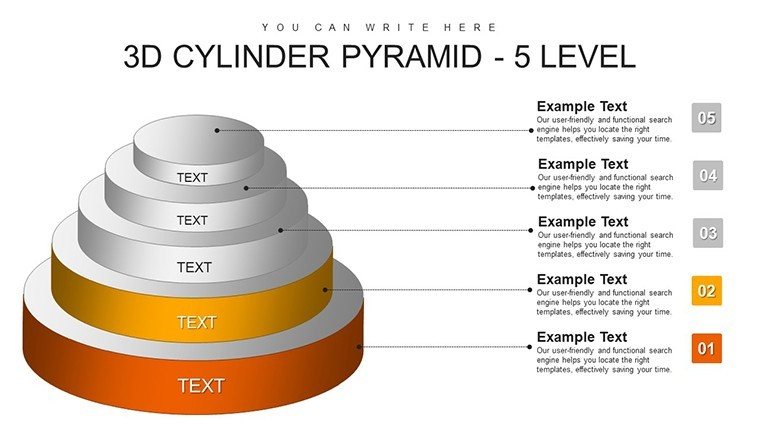
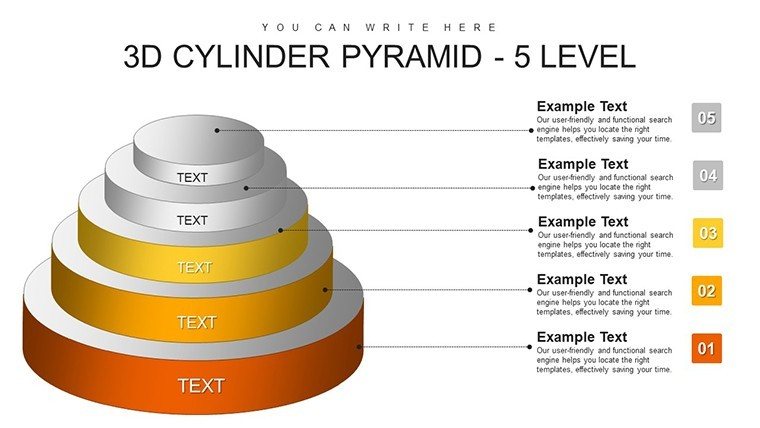
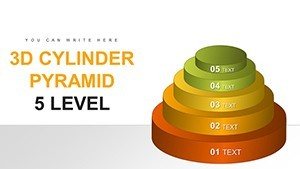
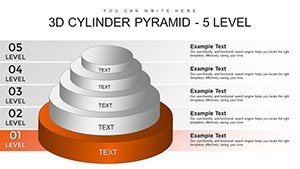
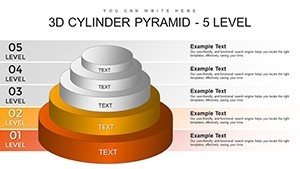
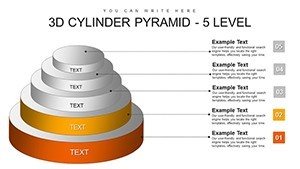
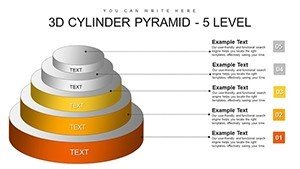
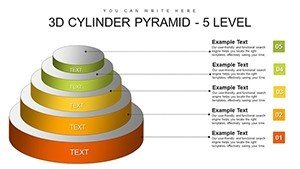
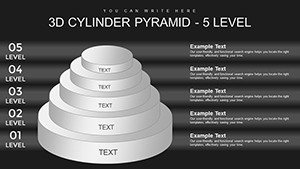
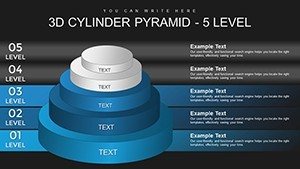
- Slides 1-5: Single to Multi-Level Builds - Start simple, escalating to five cylinders for depth, perfect for foundational concepts.
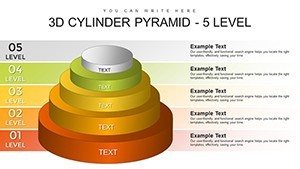
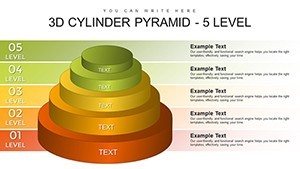
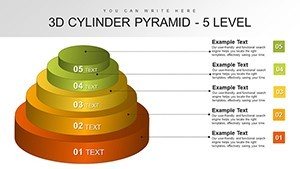
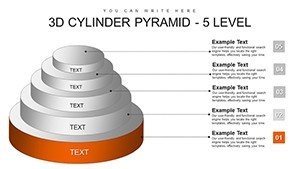
- Slides 6-10: Customization Showcases - Demonstrate tweaks with example data, including icon insertions for enhancement.
- Slides 11-15: Hierarchical Applications - Apply to org structures or process flows, with editable labels for specificity.
- Slides 16-20: Advanced 3D Rotations - Feature interactive elements for dynamic presentations.
- Slides 21-26: Summaries and Extensions - Conclude with integrated CTAs and expandable levels.
This layout fosters intuitive navigation, outpacing standard tools with its dimensional versatility.
Versatile Use Cases for Real Impact
Business leaders use it for growth models, stacking levels to show progression - similar to Amazon's leadership principles visuals. Researchers map findings, with cylinders representing data layers for clearer peer reviews. Educators illustrate ecosystems, engaging students as per Montessori methods. In architecture firms, mimic building phases, aligning with AIA project standards. Integration tips: Sketch your levels, input into cylinders, refine visuals, and preview rotations. Infuse inspiration: "Build your data empire, one cylinder at a time!" for a motivational edge. Versus free templates, this provides premium 3D rendering for professional polish.
Adoption Roadmap
- Identify your multi-level data structure.
- Populate cylinders with key points.
- Customize aesthetics and test interactivity.
- Gather input and adjust.
- Deliver and evaluate effectiveness.
These guidelines, drawn from design pros, ensure authoritative results.
Why This Template Excels
Outshine ordinary with 3D innovation that adds perceived value. Benefits encompass engagement boosts, time savings, and expert-level polish. LSI integration like "layered pyramid visuals" flows naturally. CTAs such as "Stack your success - customize now" spur downloads. Trust builds via compatibility and quality assurances.
Ascend to new heights - grab this template and layer your legacy.
Frequently Asked Questions
How 3D are the cylinders?
Fully rendered for rotation and depth, editable in PowerPoint.
Can levels be added?
Yes, duplicate and stack for more than five.
Suitable for virtual presentations?
Perfectly, with smooth animations over Zoom.
What about color blindness?
Custom palettes support accessibility standards.
Any tutorials included?
Basic guides in notes for quick starts.