Process Keynote Diagrams
This collection contains process diagram layouts built specifically for Apple Keynote - slides designed to show how steps connect, how decisions branch, and how cycles repeat. It is for operations directors, product managers, HR business partners, and consultants who need to make a workflow legible to an audience that has not lived inside it.
A product manager running a quarterly OKR review and a consultant mapping implementation phases for a client pitch have the same core problem: the sequence needs to read in the first ten seconds without the presenter walking through every arrow. These templates solve that by embedding the connection logic and visual hierarchy before you open the file - shapes are already proportioned, arrowheads match, stage labels sit correctly within each box.
The collection covers linear sequences, branching flows, iterative cycles, and cause-effect layouts. Browse below and open the file that matches your next presentation deadline.
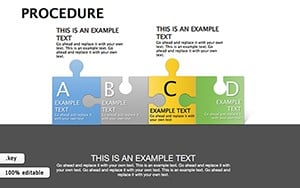 (829)
(829) Procedure Keynote Diagrams TemplateID: #KD00192$20.00
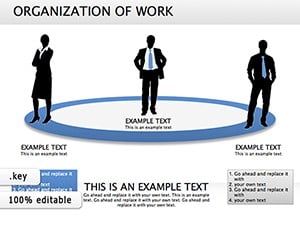 (100)
(100) Organization of Work Keynote Diagrams: Structure Success EffortlesslyID: #KD00172$26.00
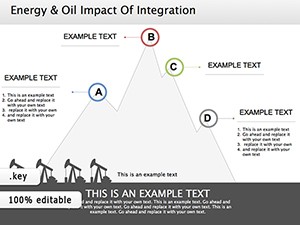 (288)
(288) Crude Oil Energy Keynote Diagrams: Fuel Your InsightsID: #KD00170$20.00
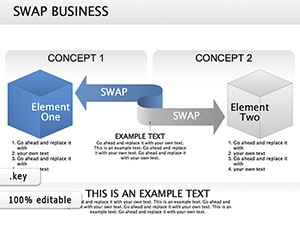 (1010)
Swap Option Keynote diagram templateID: #KD00164$22.00
(1010)
Swap Option Keynote diagram templateID: #KD00164$22.00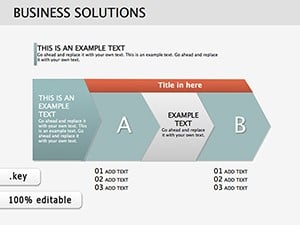 (202)
Business Solutions Keynote Diagrams Template for PresentationID: #KD00163$23.00
(202)
Business Solutions Keynote Diagrams Template for PresentationID: #KD00163$23.00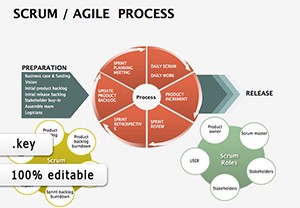 (321)
Scrum Agile Project Keynote Diagrams: Empower Your Team's EfficiencyID: #KD00152$20.00
(321)
Scrum Agile Project Keynote Diagrams: Empower Your Team's EfficiencyID: #KD00152$20.00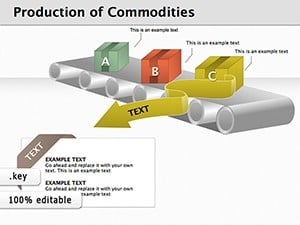 (940)
(940) Production of Commodities Keynote Diagrams: 3D Insights into ManufacturingID: #KD00146$25.00
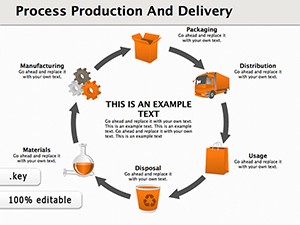 (1056)
Streamline Your Business Presentations with Keynote Diagrams on Process, Production, and DeliveryID: #KD00140$28.00
(1056)
Streamline Your Business Presentations with Keynote Diagrams on Process, Production, and DeliveryID: #KD00140$28.00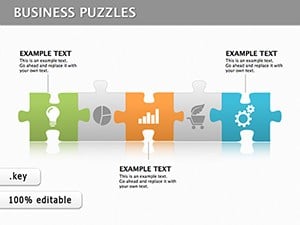 (883)
Puzzle Work Keynote DiagramsID: #KD00134$22.00
(883)
Puzzle Work Keynote DiagramsID: #KD00134$22.00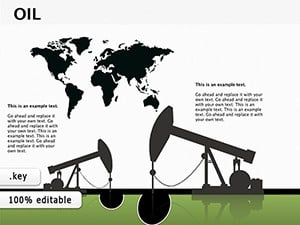 (164)
Oil and Gas Production Presentations with Keynote Diagrams TemplateID: #KD00097$15.00
(164)
Oil and Gas Production Presentations with Keynote Diagrams TemplateID: #KD00097$15.00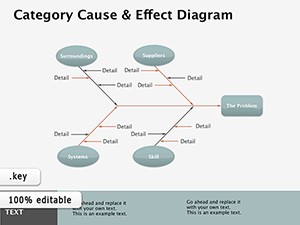 (609)
Cause-Effect Keynote Diagrams: Unlock the Power of Visual ConnectionsID: #KD00082$14.00
(609)
Cause-Effect Keynote Diagrams: Unlock the Power of Visual ConnectionsID: #KD00082$14.00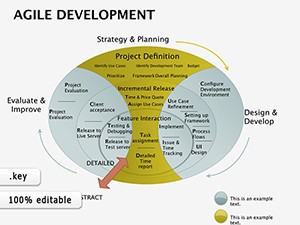 (111)
Agile Development Keynote Diagrams: Chart the Path to Iterative SuccessID: #KD00081$23.00
(111)
Agile Development Keynote Diagrams: Chart the Path to Iterative SuccessID: #KD00081$23.00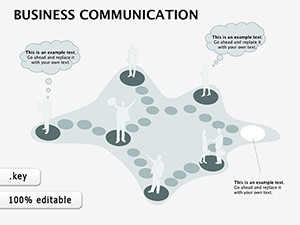 (1182)
Business Communication Keynote Diagrams: Forge Clear Connections in Every PitchID: #KD00080$14.00
(1182)
Business Communication Keynote Diagrams: Forge Clear Connections in Every PitchID: #KD00080$14.00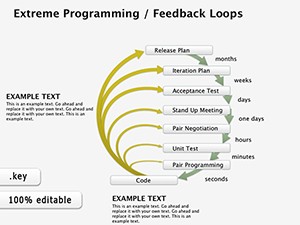 (332)
Extreme Programming - Feedback Loops Keynote diagramID: #KD00079$6.00
(332)
Extreme Programming - Feedback Loops Keynote diagramID: #KD00079$6.00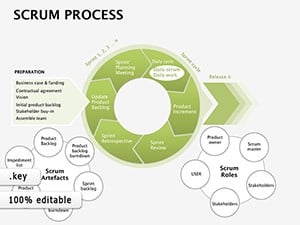 (558)
Scrum Process Keynote Template: Streamline Your Agile JourneyID: #KD00078$15.00
(558)
Scrum Process Keynote Template: Streamline Your Agile JourneyID: #KD00078$15.00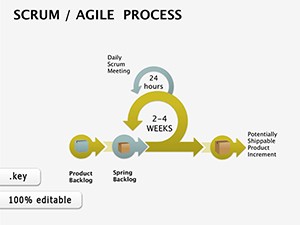 (819)
Agile Keynote Diagrams: Adapt and Conquer Project ChaosID: #KD00077$14.00
(819)
Agile Keynote Diagrams: Adapt and Conquer Project ChaosID: #KD00077$14.00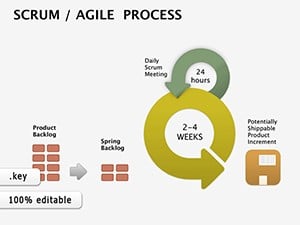 (379)
Scrum Agile Keynote Template: Sprinting Toward Smarter Software StoriesID: #KD00076$16.00
(379)
Scrum Agile Keynote Template: Sprinting Toward Smarter Software StoriesID: #KD00076$16.00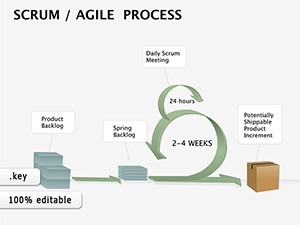 (757)
3D Scrum Agile Process Keynote TemplateID: #KD00075$18.00
(757)
3D Scrum Agile Process Keynote TemplateID: #KD00075$18.00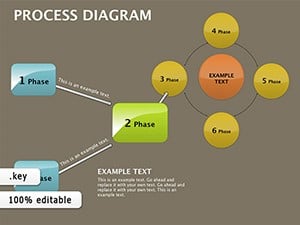 (825)
Process Block Schemes: Illuminating Workflows in KeynoteID: #KD00068$18.00
(825)
Process Block Schemes: Illuminating Workflows in KeynoteID: #KD00068$18.00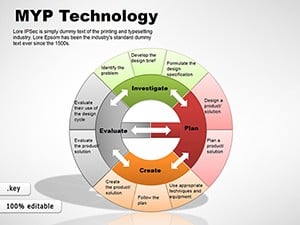 (355)
MYP Design Cycle Keynote Diagrams TemplateID: #KD00048$18.00
(355)
MYP Design Cycle Keynote Diagrams TemplateID: #KD00048$18.00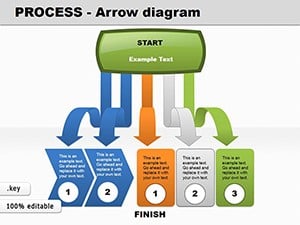 (120)
Process Arrow Keynote Diagrams: Adapt & VisualizeID: #KD00046$20.00
(120)
Process Arrow Keynote Diagrams: Adapt & VisualizeID: #KD00046$20.00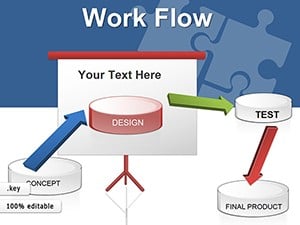 (73)
Workflow Keynote Diagrams: Chart Your Path to EfficiencyID: #KD00039$27.00
(73)
Workflow Keynote Diagrams: Chart Your Path to EfficiencyID: #KD00039$27.00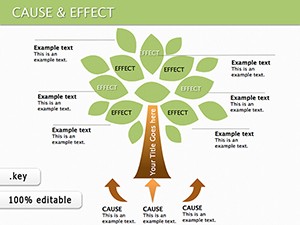 (943)
Cause and Effect Keynote Diagrams: Clarify Complex ConnectionsID: #KD00030$27.00
(943)
Cause and Effect Keynote Diagrams: Clarify Complex ConnectionsID: #KD00030$27.00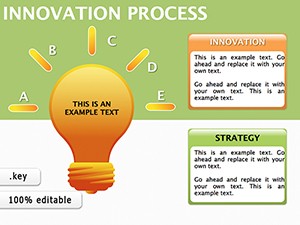 (7)
Innovation Process Keynote Diagrams - Editable .key | ImagineLayoutID: #KD00028$18.00
(7)
Innovation Process Keynote Diagrams - Editable .key | ImagineLayoutID: #KD00028$18.00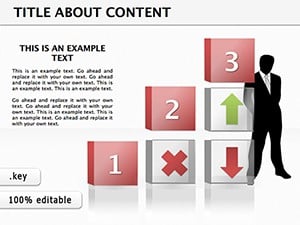 (395)
Business Process Keynote Diagrams: Visualize Workflows EffortlesslyID: #KD00024$18.00
(395)
Business Process Keynote Diagrams: Visualize Workflows EffortlesslyID: #KD00024$18.00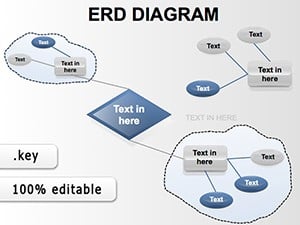 (268)
ERD Keynote Templates: Master Data Models EffortlesslyID: #KD00018$18.00
(268)
ERD Keynote Templates: Master Data Models EffortlesslyID: #KD00018$18.00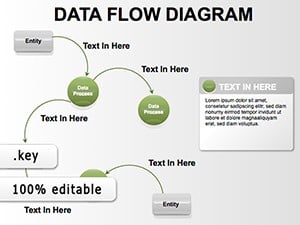 (1039)
Data Flow Keynote Diagrams - Fully Editable KeynoteID: #KD00017$20.00
(1039)
Data Flow Keynote Diagrams - Fully Editable KeynoteID: #KD00017$20.00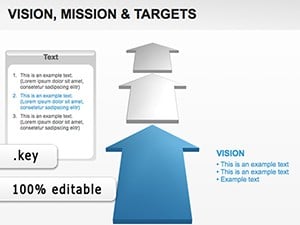 (256)
Vision Keynote Diagram TemplateID: #KD00015$18.00
(256)
Vision Keynote Diagram TemplateID: #KD00015$18.00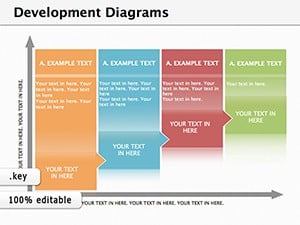 (23)
Sustainable Development Keynote DiagramsID: #KD00013$20.00
(23)
Sustainable Development Keynote DiagramsID: #KD00013$20.00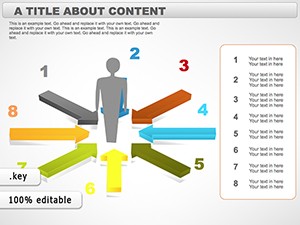 (429)
People Communication Keynote Diagrams TemplateID: #KD00001$20.00
(429)
People Communication Keynote Diagrams TemplateID: #KD00001$20.00
Which Process Diagram Type Matches the Story You Are Telling?
The choice between a linear sequence, a circular process, a cause-effect diagram, and a multi-lane flow is not a design preference - it is a structural argument. Each layout type makes a different claim about how the process works.
Linear Sequence Diagrams
Use these when the process has a defined start and a defined end, and the order of steps is fixed. An HR business partner rolling out a new expense approval policy to 200 employees needs every person to follow the same numbered path. A linear template shows that path without ambiguity - no loop back, no branch, no optional stage. The slide doubles as a handout because the sequence is self-explanatory.
Circular and Iterative Cycle Diagrams
A product manager updating the feature development cycle for a cross-functional sync faces a different structural challenge. The process does not end - it returns to planning after each release. A circular diagram shows that iterative nature cleanly. The Scrum and Agile cycle templates here reflect the sprint-review-retrospective loop that development teams recognize immediately. The visual tells the team this is a continuous system, not a one-time project.
Cause-Effect (Fishbone) Diagrams
A quality manager at a manufacturing firm presenting root cause analysis for a production defect needs a layout that shows contributing factors branching into a central effect. The Fishbone - also called the Ishikawa diagram - is built into this collection because it is a named analytical framework with its own logic. The template provides the spine and branch structure so the presenter focuses on cause categories (equipment, materials, method, environment, people) rather than drawing the diagram from scratch.
Multi-Lane and Swimlane Flows
A consultant mapping a client's order-to-invoice process for a process improvement engagement needs to show which team handles which step. Swimlane diagrams assign each lane to a role or department. The Keynote templates here support this through pre-built horizontal lanes that stay aligned when you add or remove stages. The dependency between lanes - where one team's output becomes another's input - reads without explanation when the arrows cross lanes correctly.
Four Moments Where a Process Template Changed the Outcome of a Presentation
An operations director at a manufacturing company was preparing the supply chain approval process for a quarterly board meeting. Stakeholders wanted to see where delays happen and how the new ERP system addresses them. Instead of spending the evening redrawing boxes, she opened the template, replaced the stage labels with actual process names, and highlighted the bottleneck step in a contrasting color. The board saw the before-and-after in one slide and the discussion moved to investment priorities instead of questioning the diagram.
A consultant was mapping implementation phases for a pitch to an enterprise technology buyer. The timeline was complex, with parallel tracks for user training and system testing. The multi-lane template let him show the dependencies without overlapping text boxes. The client's procurement lead said the diagram made the scope feel manageable - shortening the approval cycle by two weeks.
An HR business partner used a step-by-step process template to explain a new remote-work policy submission path to 800 employees in a town hall. Each step had a clear icon and a two-line description. The slide stayed up for the entire Q&A because attendees kept referencing it. Questions that would have come in over email for weeks were answered in the room.
A product marketing manager presenting the go-to-market launch sequence to senior leadership swapped out the old bullet-point slide for a five-stage linear diagram. The leadership team could see immediately which stage was complete and which was at risk. The conversation shifted from "tell us what's happening" to "what do we need to move stage three forward."
Download a Process Template and Move the Design Work Off Your Plate
The templates are ready below. Open the file, replace the stage labels, and start shaping the conversation instead of the layout.
What the Manual Build Actually Costs in a Real Deadline
Building a process diagram in Keynote from a blank slide means deciding the exact width of each shape so the text inside does not wrap at an awkward break point. Then matching the arrowhead style across all connectors - Keynote's default arrow options vary between shape types. Then distributing the shapes evenly across the slide without a grid, because the default spacing guide does not account for text overflow. Then realizing after 45 minutes that the slide is too wide for the 16:9 aspect ratio and every element needs to shift left.
In a 50-slide deck where the process appears three times - current state, proposed state, and summary - all of those decisions have to be made consistently across all three slides. Inconsistencies in arrow weight or box height are visible to experienced audiences and suggest that different people prepared different sections.
A Practical Tip That Saves Time in Recurring Keynote Decks
The non-obvious move is to build a dedicated slide master layout for each process type your team uses regularly. Keynote allows you to define custom slide masters within the same theme file. Once the process diagram structure lives in a master, any team member can drop a new slide with that layout and get the correct spacing and connection styles automatically. This is especially useful for departments that produce the same process flow every quarter - new content, same structure.
Technical Note: Keeping Connection Lines Stable When You Reorder Slides
In Keynote, connection lines between shapes are tied to the specific shape objects they connect. If you copy a diagram slide into a different deck - or reorder slides within the same file - the connections sometimes detach if the shape IDs reset. To prevent this, always group the entire diagram before copying. The group travels as one object, preserving connection relationships internally. If a line detaches, select the endpoint and use Keynote's smart connection tool to re-snap it to the target shape. When switching from 16:9 to 4:3 aspect ratio, scale the entire group proportionally rather than resizing shapes individually - this keeps spacing consistent.
Why This Collection Is Built for Corporate Workflow Presentations
Every layout in this category starts from the question a business audience actually asks when looking at a process diagram: where does this start, where does it end, and what happens at each decision point? There are no decorative elements that compete with those answers - no gradients, no drop shadows, no icon sets that need to be removed before the slide is usable. The shapes are fully editable native Keynote objects, the connection lines are live, and the typography is set at sizes that work on a projected screen without adjustment.
Choosing the Right Category for Your Full Presentation
Process diagrams typically appear inside a larger deck that needs other visual structures. If the same project requires a decision framework - showing which option was selected and why - the matrix diagram templates for Keynote complement the process flow without requiring a style change. For presentations that include quantitative data alongside the process narrative, the Keynote chart templates provide data visualization slides with consistent visual language. And if the project lives in Microsoft PowerPoint rather than Keynote, the PowerPoint diagram templates cover the same layout types in PPTX format.
Frequently Asked Questions
Can I add or remove stages from the process diagrams without the layout breaking?
Yes. Each diagram is constructed with individual grouped shape elements for each stage. To add a stage, duplicate an existing step shape, position it in sequence, and reconnect the flow line using Keynote's smart connection tool. The connection snaps to the nearest anchor point on the target shape and maintains the arrow style defined in the slide master. To remove a stage, delete the shape and reconnect the preceding and following shapes. The layout proportions may need a minor manual adjustment if you are adding more than two steps to a diagram originally built for four - in that case, select all stage shapes and use the Distribute Horizontally or Vertically command to re-space them evenly.
Do the Keynote process diagram files work on iPad as well as Mac?
The .key files open and are editable in Keynote on iPad with the same features available as on Mac. Shape editing, text replacement, and connection line adjustments all work through the touch interface. The main limitation on iPad is the slide master editor - editing the master layout requires the Mac version of Keynote, as the iPad version allows content editing within existing master layouts but not master structure changes. If your team works across both devices, complete any master-level edits on Mac first, then distribute the updated file for content editing on iPad.
How do I export a Keynote process diagram to PDF while keeping the vector quality sharp?
In Keynote, go to File > Export To > PDF and select Best quality. Because the diagrams use native Keynote shape objects and connection lines rather than embedded images, the PDF export renders everything as vectors - meaning the output stays sharp at any zoom level or print size. Avoid the Reduce file size option if the recipient needs to review the diagram closely, as this option rasterizes some elements. If you have applied sequential stage animations, those do not appear in PDF - only the final state of the slide is captured, which is typically what you want for a printed handout.
Can I use the Fishbone (Cause-Effect) template for root cause analysis outside of manufacturing?
Absolutely. The Fishbone structure is used in quality management, product management, HR investigations, and financial analysis - anywhere a central problem has multiple contributing categories. The template's branch labels are fully editable text boxes, so you can rename the standard manufacturing categories (equipment, materials, method, environment) to categories relevant to your context - for example, process, people, technology, and governance for an IT incident review. The visual structure - central effect on the right, branching causes on the left - remains the same regardless of category labels, so the analytical logic transfers to any industry.
Is there a limit on how many people from my organization can use the same downloaded template?
The standard license allows use by any member of your organization for internal presentations and client deliverables. You can store the file on a shared drive and let multiple team members open their own copy to edit. The license restriction is on redistribution outside your organization - you cannot share the template file publicly or include it in a product sold to others. If your team regularly produces the same type of process presentation, the most efficient approach is to build a department master from the template and save it on a shared location - each new deck starts from the master rather than from the original download.