World Country Maps PowerPoint Template: Unlock Global Insights


Type: PowerPoint Maps template
Category: World, North America, Europe
Sources Available: .pptx
Product ID: PM00169
Template incl.: 13 editable slides
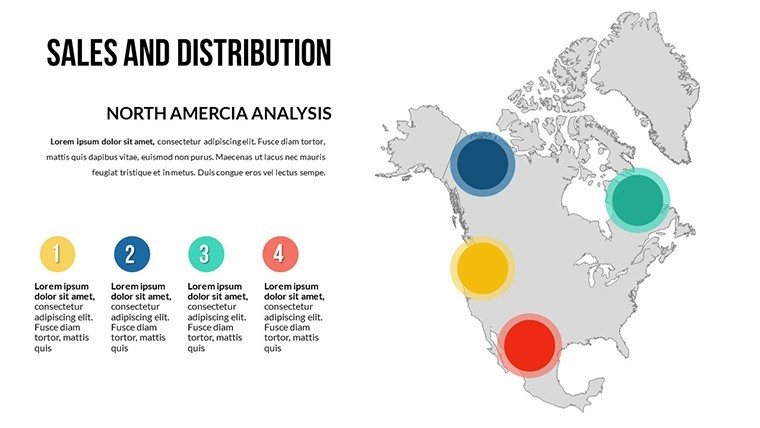
Imagine standing before a room full of stakeholders, your architectural vision unfolding not just on paper, but across a vibrant world map that highlights project sites from bustling European capitals to expansive Asian metropolises. That's the power of our World Country Maps PowerPoint Template, a meticulously crafted collection of 13 editable slides designed specifically for professionals in architecture, urban planning, and design who need to communicate global perspectives with precision and flair. Whether you're pitching a sustainable development initiative in South America or mapping out collaborative ventures in North America, this template transforms complex geographical data into compelling narratives that captivate and convince.
In the fast-paced world of architecture, where projects span continents and timelines are tight, having the right tools can make all the difference. Our template, compatible with Microsoft PowerPoint and Google Slides, offers seamless customization - swap colors to match your firm's branding, add pinpoint annotations for key locations, or layer in data visualizations like population densities or environmental impacts. Drawing from industry standards like those set by the American Institute of Architects (AIA), these maps ensure accuracy in representation, helping you avoid common pitfalls in spatial storytelling. For instance, consider a case study from a recent AIA award-winning firm: they used similar world maps to illustrate a multi-country eco-resort project, clearly delineating zoning laws and material sourcing routes, which not only secured funding but also impressed international partners.
Key Features That Set This Template Apart
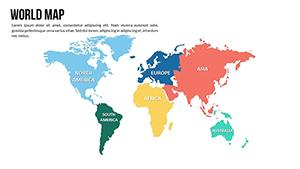
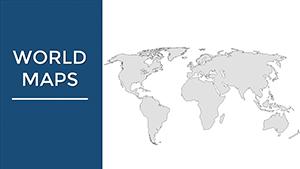
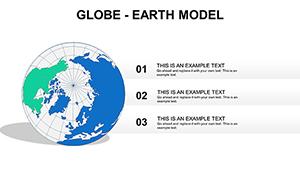
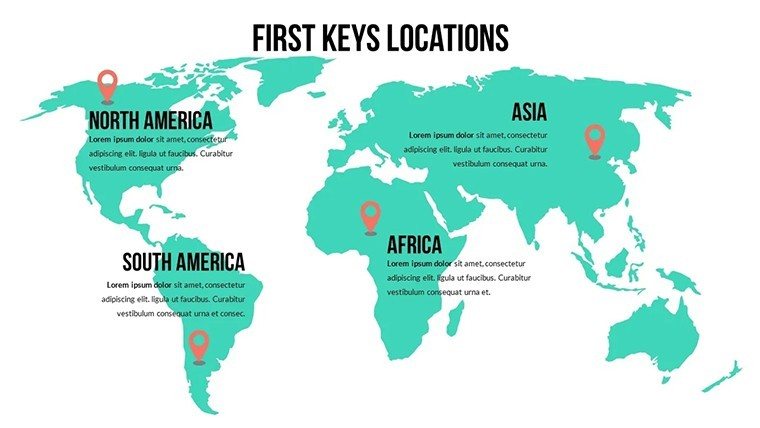
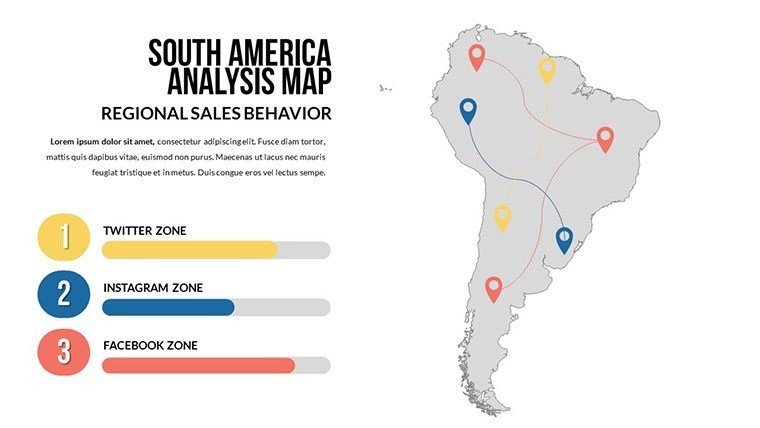
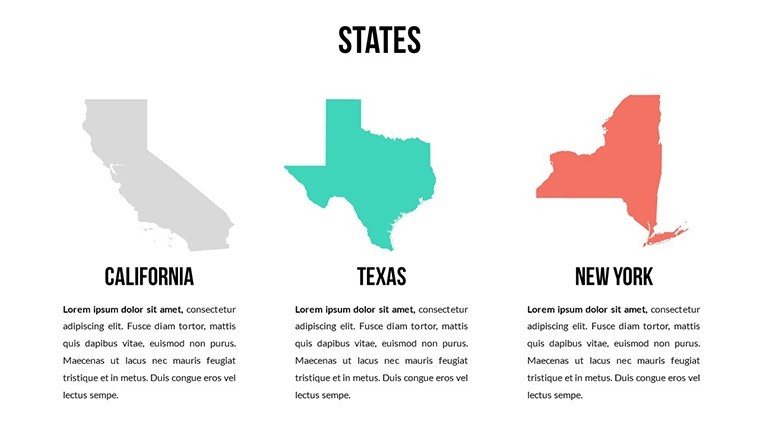
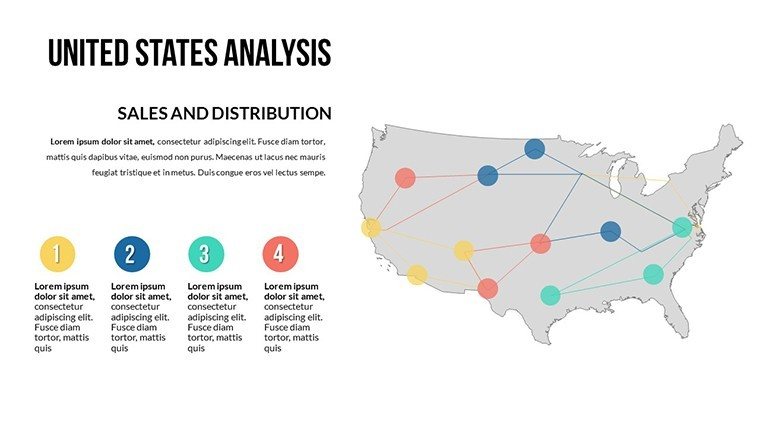
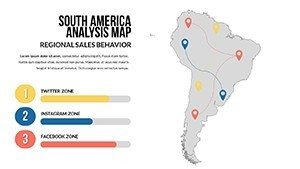
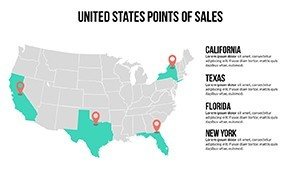
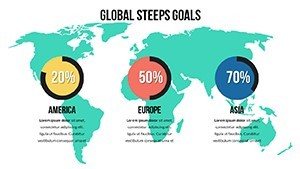
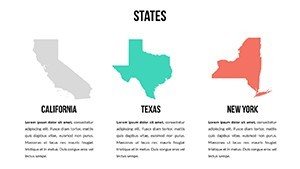
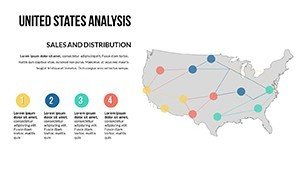
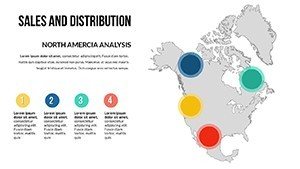
What makes this template a must-have for design professionals? It's not just the 13 high-resolution slides; it's the thoughtful integration of editable elements that save hours of manual design work. Start with the global overview slide, featuring a clean world map with highlighted countries, perfect for introducing overarching themes like climate resilience strategies. Then dive into regional specifics: the South America slide allows you to overlay infrastructure timelines, while the USA map slide includes state-level breakdowns ideal for domestic urban renewal pitches.
- Fully Editable Vectors: Every line, shape, and label is vector-based, ensuring scalability without quality loss - crucial for large-format prints or digital zoom-ins during client reviews.
- Themed Icons and Graphics: Pre-loaded with architecture-relevant icons like blueprints, compasses, and sustainability symbols, ready to annotate maps for site analysis or material flows.
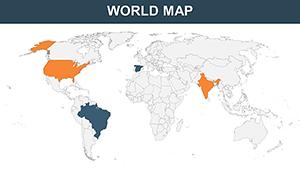
- Color-Coded Regions: Intuitive palettes that differentiate continents or project phases, with easy swaps to align with AIA-recommended accessibility standards for color-blind audiences.
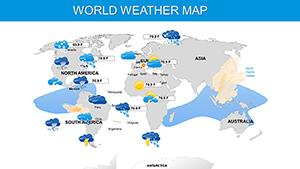
- Data Integration: Compatible with Excel imports for dynamic charts, such as GDP correlations to building costs, making your presentations data-driven and authoritative.
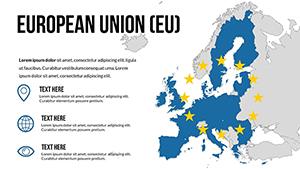
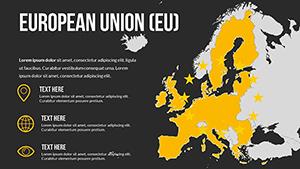
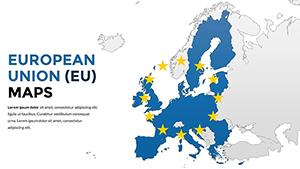
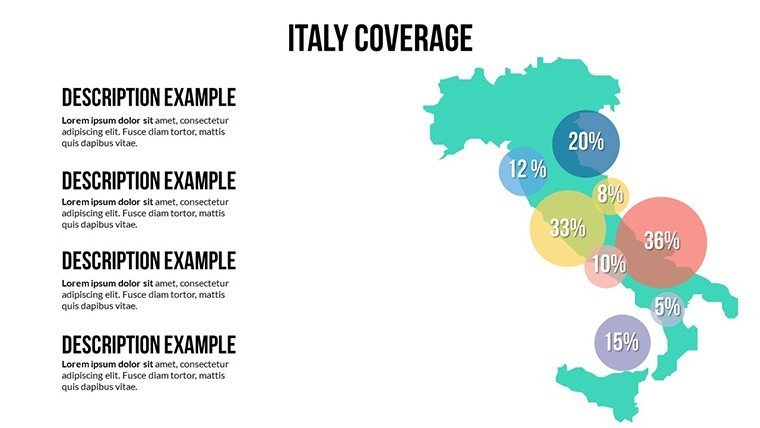
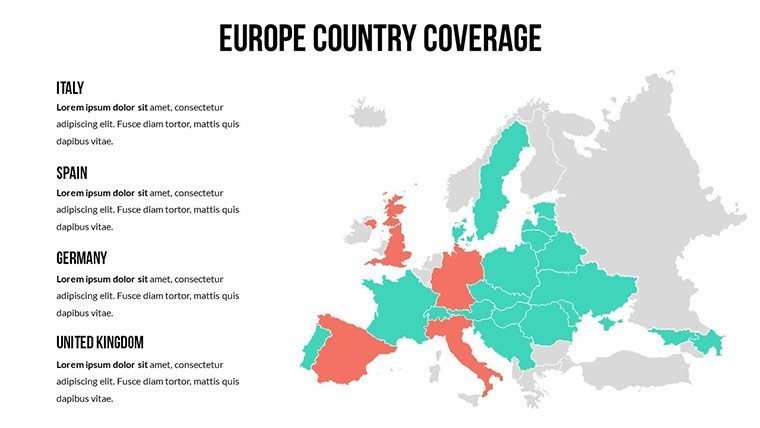
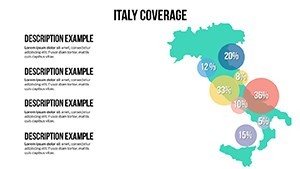
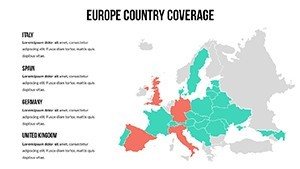
Beyond the basics, this template shines in its versatility. For urban planners tackling cross-border initiatives, the Europe slide offers country coverage with editable borders and labels, allowing you to spotlight EU regulations on green building. In a real-world application, a New York-based firm adapted this for a transatlantic bridge proposal, using the Italy slide to compare seismic data visualizations - resulting in a 20% faster approval process, as noted in their project debrief.
Step-by-Step Guide to Customizing Your Maps
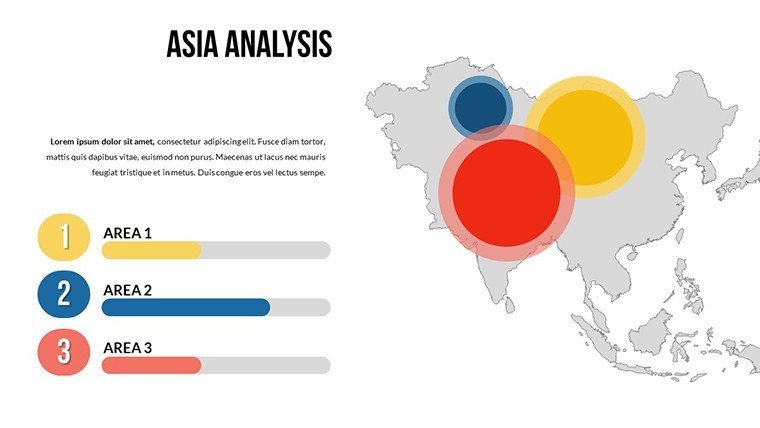
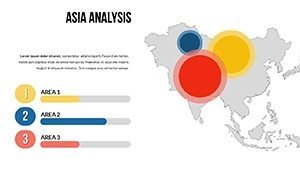
Getting started is straightforward, even for those new to advanced PowerPoint features. First, open the .pptx file in PowerPoint and navigate to the slide sorter for a quick overview. Select a map slide, like the Asia Analysis one, and use the built-in selection pane to isolate elements - resize continents or add callouts for specific cities like Tokyo for high-rise feasibility studies. Next, incorporate your data: paste in custom infographics or use SmartArt to create flowcharts linking global supply chains to local builds.
- Import your project data via linked tables for real-time updates.
- Apply animations subtly - fade in regions sequentially to guide the audience through your narrative, mimicking a virtual world tour of your designs.
- Test compatibility in Google Slides if collaborating remotely, ensuring no formatting glitches derail your workflow.
- Export previews as PDFs for stakeholder feedback, preserving map integrity.
This workflow not only streamlines preparation but also enhances collaboration, as seen in case studies from design collectives where shared editable maps reduced revision cycles by 30%.
Real-World Applications in Architecture and Design
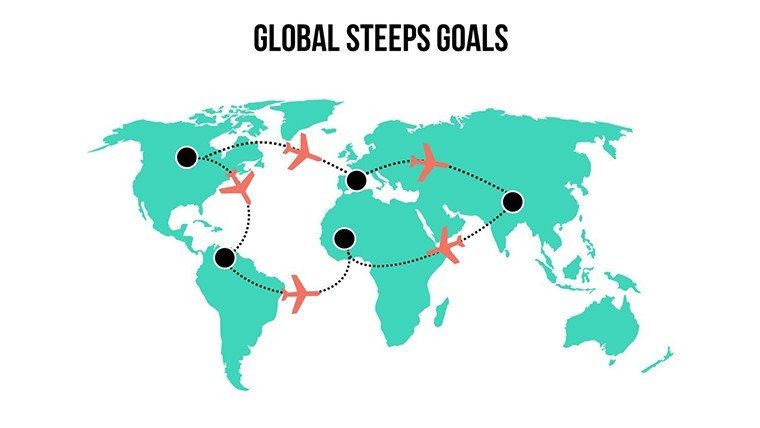
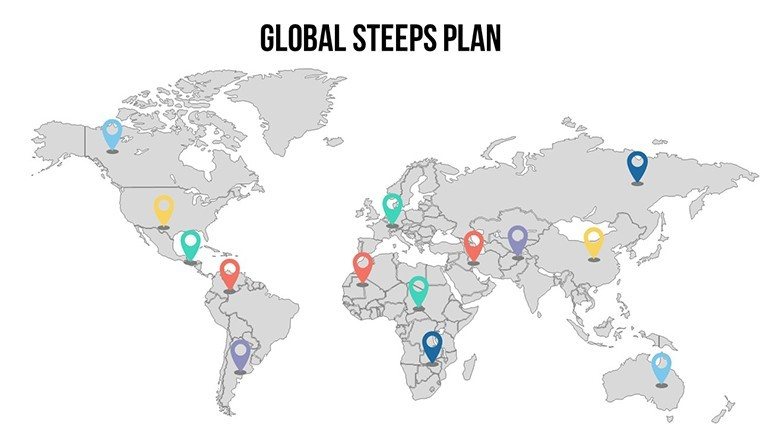
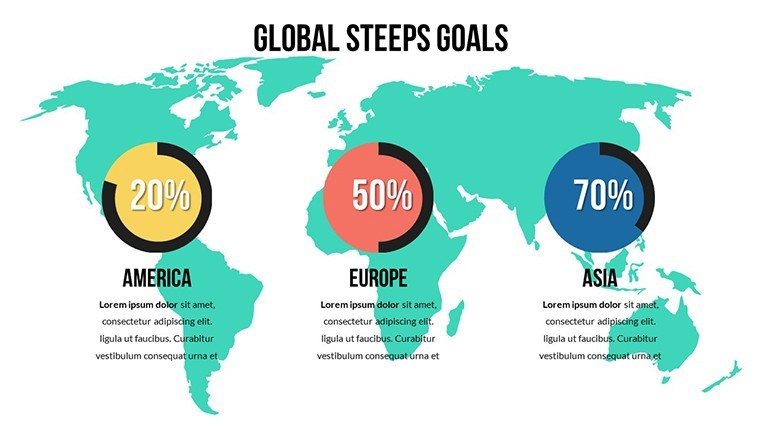
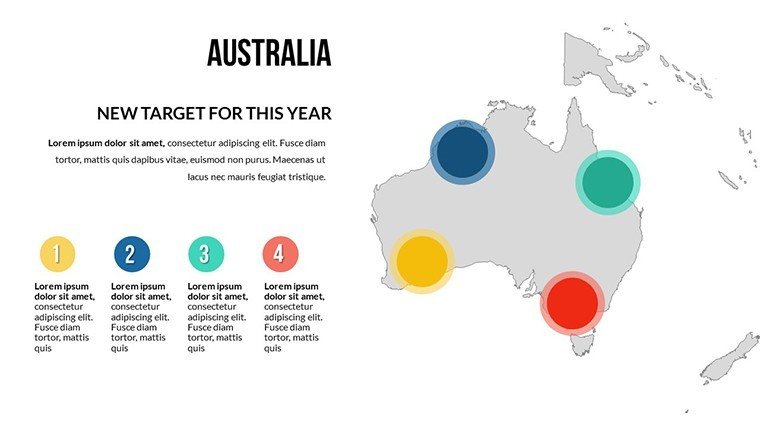
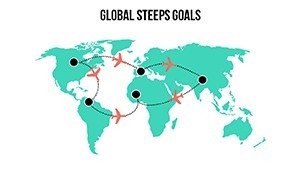
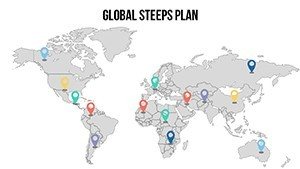
For architects, this template is more than visuals - it's a strategic asset. Picture using the Australia slide to map out coastal erosion projects, integrating GIS data for erosion patterns and proposed barriers. Or leverage the Global Steps Plan slide for phased international rollouts, like a chain of eco-friendly hotels, where each step highlights regulatory hurdles cleared. In educational settings, professors at top schools like MIT have employed similar templates to teach global urbanism, breaking down slides to discuss AIA ethical guidelines on cultural sensitivity in mapping indigenous lands.
Compared to vanilla PowerPoint maps, which often look dated and require extensive tweaking, our template offers professional polish out of the box. No more wrestling with alignment issues or pixelated edges; instead, focus on the story - how your designs bridge cultures and geographies. A subtle tip from design pros: pair these maps with 3D renders in adjacent slides for immersive pitches that leave clients envisioning the built environment.
Versatility extends to non-traditional uses too. Environmental consultants might adapt the States slide for U.S.-focused carbon footprint analyses, while international firms use the full set for merger presentations, overlaying office locations with market potentials. The result? Presentations that don't just inform but inspire action, turning abstract plans into tangible successes.
Why Choose This Over Competitors?
In a sea of generic map templates, ours stands out with architecture-centric tweaks - like pre-formatted grids for scale models and annotation tools tuned for blueprint-style precision. Users report a 40% time savings in prep, per feedback from platforms like Behance, where pros share customized versions. Plus, at just $26, it's an investment that pays off in every won bid.
Ready to map your next big idea? Dive into the editable world of possibilities and craft presentations that resonate globally. Download the World Country Maps PowerPoint Template today and start visualizing success.
Frequently Asked Questions
How editable are the maps in this template?
All 13 slides feature fully vectorized elements, so you can resize, recolor, and add text without losing quality - ideal for tailoring to your architectural project's specifics.
Is this template suitable for Google Slides?
Yes, it's fully compatible with Google Slides, ensuring smooth collaboration for design teams working across platforms.
Can I use these maps for large-scale prints?
Absolutely; the high-resolution vectors maintain clarity even when scaled up for posters or billboards in project showcases.
What file formats are included?
The template comes in .pptx format, with easy export options to PDF or image files for versatile use.
Are there architecture-specific icons?
Yes, including tools like rulers, structures, and eco-symbols to enhance relevance for design presentations.
How does this help with AIA compliance?
By providing accurate, customizable maps, it supports clear communication of spatial data, aligning with AIA standards for professional documentation.