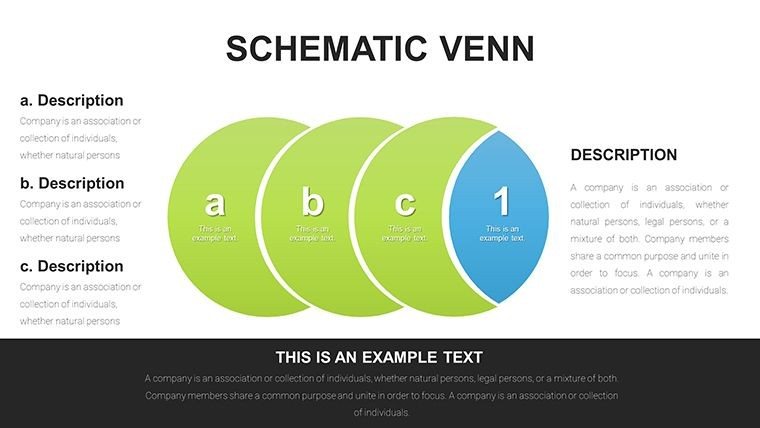
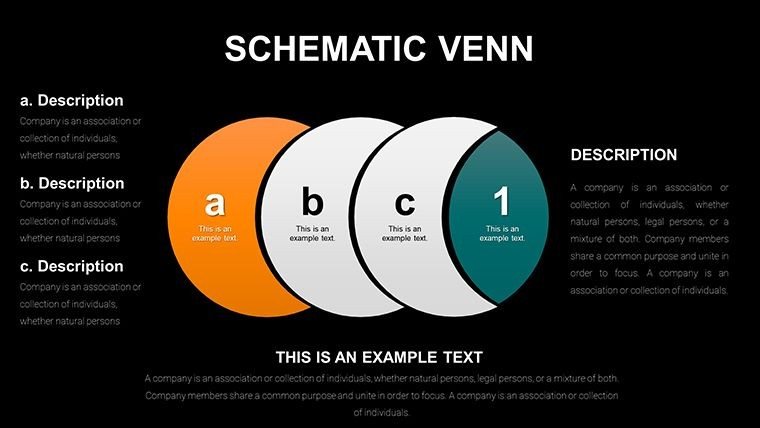
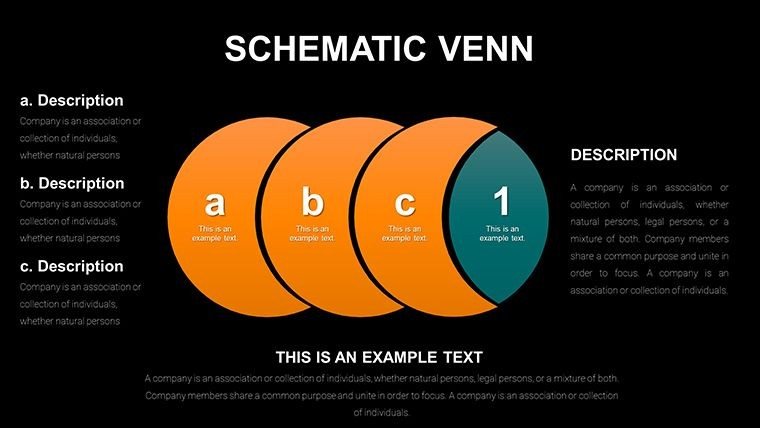
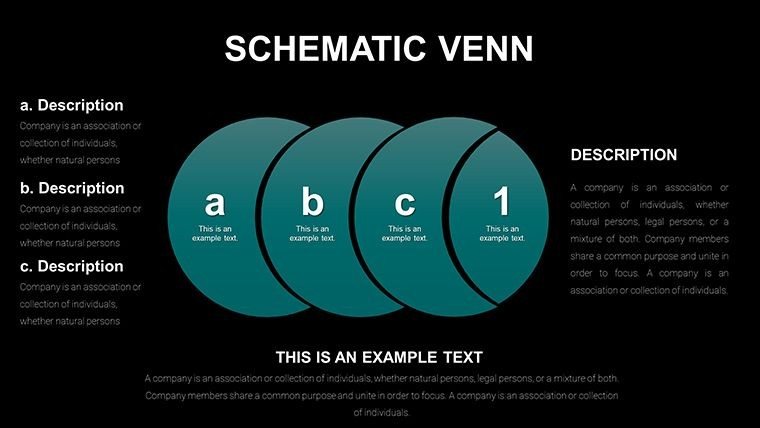
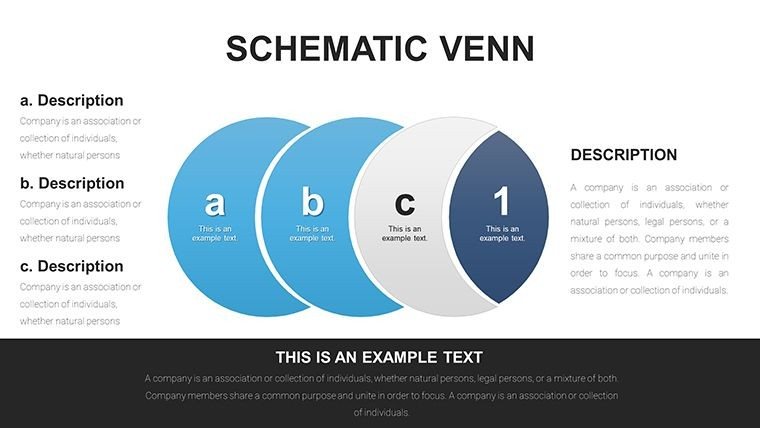
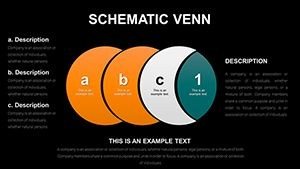
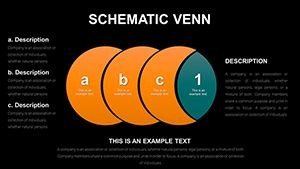
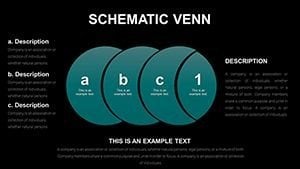
Schematic Venn Diagram PowerPoint Template
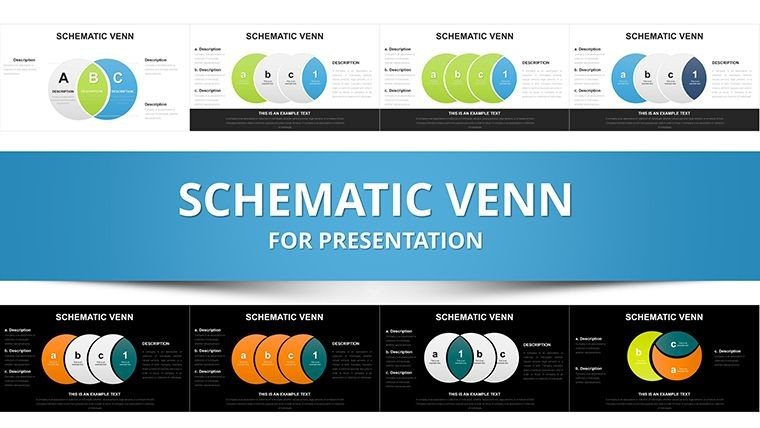


In an era where ideas overlap and concepts interconnect, our Schematic Venn Diagram PowerPoint Template offers a visual lifeline. With 25 editable slides, it's designed for thinkers in business, academia, and creative fields, aligning with cognitive mapping techniques from educational psychology. Imagine distilling multifaceted relationships - like market overlaps or team synergies - into elegant diagrams that resonate. This template, informed by design experts, enhances comprehension and retention, turning abstract thoughts into tangible visuals. It's your ally in presentations that need to convey unity amid diversity, fostering deeper insights and collaborative breakthroughs without the hassle of starting from scratch.
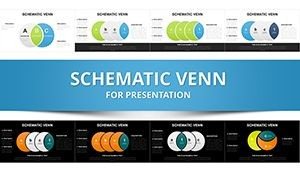
Discover Dynamic Diagram Variations
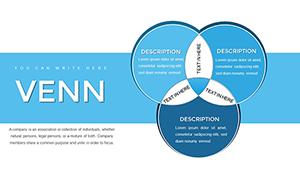
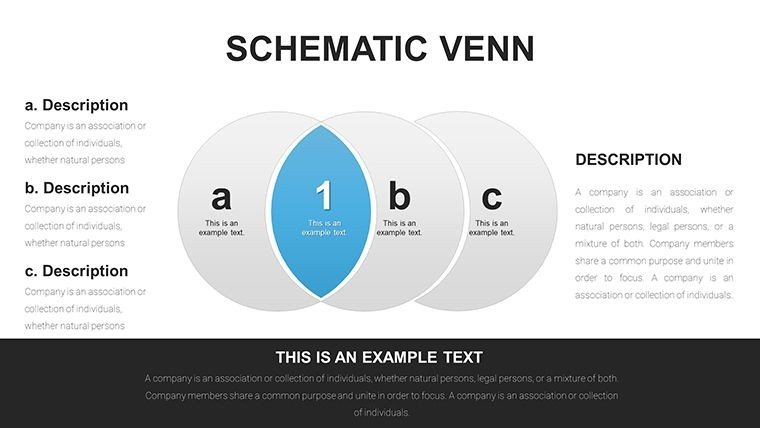
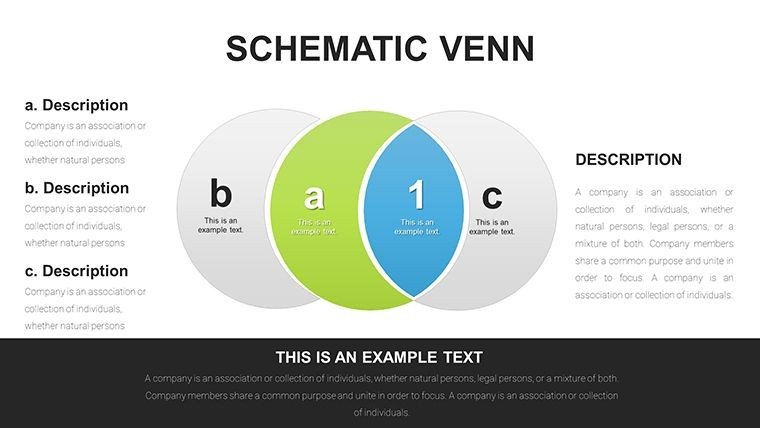
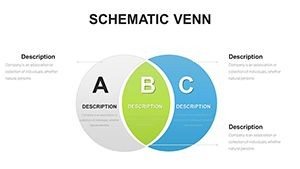
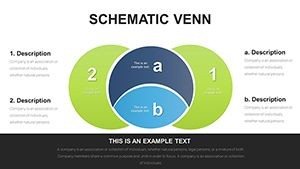
From classic two-circle Venns to intricate multi-set schemas, this template provides a spectrum of options. Its schematic style, with precise lines and scalable elements, surpasses basic drawings, weaving in LSI such as overlapping diagram templates and relationship infographics fluidly.
Core Features Enhancing Visual Communication
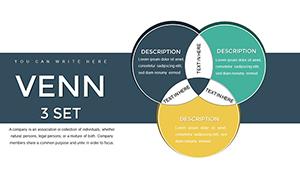
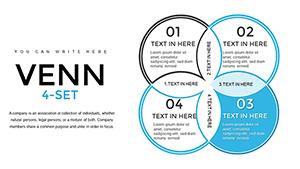
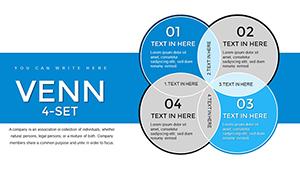
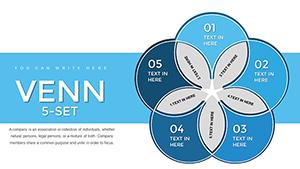
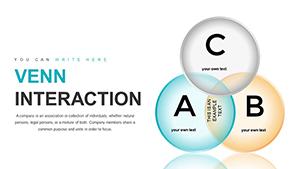
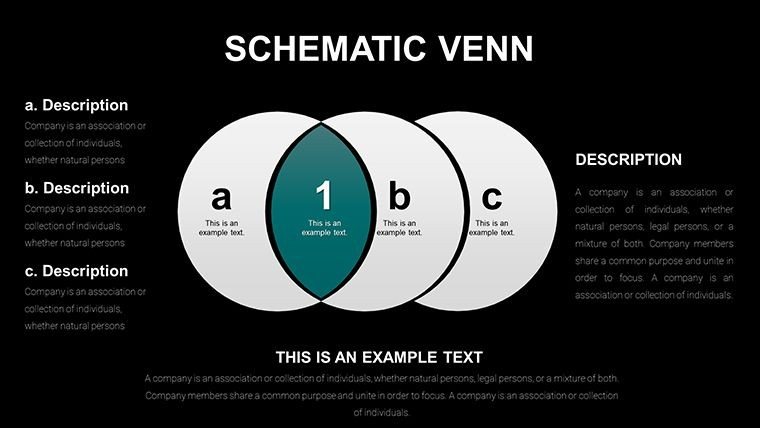
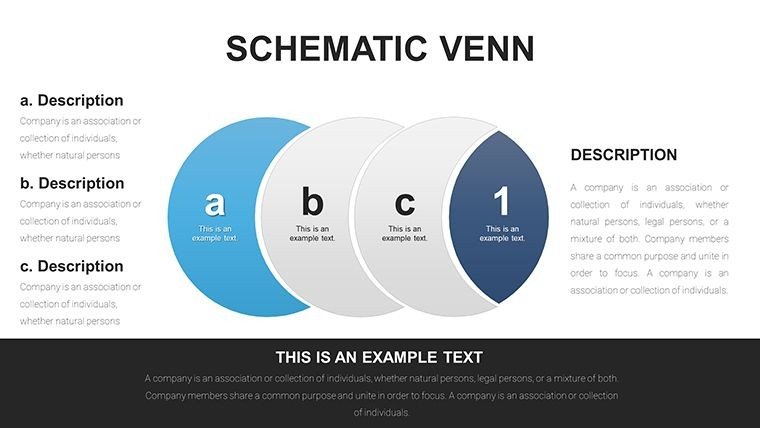
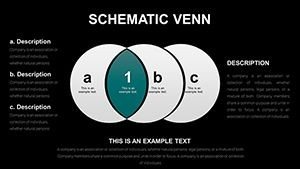
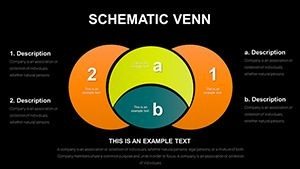
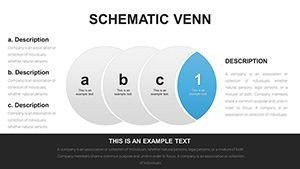
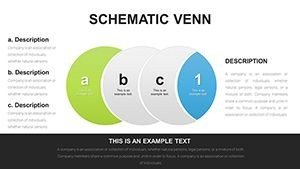
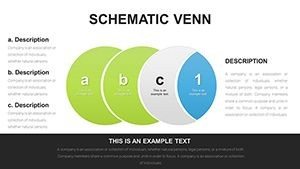
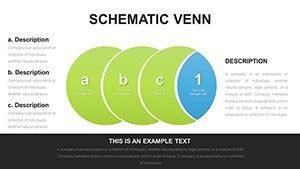
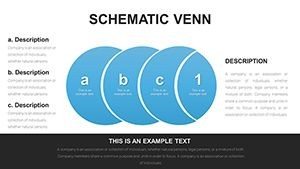
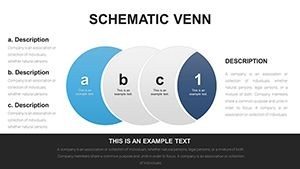
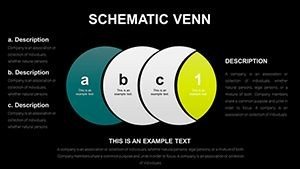
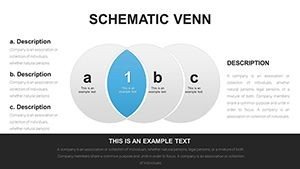
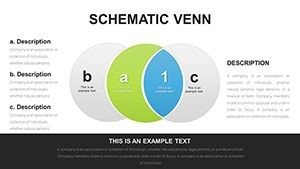
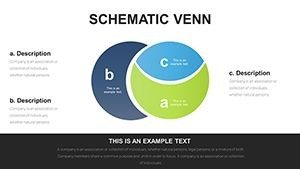
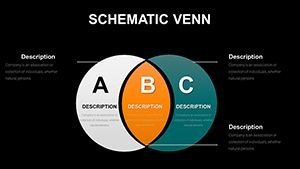
- Versatile Layouts: Adaptable designs for 2-5 circle configurations, themed for various contexts.
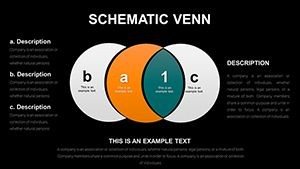
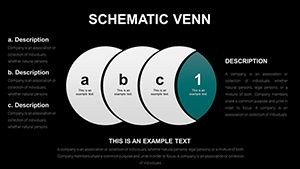
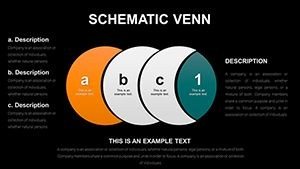
- Data-Driven Functionality: Integrate numbers or text directly, with auto-adjusting overlaps.
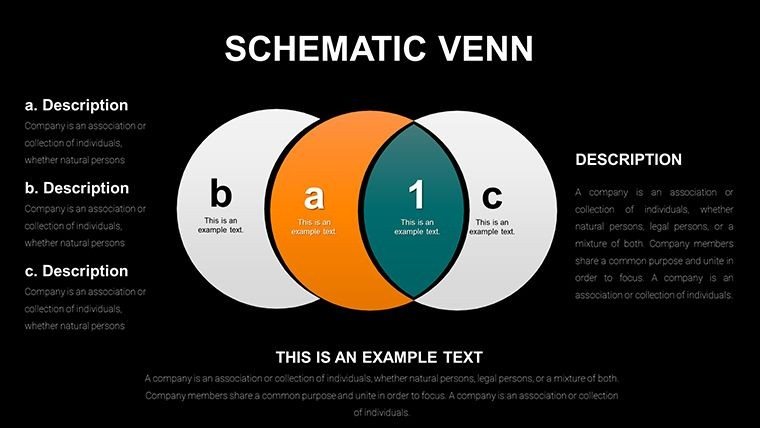
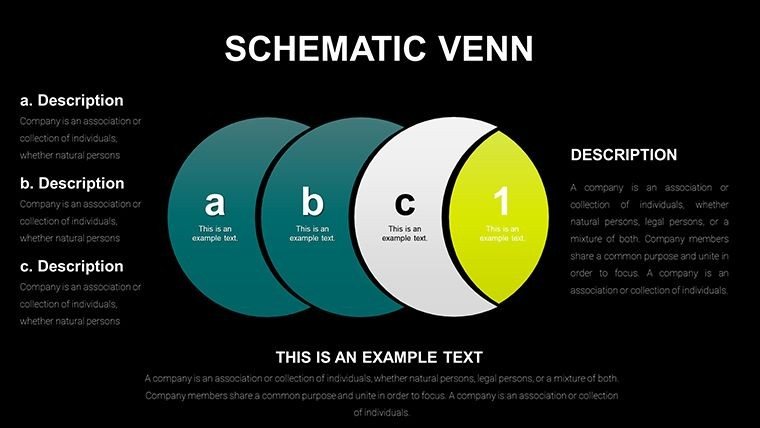
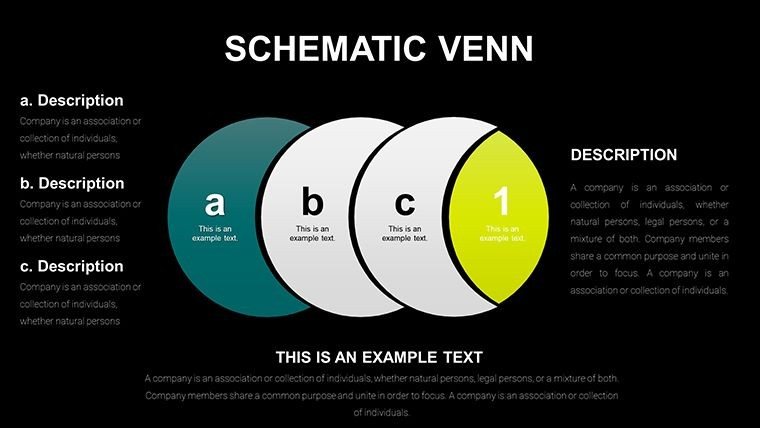
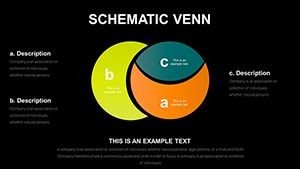
- Effortless Customization: Alter sizes, colors, and fonts via simple clicks, no advanced skills required.
- Diverse Scenarios: From idea comparisons to intersection analyses, covering broad applications.
- Infographic Integration: Combine with icons for enriched storytelling.
- Universal Compatibility: Smooth operation in PPTX and Google Slides.
These draw from authoritative sources like information design principles in Edward Tufte's works.
Applications in Everyday and Professional Settings
Suited for brainstorming sessions or lectures, it excels in depicting shared attributes. A design agency, for example, used our cycle-integrated Venns to map client needs, streamlining project scopes and cutting revision time by 40%. Students diagram essay structures, professionals outline partnerships.
Practical Steps to Build Your Diagrams
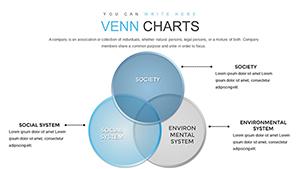
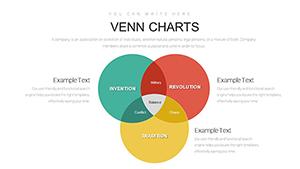
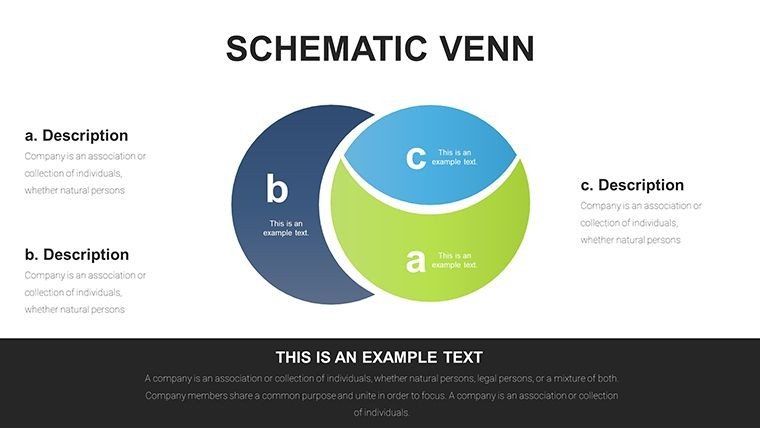
- Pick a Base: Select from 25 slides, e.g., a three-circle for multi-factor overlaps.
- Enter Content: Fill sections with key points, using data imports if needed.
- Refine Appearance: Customize hues to denote categories, add labels for clarity.
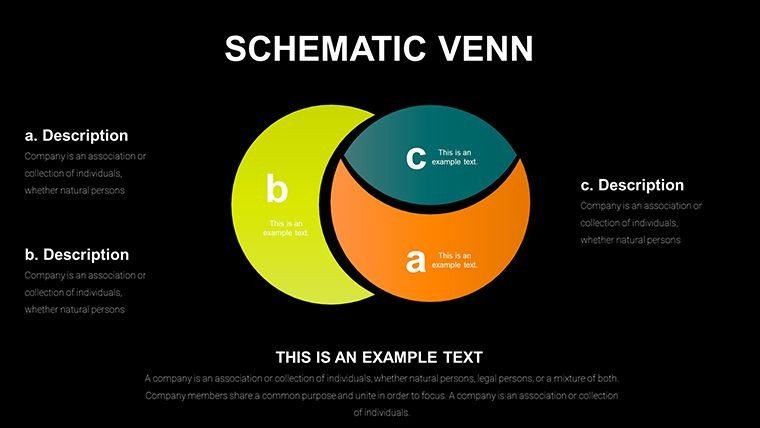
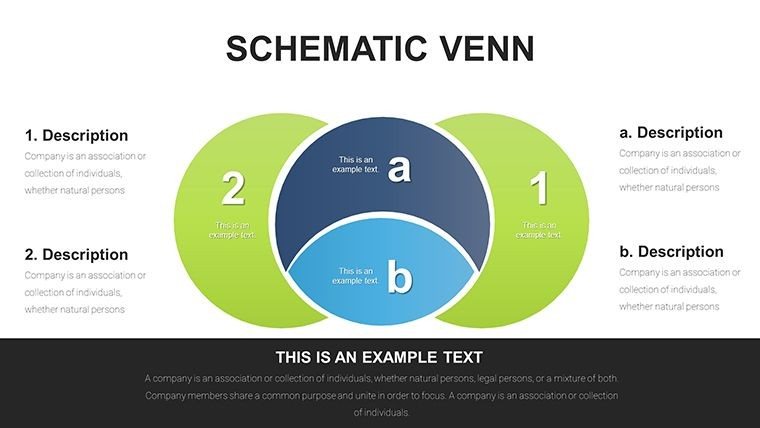
- Enhance with Elements: Incorporate cycles for process flows within intersections.
- Test and Present: Review for balance, then engage your audience.
This mirrors creative ideation processes, encouraging refinement.
Advantages Over Standard Diagram Tools
PowerPoint's defaults are rigid; ours offer fluidity and pre-optimized aesthetics, saving design effort. Reports show improved audience understanding with such tailored visuals versus ad-hoc creations.
Tips from Visual Experts
Focus on symmetry for aesthetic appeal, use contrasting colors for distinct areas. Label intersections prominently, and pair with narratives for context - a strategy from successful infographic campaigns.
Slide Details: A Closer Examination
The 25 slides include: 1-8 for basic Venns; 9-17 for schematic enhancements; 18-25 for cycle fusions. Each with editable zones and graphics, ready for personalization.
In business, they clarify mergers; in education, they teach set theory. Case: A teacher illustrated ecosystem interactions, boosting student test scores.
Easy Workflow Incorporation
Link to data sources, share via cloud, adapt for reports. PPTX ensures consistency across tools.
Specific Benefits by User Type
- Professionals: Articulate complex strategies visually.
- Educators: Simplify abstract concepts for learners.
- Students: Organize thoughts effectively.
It tackles visualization challenges, providing clear value.
Harness the Schematic Venn Diagram PowerPoint Template to connect ideas brilliantly. Grab it today and diagram with distinction.
Frequently Asked Questions
- How many sets can the Venns handle?
- Up to five, with scalable designs for clarity.
- Can I import data from Excel?
- Yes, for dynamic content updates.
- Is it beginner-friendly?
- Definitely, with intuitive controls.
- Are icons included?
- Yes, thematic ones for enhancement.
- Compatible with Mac?
- Fully, via PowerPoint or Google Slides.
- Any free samples?
- Preview slides available on site.