Venn Diagram PowerPoint Template - Fully Editable | Instant Download


Type: PowerPoint Charts template
Category: Venn
Sources Available: .pptx
Product ID: PC00885
Template incl.: 13 editable slides
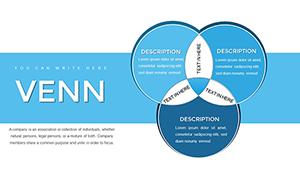
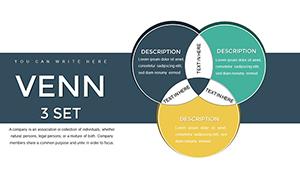
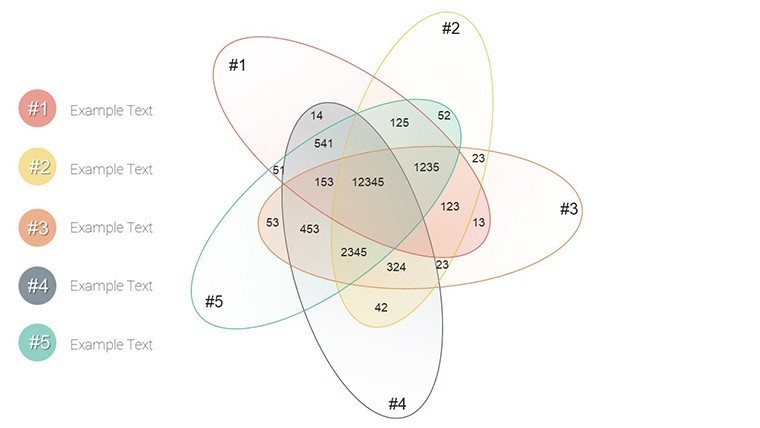
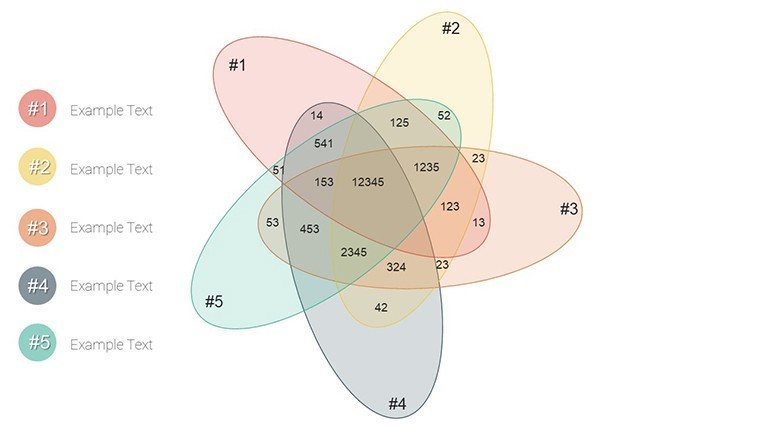
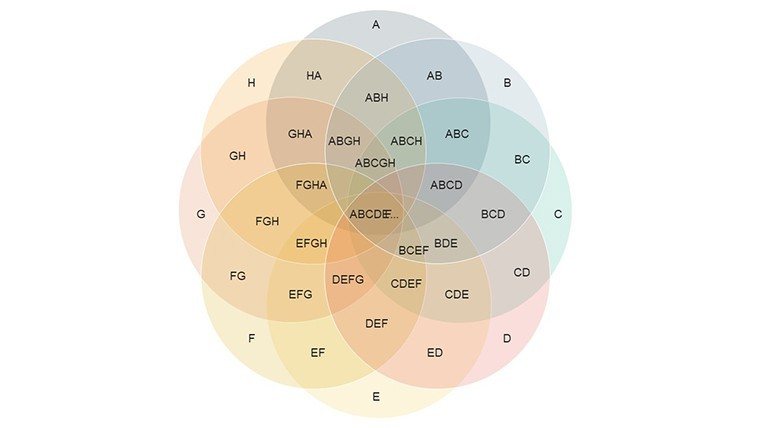
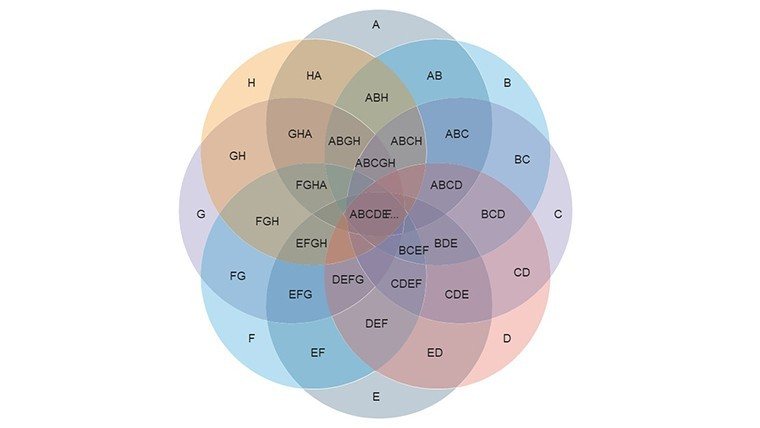
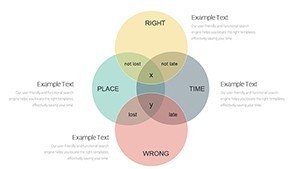
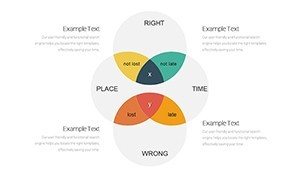
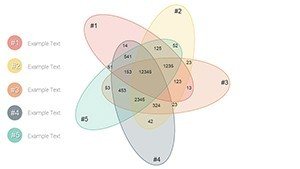
Create clear relationship visuals with our Venn Diagram PowerPoint Template. 13 fully editable slides to simplify complex overlaps in business, strategy, education, and analysis. Professional design, instant download.
Explaining how different ideas, groups, or data sets intersect and overlap is a common challenge in presentations. Generic diagrams often look unprofessional or are hard to customize quickly. Our Venn Diagram PowerPoint Template delivers polished, ready-made slides that make these relationships easy to understand and impressive to view.
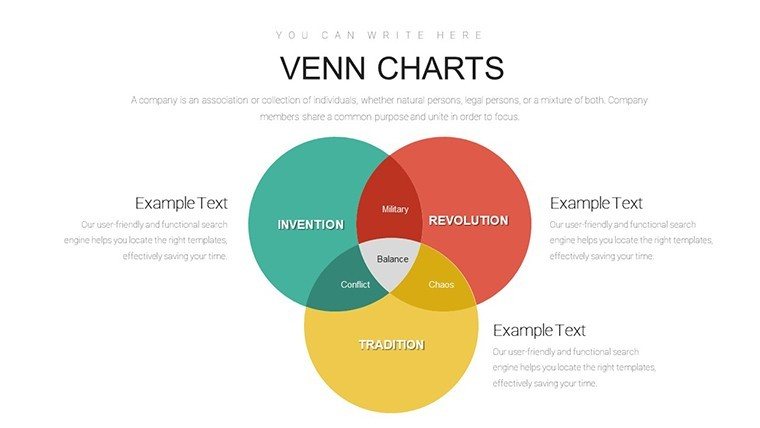
When and Why to Use Venn Diagrams
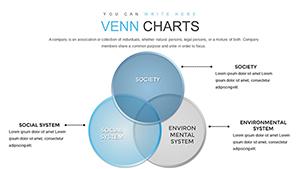
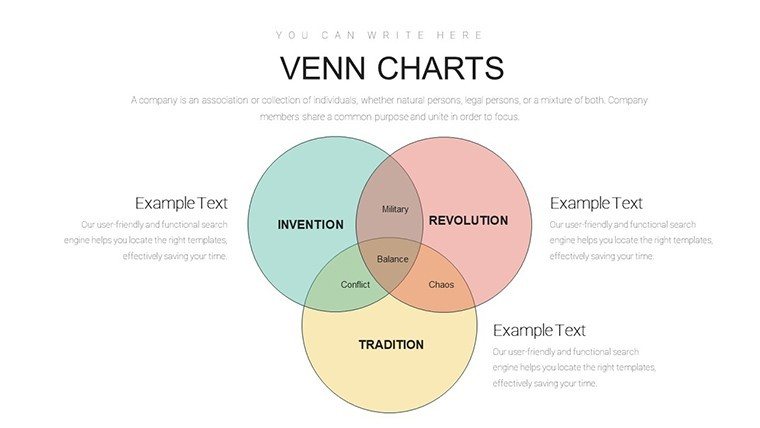
Venn diagrams excel at showing commonalities and differences between multiple categories. In business, they help illustrate market segment overlaps or competitive advantages. In education, they clarify concept connections or historical event relationships. They turn abstract comparisons into intuitive visuals that audiences grasp immediately.
This collection removes the frustration of building diagrams from scratch, ensuring consistent, brand-aligned results every time.
Key Features
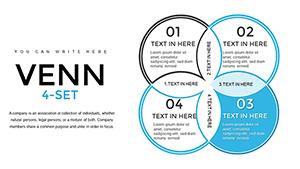
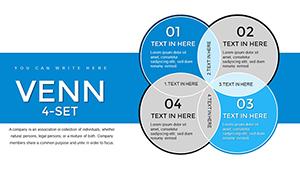
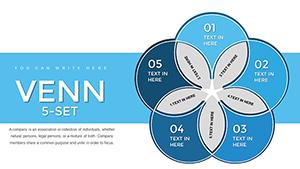
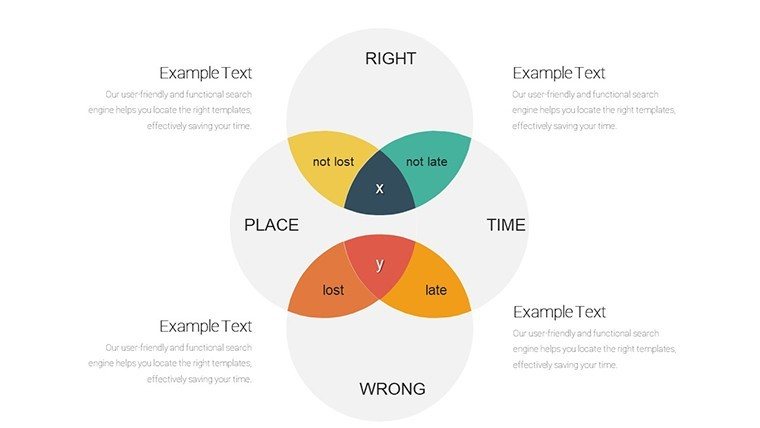
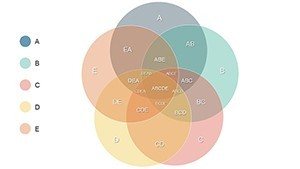
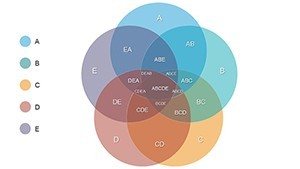
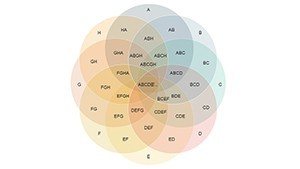
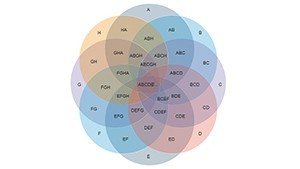
- 13 fully editable slides with various Venn configurations
- Vector graphics for perfect scaling and editing
- Drag-and-drop customization and theme matching
- Compatible with PowerPoint 365 and Google Slides
- Includes customizable icons and elements
How to Use the Venn Diagram Template
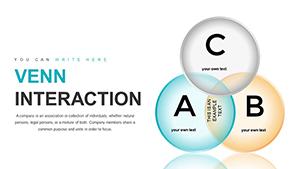
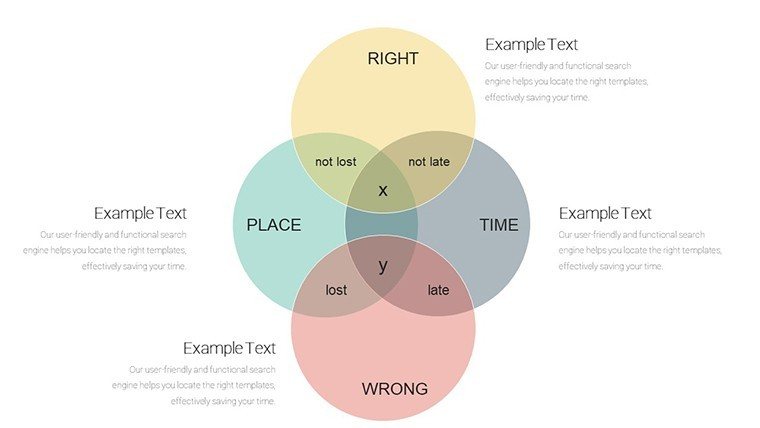
Instantly download and open in your preferred software. Choose the slide with the right number of circles for your comparison. Edit text in each section to label your sets and intersections, adjust colors to fit your presentation theme, and resize or animate elements as needed for dynamic delivery.
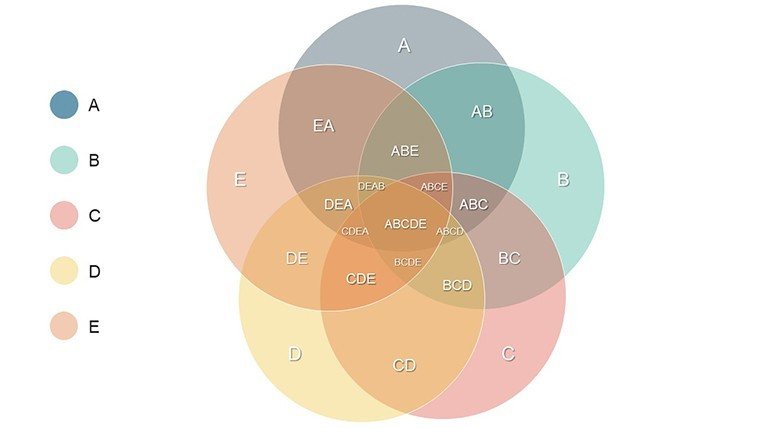
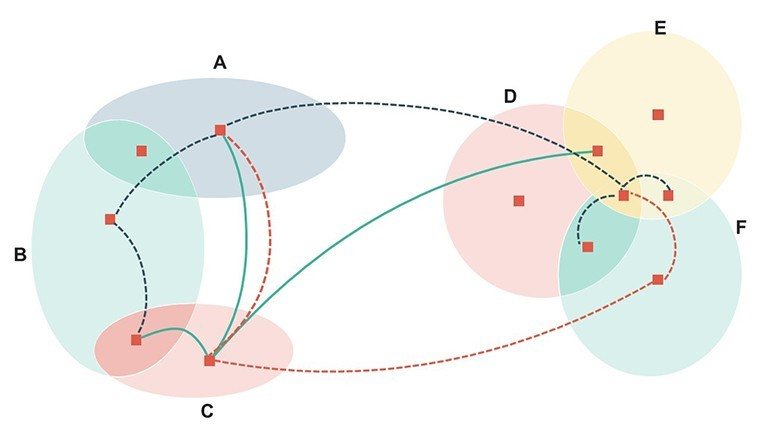
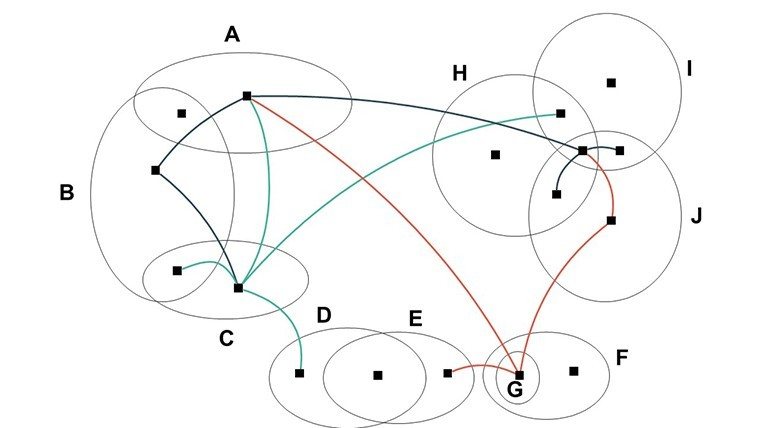
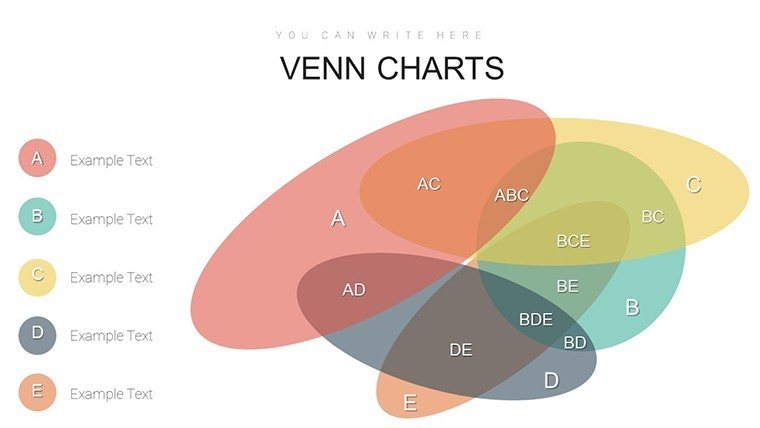
The templates support both simple two-set comparisons and more complex multi-set analyses.
Real-World Applications
Business strategists use them for SWOT analysis or product feature comparisons. Educators present overlapping academic disciplines or literary themes. Analysts visualize survey responses or customer personas intersections. Consultants highlight synergies in merger or partnership proposals.
Frequently Asked Questions
Are the Venn diagrams fully editable?
Yes, all slides feature vector elements that you can fully customize including colors, text, sizes, and positions using PowerPoint or Google Slides tools.
How many slides are included?
The template includes 13 meticulously crafted slides with different Venn diagram layouts for various complexity levels.
Can I use these in Google Slides?
Yes, the templates are compatible with both Microsoft PowerPoint and Google Slides for flexible editing and presenting.
What kind of use cases are these Venn diagrams best for?
Ideal for business strategy, market analysis, education, research comparisons, and any scenario requiring visualization of overlaps and intersections.