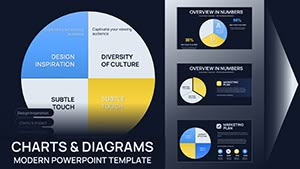
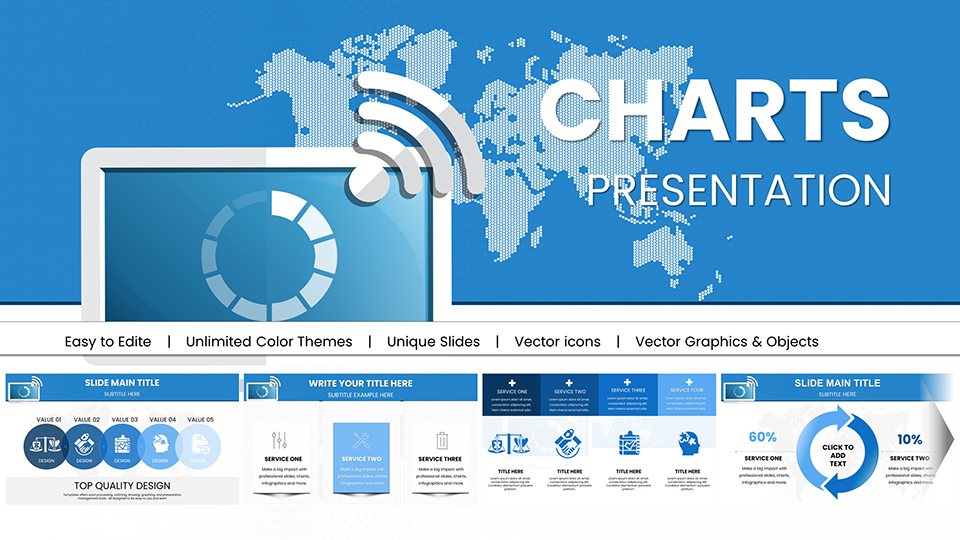
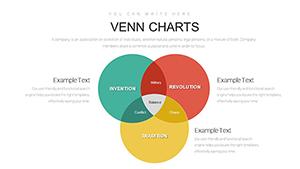
Capture the essence of continuity and balance with our circle chart PowerPoint templates, engineered for those who demand visual accuracy in presentations. These designs masterfully depict cycles, segments, and rotations, turning numbers into narratives.
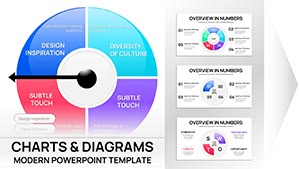
Suited for analysts breaking down market shares, trainers illustrating learning loops, or planners mapping project phases, they deliver crisp, rotatable elements that adapt to any dataset. High-contrast palettes and precise segmentation ensure readability from afar.
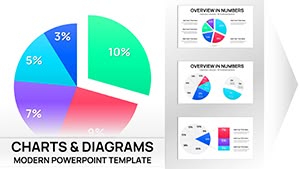
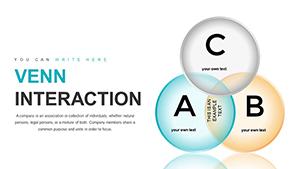
Visualize market trends as elegant pie slices or workflows as interconnected rings - our templates make it intuitive and impactful. With one-click edits, refine to perfection without losing momentum.
Delve into this category and equip your slides with charts that rotate conversations in your favor.
Circle charts excel at showing wholeness and parts, offering a holistic view that`s intuitive for diverse audiences. Our PowerPoint templates elevate this with 3D effects, gradient fills, and alignment snaps that surpass basic chart tools, providing a refined look with minimal effort.
Business analysts appreciate the proportional accuracy for budget allocations, while educators use them to segment historical eras seamlessly.
Core Strengths Highlighted
Proportional Precision: Auto-calculating segments for error-free data representation.
Dynamic Rotations: Spin controls for emphasizing key slices during talks.
Layered Customization: Overlay text and icons without distorting the core shape.
This edge transforms routine reports into persuasive visuals that stick.
Industry-Specific Use Cases
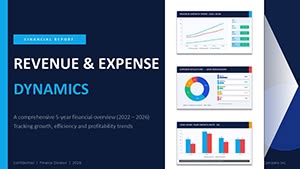
Finance: Pie variants dissect investment portfolios, clarifying risk distributions.
Marketing: Cycle diagrams trace campaign lifecycles from ideation to metrics.