Promo code "00LAYOUTS"
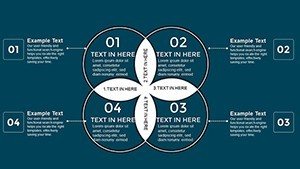
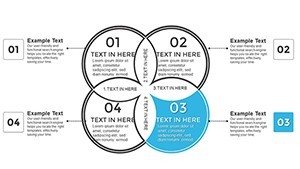
Improved 4 Set Venn Diagram PowerPoint Template for Professional Presentations
Type: PowerPoint Charts template
Category: Venn
Sources Available: .pptx
Product ID: PC00790
Template incl.: 21 editable slides
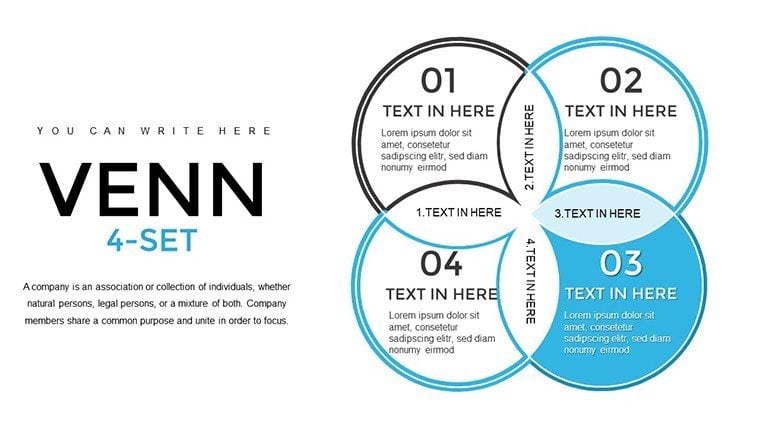
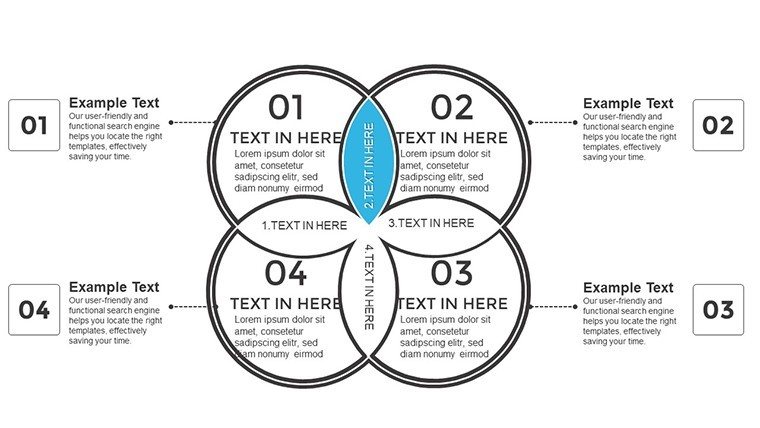
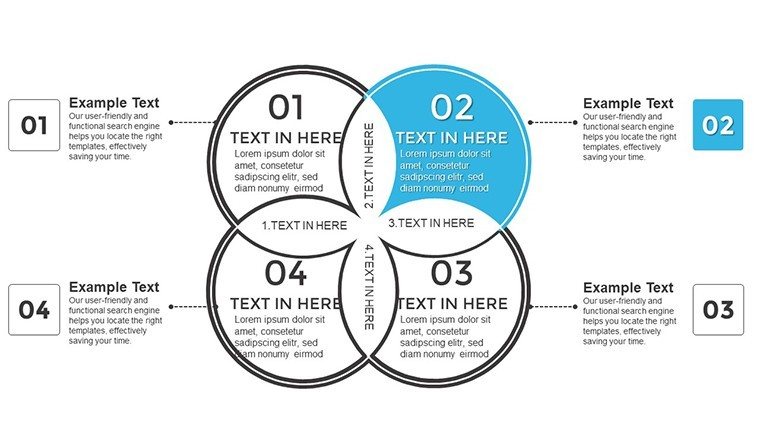
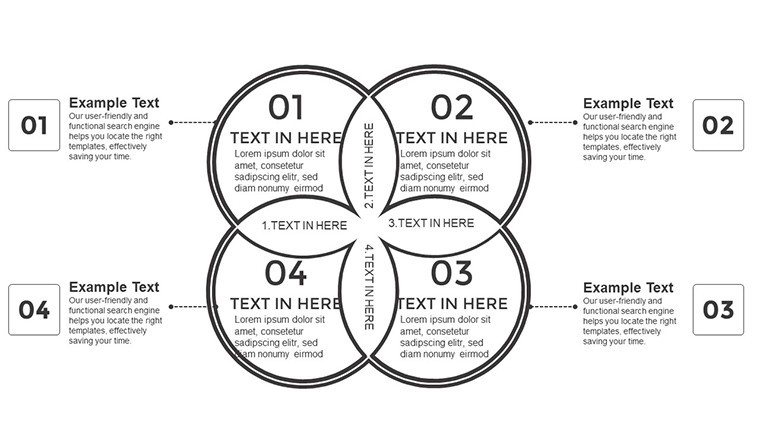
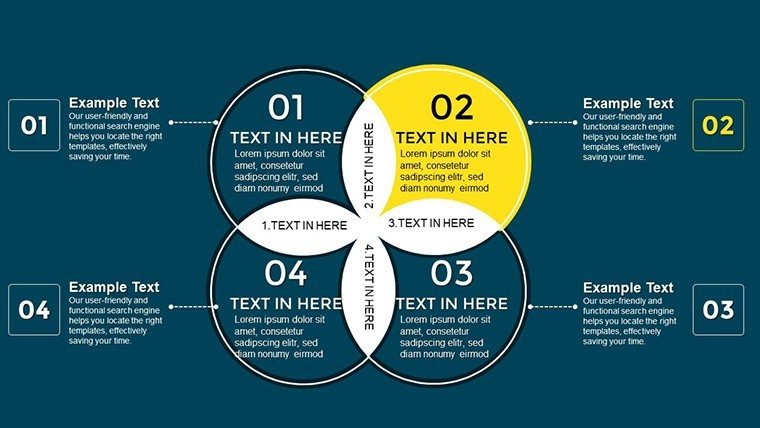
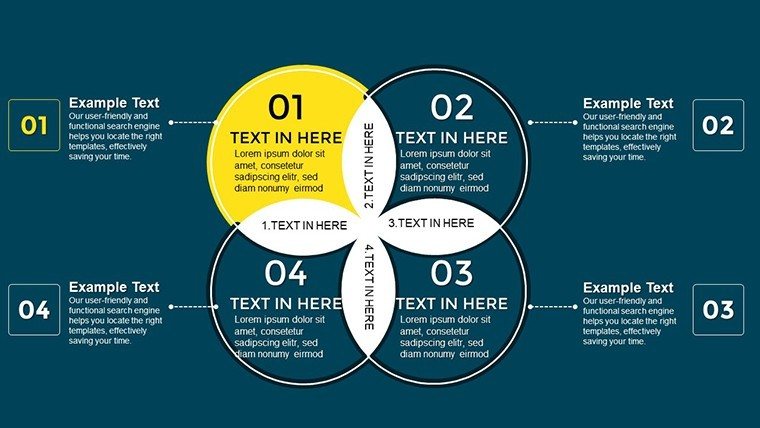
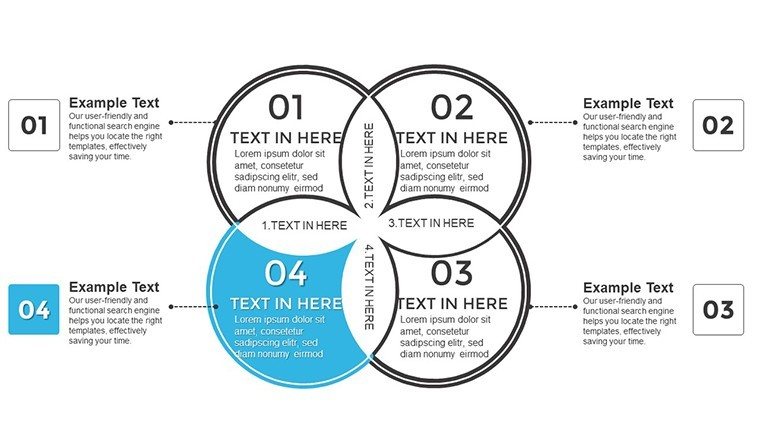
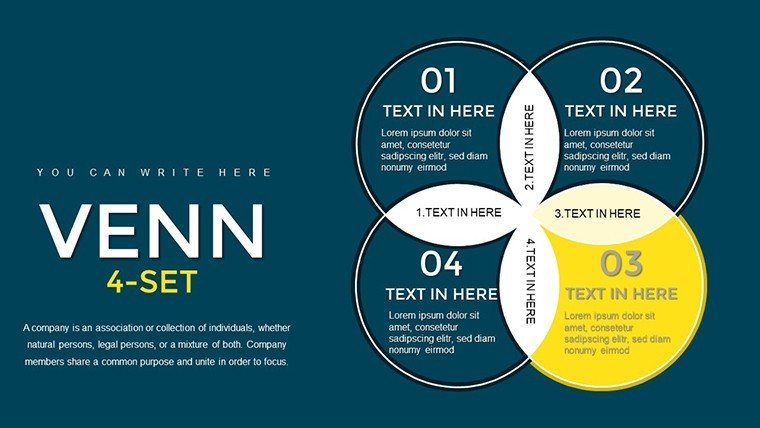
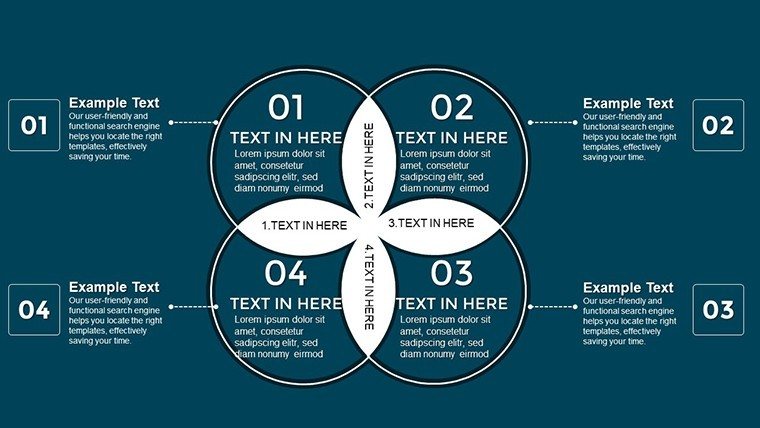
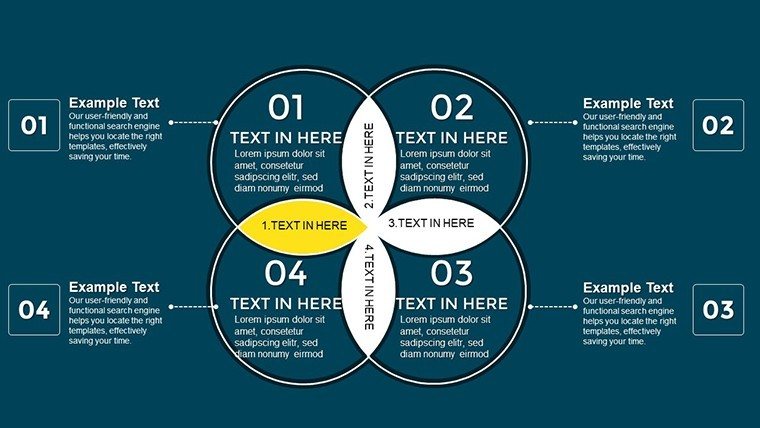
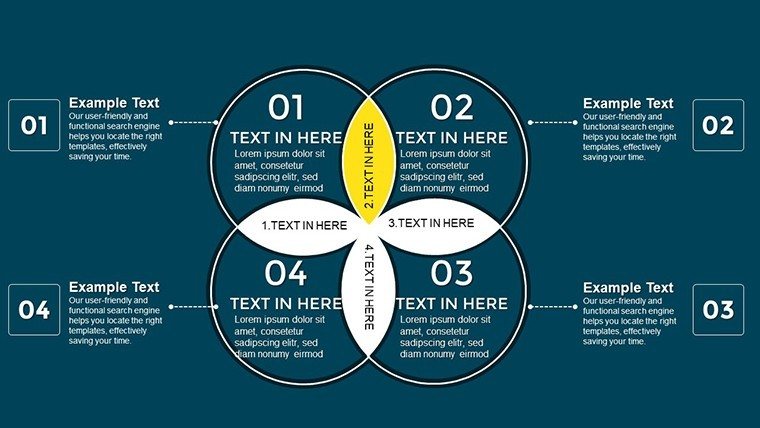
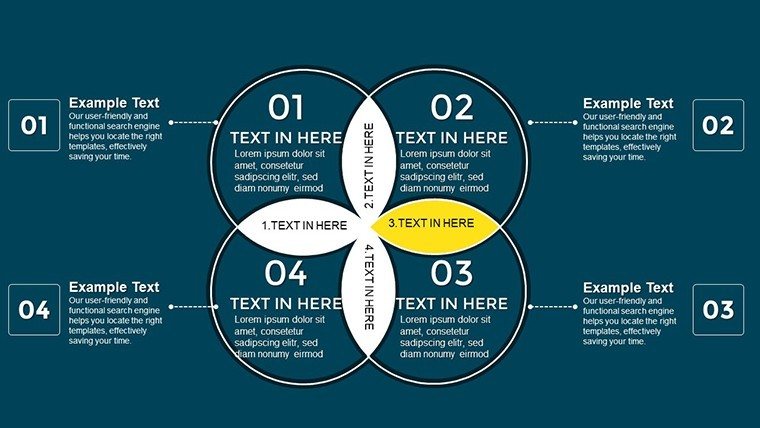
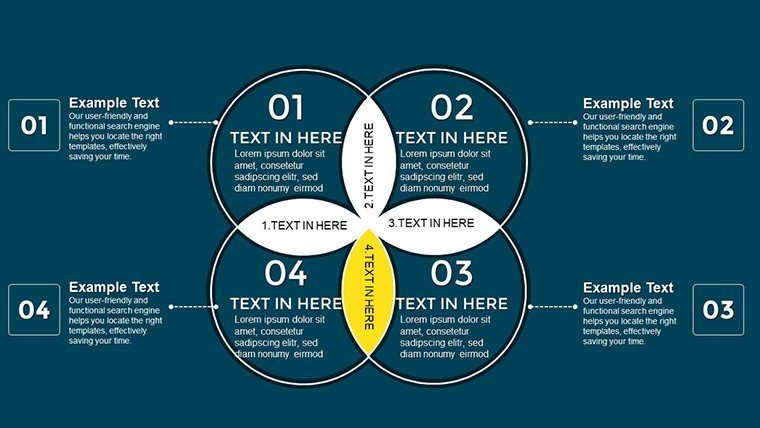
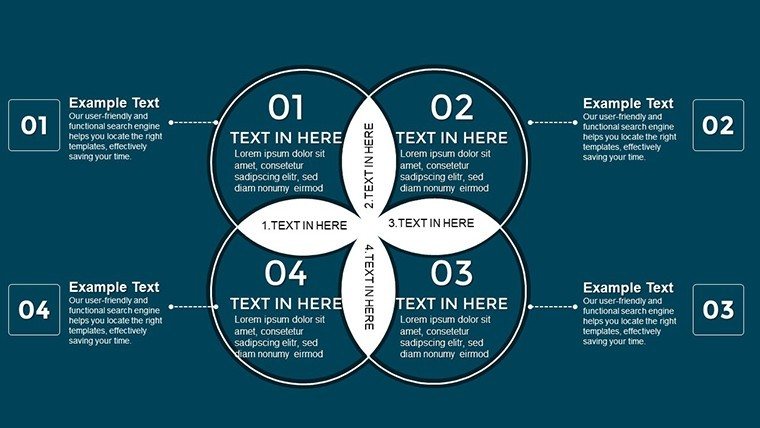
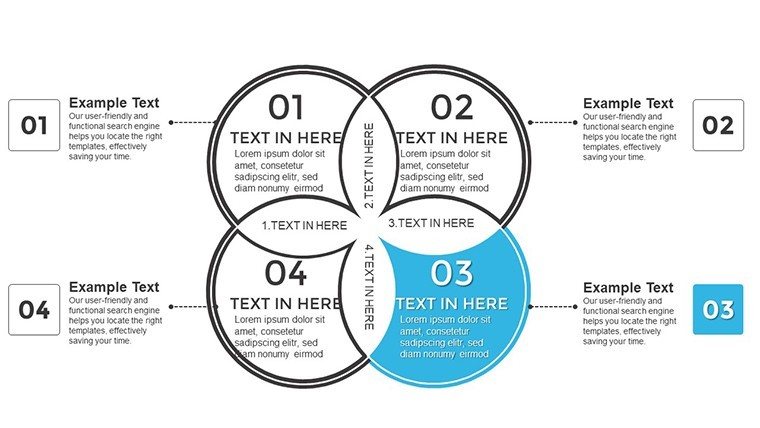
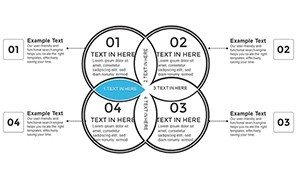
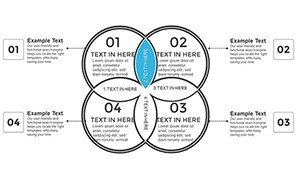
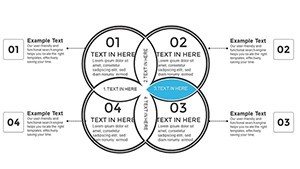
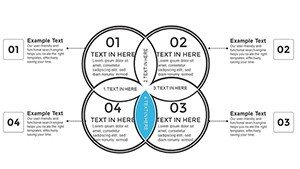
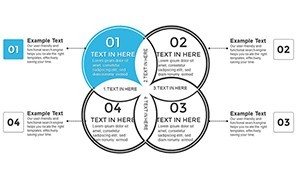
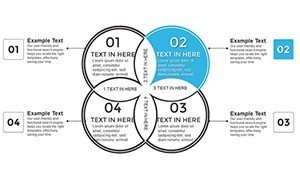
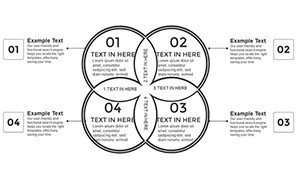
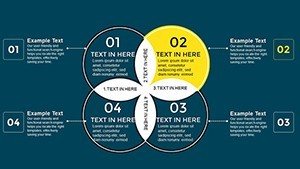
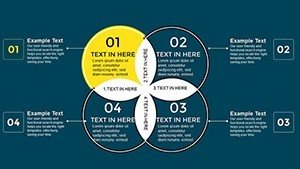
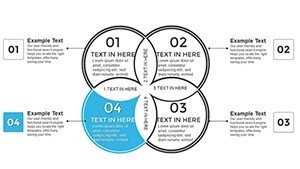
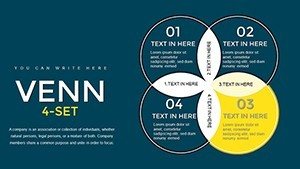
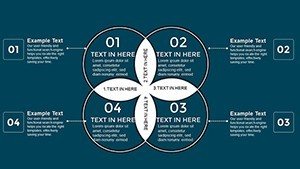
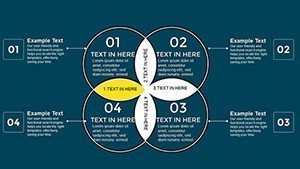
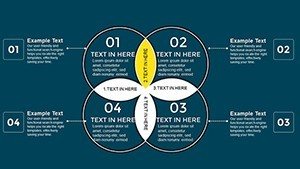
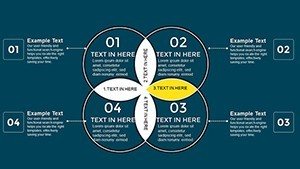
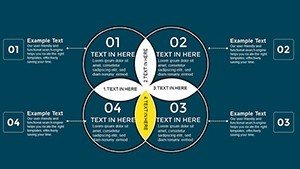
The Improved 4 Set Venn Diagram PowerPoint Template for Professional Presentations solves the common problem presenters face when trying to display multiple intersecting data sets clearly in a high - stakes meeting such as a board review or a cross - functional strategy session. When you land here you are likely asking: how can I show four overlapping groups and their relationships in one cohesive diagram? What’s the best way to customize a Venn diagram for my executive audience that expects both clarity and insight? How will this visual perform in contexts like investor updates or internal analysis reviews where precision matters? And how do I edit and present this Venn diagram effectively in PowerPoint or Google Slides?
This template answers all of these questions with 21 fully editable slides designed specifically to visualize four - set intersections without clutter, ensuring your audience - from C - suite executives to project teams - grasps the patterns, overlaps, and unique insights in your data at a glance. It is perfect for board meetings where overlapping product portfolios, market segments, risk categories, and strategic priorities must be dissected within minutes and for investor decks where nuanced relationships between metrics or competitive factors must be highlighted cleanly and confidently.
Features Built for High - Impact Presentations
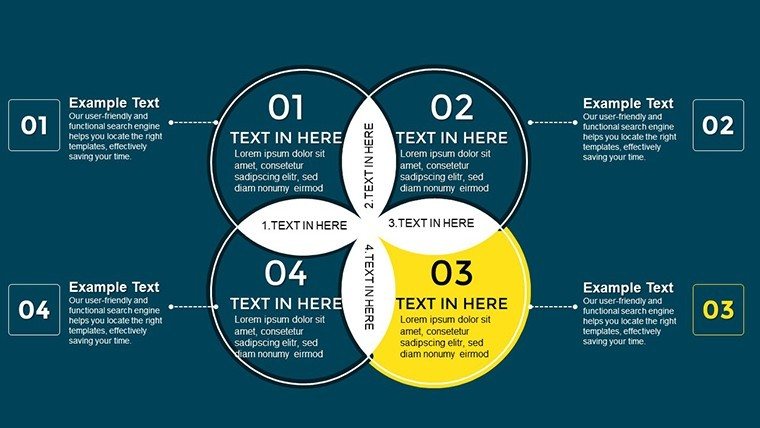
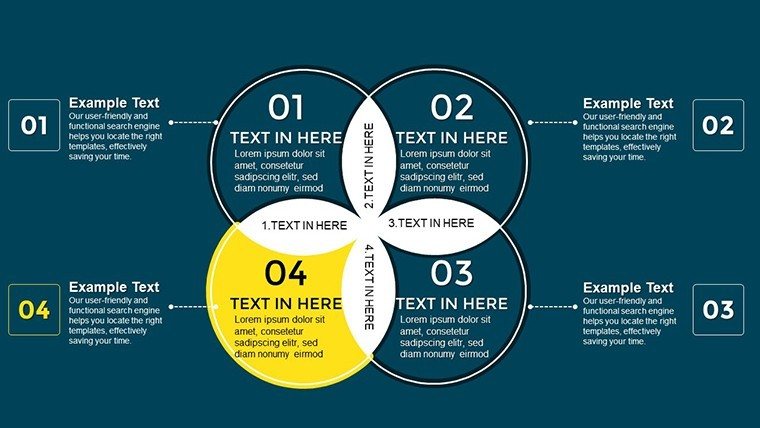
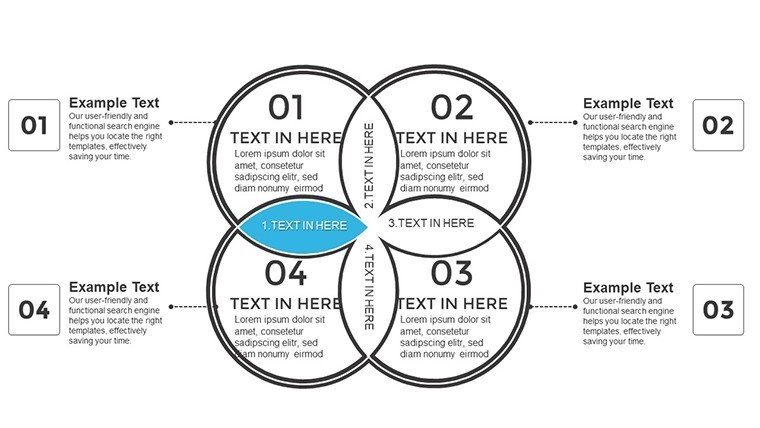
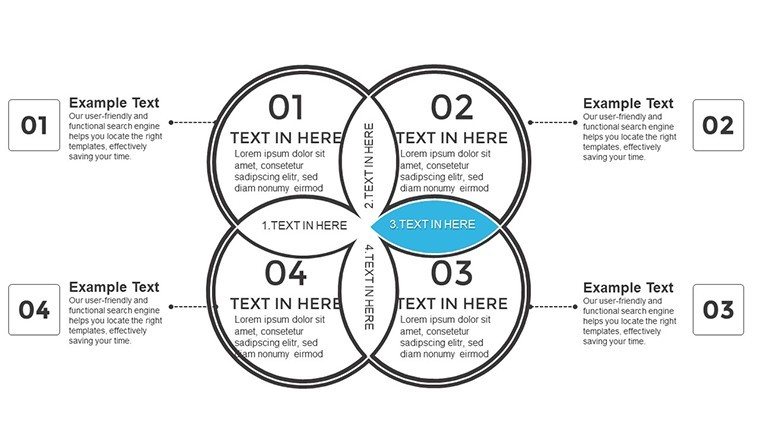
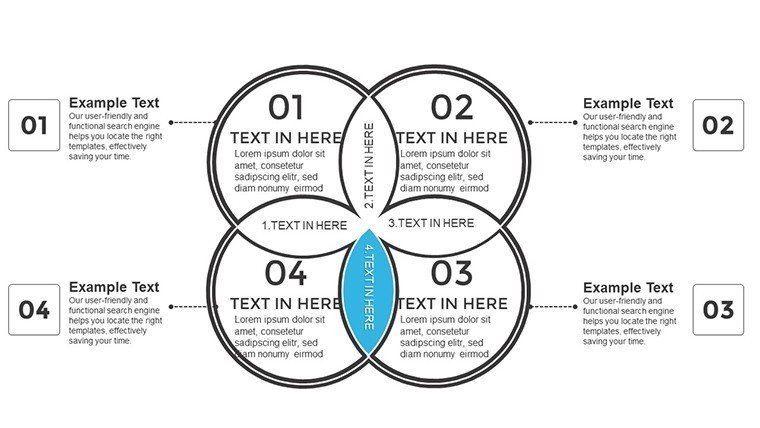
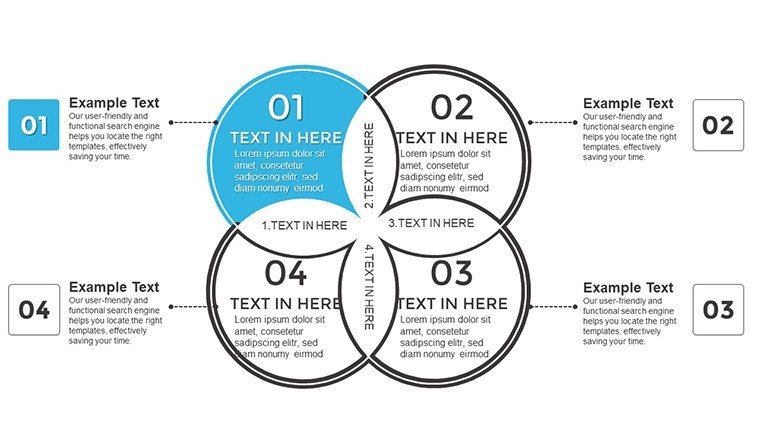
Every PowerPoint element in this 4 set Venn diagram PPT template is crafted from a presentation consultantu2019s toolkit, reflecting how professionals structure overlapping datasets for maximum comprehension. Slides include basic four - circle diagrams for initial concept framing, labeled intersection versions for detailed insights, and animated builds that reveal layers progressively during a live briefing. Each layout supports a precise narrative flow from context to conclusion which matters in investor updates where every second of deck time is scrutinized.
- 21 Editable Slides with multiple configurations to depict all intersection possibilities.
- Resizable Circles that maintain proportions as you add your content, saving time when prepping for training sessions, quarterly reviews, or classroom instruction.
- Clear Text Placeholders for concise labels, callouts, and annotations, essential when you need analysts and executives to interpret your relationships quickly.
- Minimalist Color Schema optimized for readability in large conference rooms and remote video meetings alike.
- Compatible with PowerPoint and Google Slides for seamless editing and collaboration across teams.
Professional Use Cases That Drive Results
In corporate strategy reviews, I use this template to show how product features, customer needs, technology capabilities, and regulatory constraints intersect illuminating where opportunities and risks overlap. In one board meeting, this 4 set Venn diagram template clarified strategic priorities by mapping overlapping market demands, leading to consensus on investment direction within minutes. Investors appreciate the clean delineation of intersecting revenue streams and cost drivers when complex financial structures are presented visually rather than in spreadsheets.
For internal training sessions, educators and team leads use these slides to break down complex frameworks, such as linking roles, responsibilities, goals, and outcomes in project management training. Startups use the template in pitch decks to show relationships between target segments, problem solutions, competitive advantages, and scalability factors, helping secure funding by presenting a compelling visual narrative of market fit.
Workflow Integration Into Your Presentations
To integrate this template into your workflow, follow a professional editing path I use every week:
- Open the downloaded PPTX in PowerPoint and choose the slide that matches your communication objective (overview, detailed intersection, or summary dashboard).
- Replace placeholder text with your labels and data points. Use consistent terminology that aligns with your executive audienceu2019s lexicon.
- Resize circles and adjust color accents to align with your brand or the visual hierarchy you need to emphasize.
- For live presentations, apply subtle animations to reveal each intersection sequentially this helps guide the audienceu2019s attention in training sessions and high - stakes investor pitches alike.
- Practice your narrative with the diagram explain what each area represents and why it matters for strategic decisions.
Real - World Examples From Boardrooms to Classrooms
A product team used this 4 - set Venn diagram to illustrate how four feature sets intersect with customer personas. When presenting to the product steering committee, the team highlighted the central overlap as the core value proposition, driving alignment on the MVP for a new release. In another case, an academic used the template in a graduate seminar to compare four public policy frameworks, and students reported clearer understanding of interdependencies than in classes with traditional bullet lists.
Internal Comparison: Template Variations & Outcomes
| Scenario | Audience | Outcome |
|---|---|---|
| Basic Four - Circle Overview | Executive Briefing | Quick insight into key overlaps |
| Labeled Detailed Intersections | Analyst Review | Precise exploration of segment relationships |
| Animated Sequential Build | Investor Pitch | Controlled narrative pacing |
| Dashboard Combination Slide | Team Workshop | Holistic context with multiple comparisons |
Industry Applications
This template adapts across industries. In healthcare, visualize overlapping clinical outcomes, cost centers, patient demographics, and treatment protocols. In marketing, map segments, behaviors, purchase drivers, and campaign channels. In technology, highlight intersecting capabilities like performance, security, usability, and cost. Its flexibility makes it a staple for consultants, strategists, educators, and analysts who need to present complex intersections with clarity and authority.
Frequently Asked Questions
When should I use this 4 set Venn diagram template and when is it NOT the right choice?
Use this template when you need to illustrate relationships between four distinct sets where their overlaps carry meaning in decision - making for example, comparing product features against customer segments and constraints. It is NOT ideal for linear processes or data that lacks meaningful intersections because a Venn layout can distract from sequential narratives.
How do professionals edit the Venn circles and annotations in PowerPoint?
Professionals open the .pptx file in PowerPoint, select circles, and adjust size or labels directly on the slide. Text and colors are changed via the toolbar. For presentations that will be shared or co - edited, save iterations in cloud storage and use Google Slides compatibility to ensure shared editing without version conflicts.
How will executives interpret this type of visual in a strategy meeting?
Executives interpret Venn diagrams as concise maps of intersecting priorities. When presented with clear labels and a guided narrative, they quickly see where strategic drivers overlap, helping them make decisions. Avoid overloading with too much text; let the diagram guide interpretation supported by your spoken explanation.

