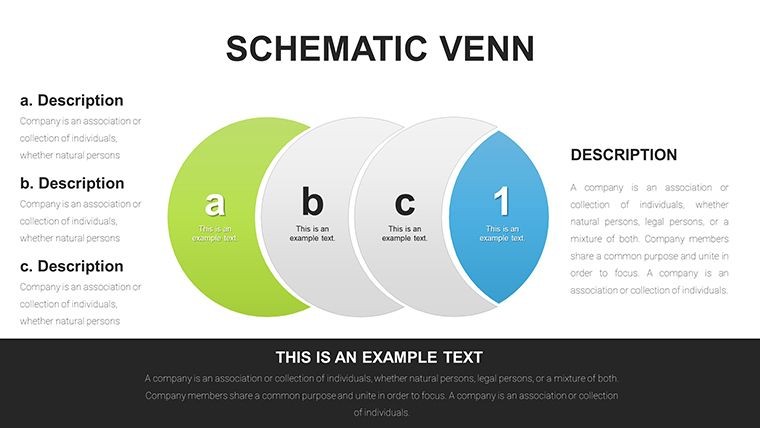
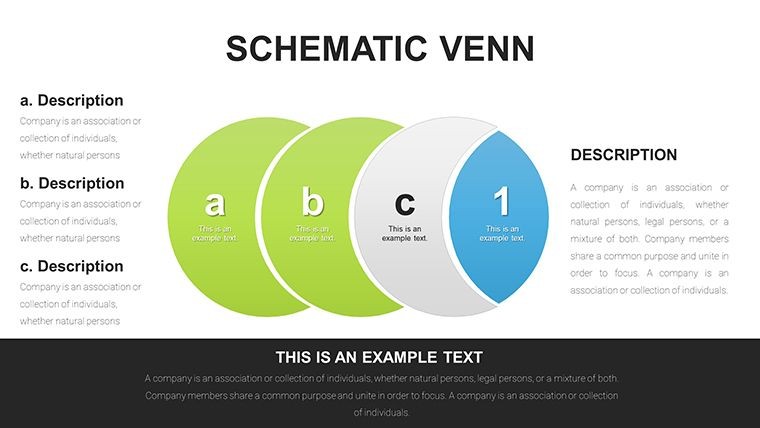
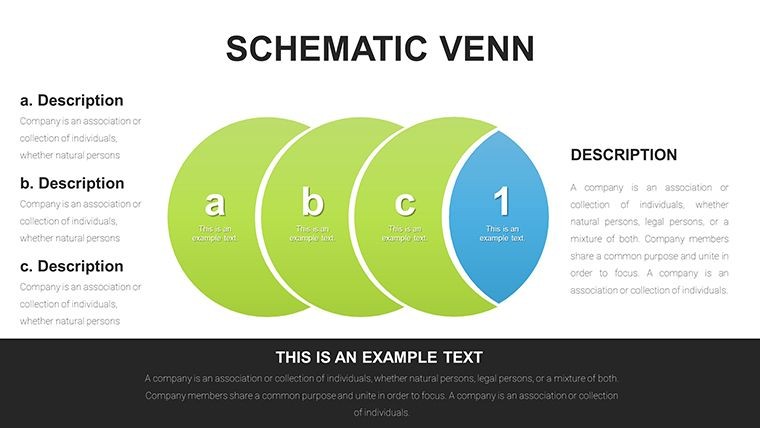
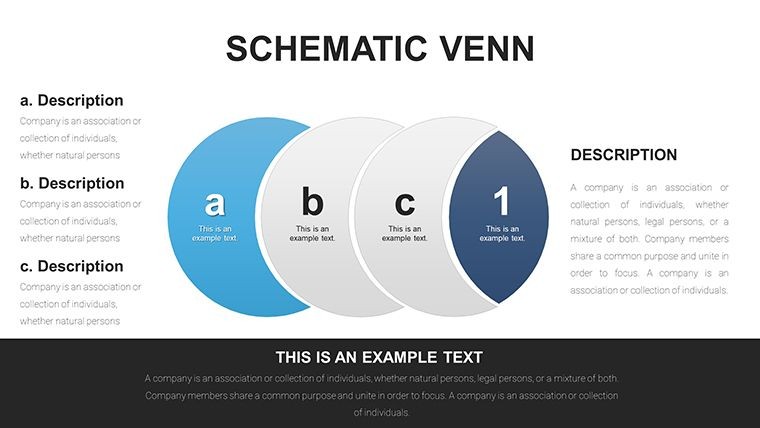
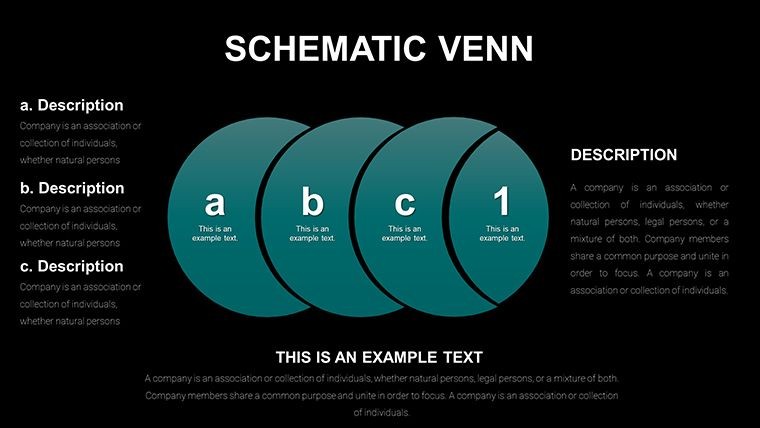
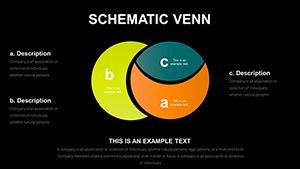
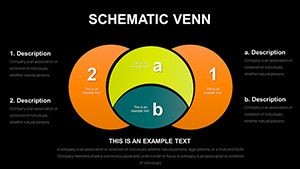
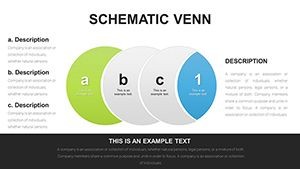
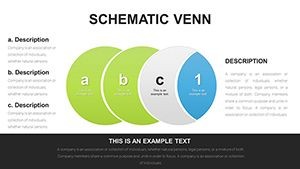
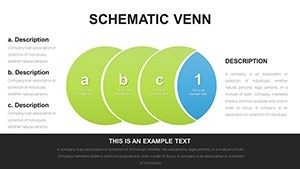
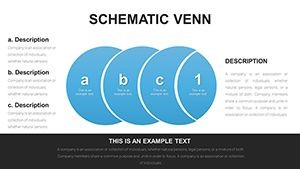
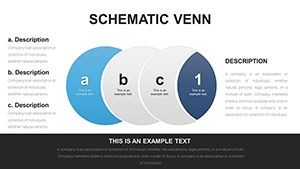
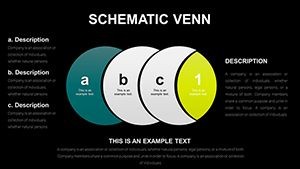
Decode Overlaps with Schematic Venn Keynote Charts


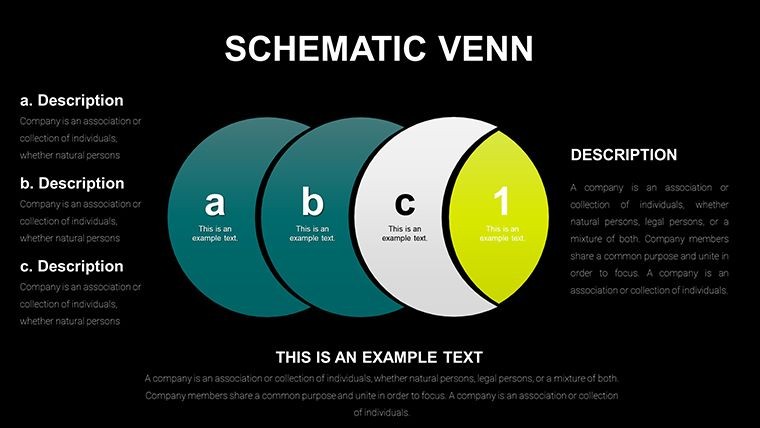


In realms where intersections define outcomes - from probability puzzles to logical arguments - the right visual can illuminate what words alone obscure. The Schematic Venn Keynote Charts Template, with its 25 editable slides, is engineered for exactly that: rendering set theories, statistical correlations, and computational logics into elegant, overlapping circles that reveal profound connections.
Rooted in John Venn's foundational diagrams, this template extends beyond academia into practical fields like data science and decision-making. Envision diagramming shared attributes in team competencies for HR strategies or overlapping risks in compliance audits. It's a staple for educators, researchers, and analysts who need to dissect multifaceted data without overwhelming viewers.
Harnessing Keynote's vector prowess, these schematics support infinite resizing and color-coding, with animations that expand overlaps to spotlight synergies. Affordable and instantly downloadable, it's the bridge between theoretical elegance and applied insight.
Essential Features for Intersectional Brilliance
Each slide is a Venn masterpiece, blending simplicity with sophistication for diverse analytical needs.
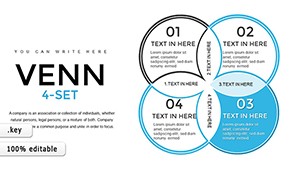
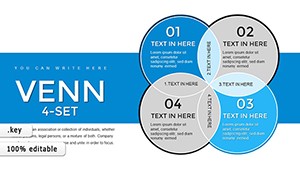
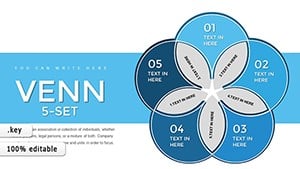
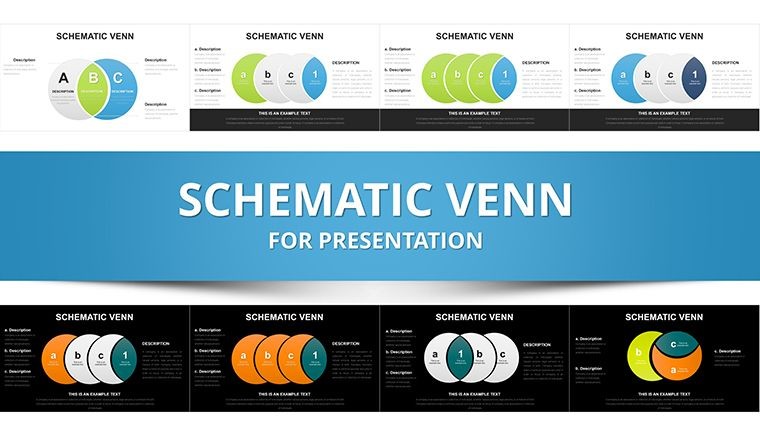
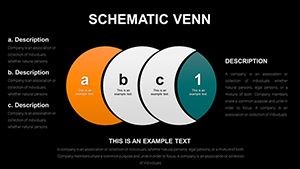
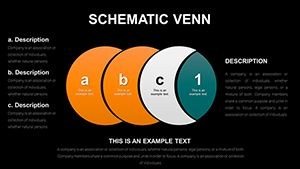
- 25 Editable Slides: Varied configurations from dual sets to multi-circle complexities.
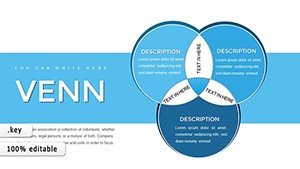
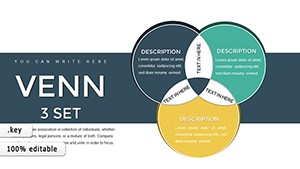
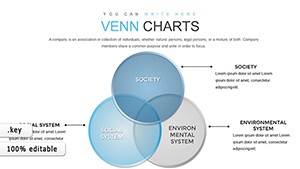
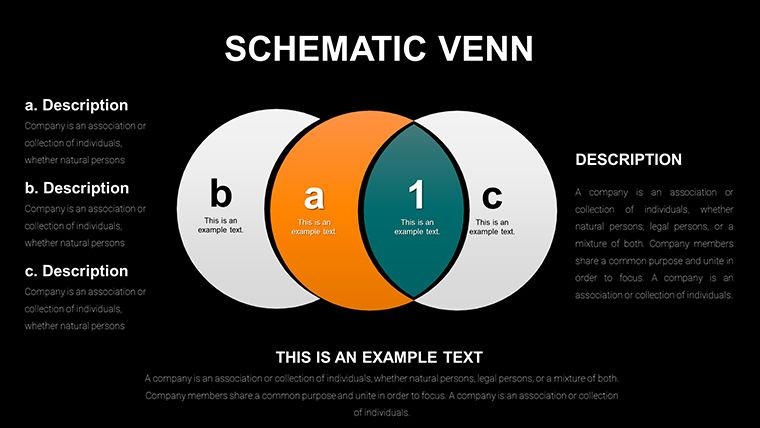
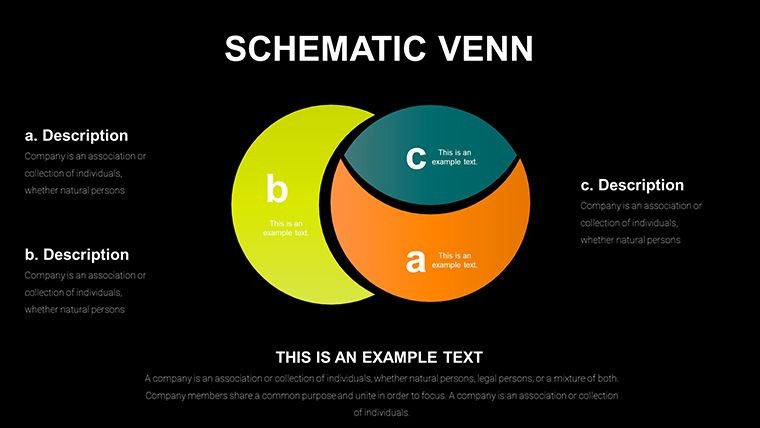
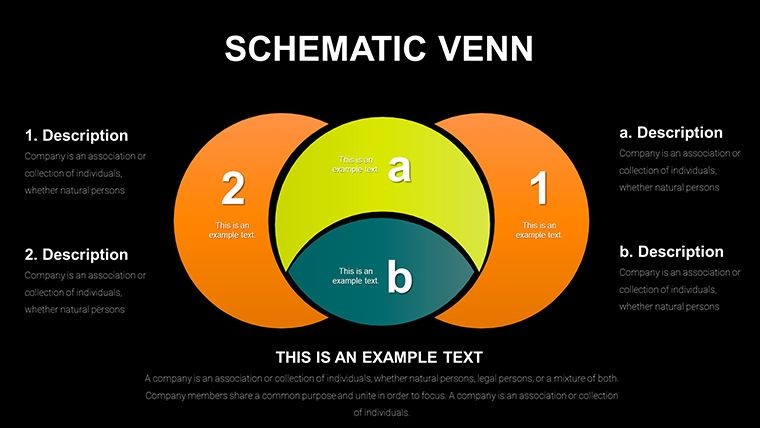
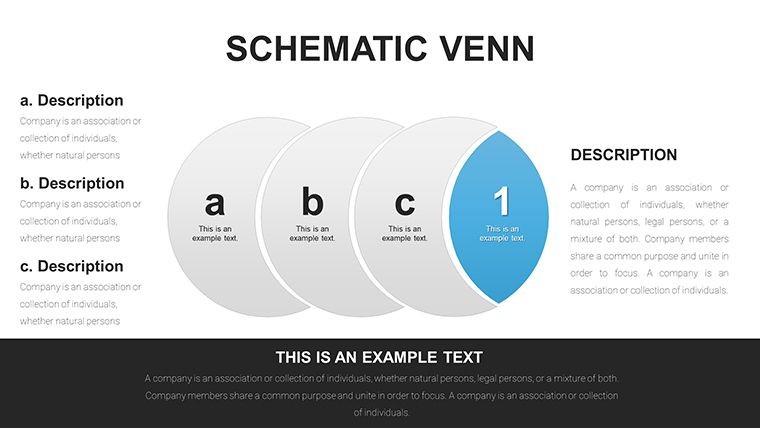
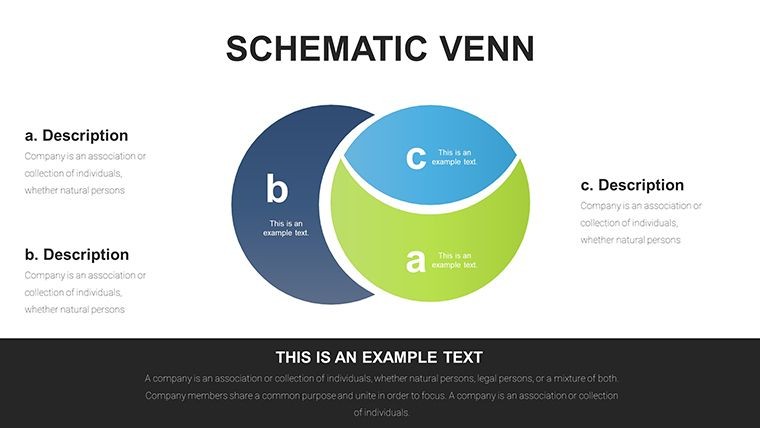
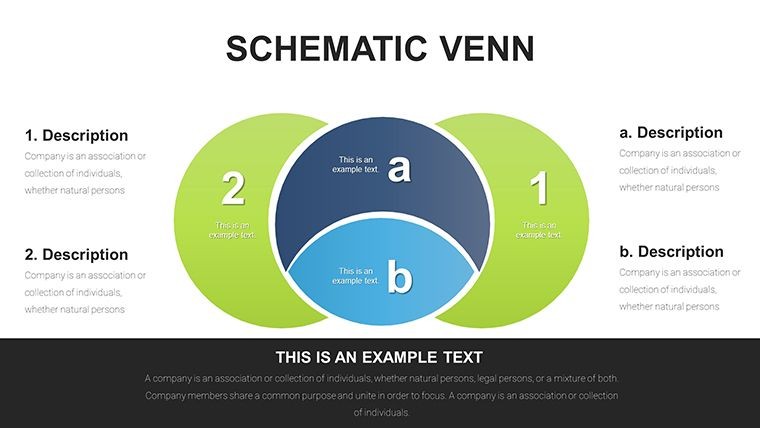
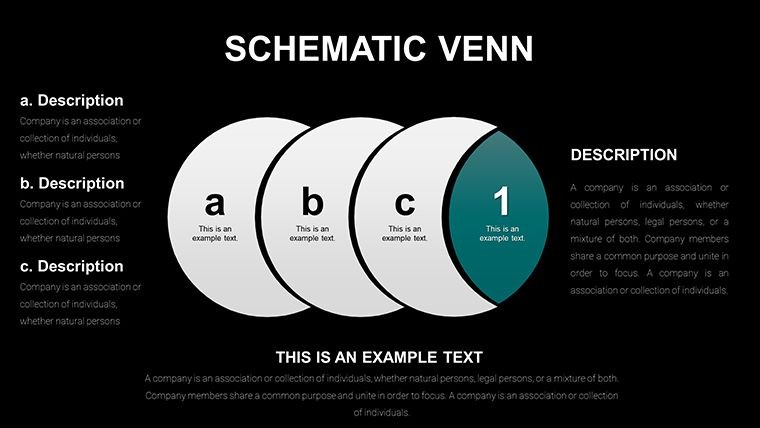
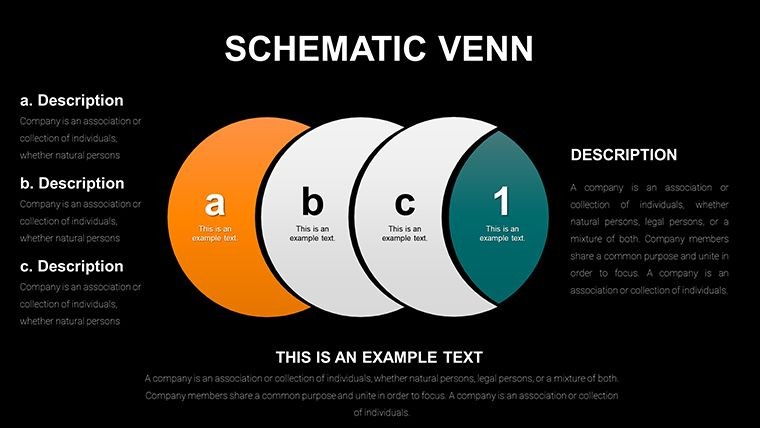
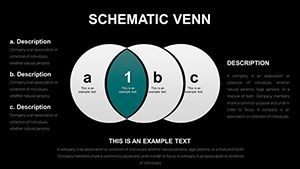
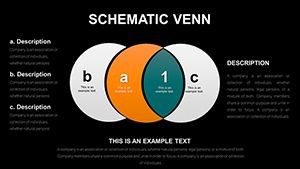
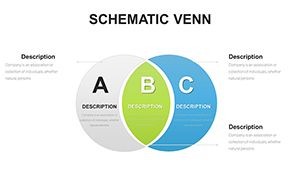
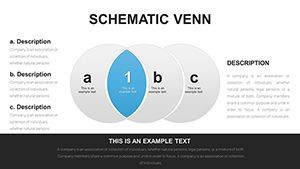
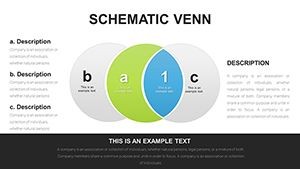
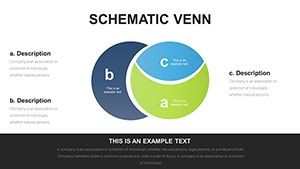
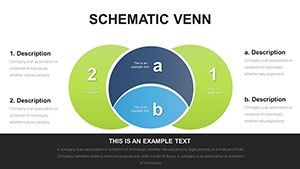
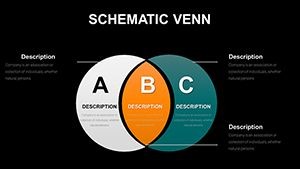
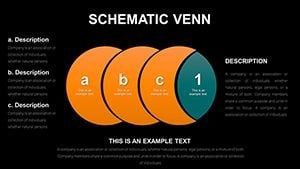
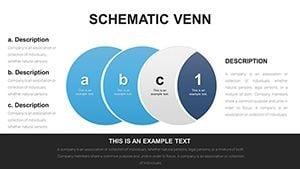
- Schematic Venn Designs: Clean lines and shaded regions for precise overlap representations.
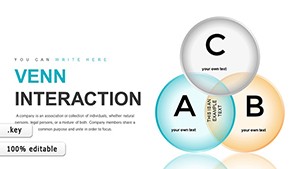
- Cycle Integration: Venns within loops for dynamic set evolutions.
- Logic and Stats Tools: Labels and formulas embedded for quick computations.
- Customization Layers: Transparency controls for nuanced intersections.
A university research team, inspired by such visuals, mapped genetic overlaps in bioinformatics, accelerating publication in Nature. These charts don't just draw circles - they draw conclusions.
Intuitive Editing and Deployment
Populate with drag-and-drop datasets from Numbers or SQL exports. For global teams, collaborate in real-time via Keynote Live. Pro move: Fade in overlaps sequentially to narrate logical progressions, turning static sets into stories.
Versatile Use Cases Across Disciplines
From classrooms to conferences, Venns clarify the chaos of convergence.
- Set Theory Lessons: Basic overlaps teaching inclusion-exclusion principles.
- Probability Modeling: Shaded areas quantifying joint events in risk assessments.
- Logic Puzzles: Multi-Venns for syllogism breakdowns in philosophy seminars.
- Stats Analysis: Correlation visuals for survey data intersections.
Mirroring a Gartner report on data overlaps, a fintech firm used Venn schematics to identify compliance synergies, cutting audit times by 35%. Unlock similar revelations in your work.
Outshining Standard Diagrams
Generic tools falter on scalability; these maintain razor-sharp edges and fluid animations, boosting comprehension per cognitive load studies.
Ready to intersect excellence? Get the Schematic Venn Template today and overlap into clarity.
Advanced Tips from Venn Veterans
Echo Stephen Murray's extensions: Incorporate hypercubes for higher dimensions. Choose complementary colors for overlaps to enhance readability. Link to Python scripts for auto-generated sets - the blend of analog charm and digital power.
This template isn't mere math; it's the art of revelation through relation.
Frequently Asked Questions
What fields benefit most from these Venn charts?
Set theory, stats, logic, and computer science, plus business for overlap analyses.
Can I add more than three circles?
Yes, editable vectors support expansions up to six for complex intersections.
How do animations work in presentations?
Keynote builds reveal overlaps progressively, aiding step-by-step explanations.
Compatible with Windows versions?
Exports flawlessly to PowerPoint for cross-platform compatibility.
What's included in the download?
A .key zip with all 25 slides, plus usage guide for quick starts.