Science Technology Society Venn Keynote Template - 30 Slides


Type: Keynote Charts template
Category: Venn
Sources Available: .key
Product ID: KC00863
Template incl.: 30 editable slides
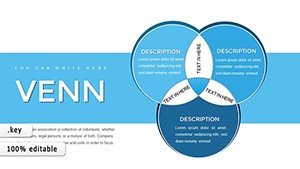
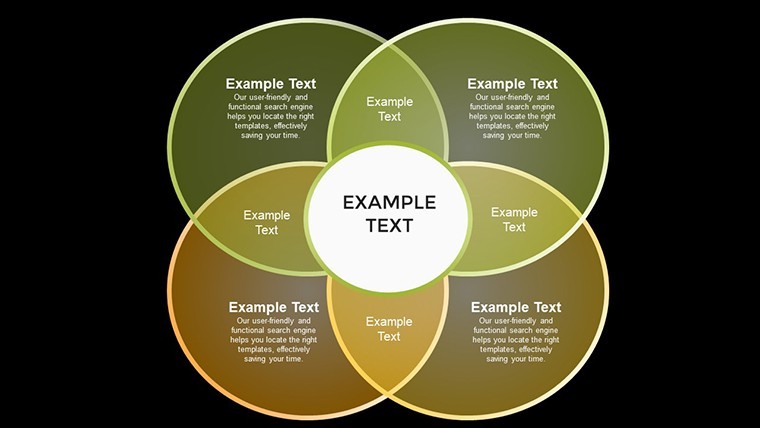
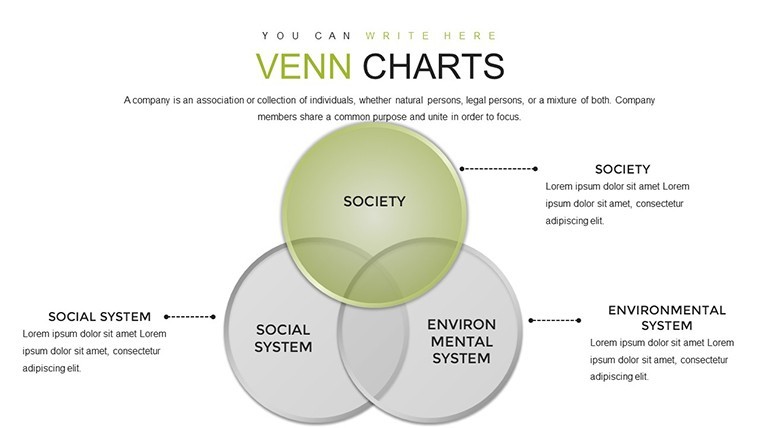
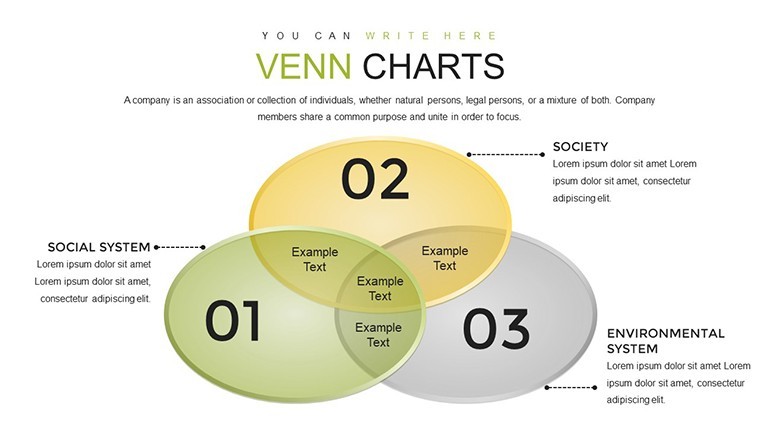
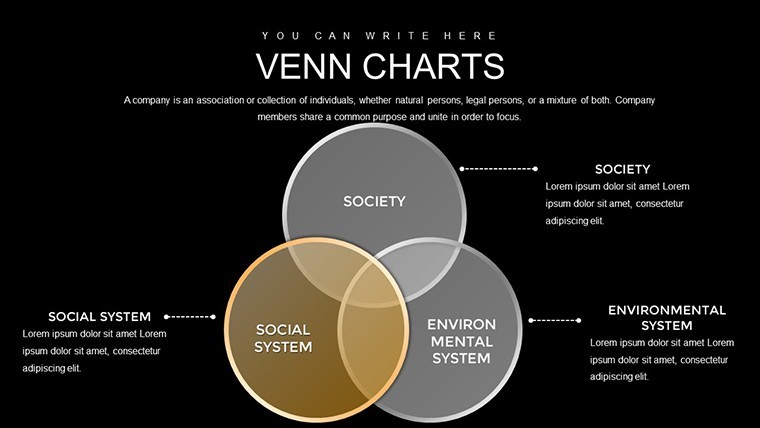
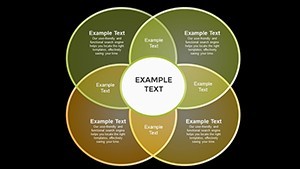
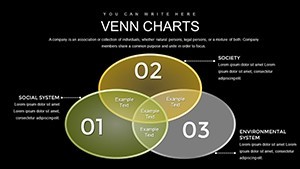
The interplay between science, technology, and society shapes our world in profound ways, from ethical AI debates to sustainable innovations. Our Science Technology and Society Venn Keynote Charts Template is crafted to illuminate these intersections, providing educators, researchers, and policymakers with a versatile tool to visualize complex relationships. Featuring 30 editable slides, it uses Venn diagrams to break down overlaps, making abstract concepts accessible and engaging.
Ideal for academic lectures, conference talks, or policy briefings, this template draws on interdisciplinary frameworks like those from STS (Science, Technology, and Society) studies. Envision mapping how biotech advancements impact social norms, with adjustable rings highlighting shared influences. Its flexible design allows for quick modifications, ensuring your message lands with clarity and impact in diverse settings.
Exploring Intersections Through Visuals
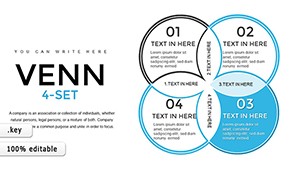
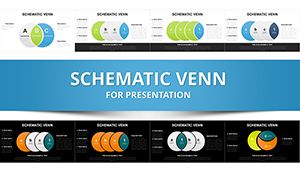
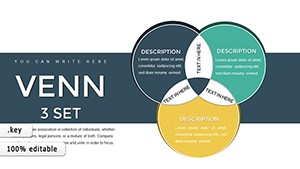
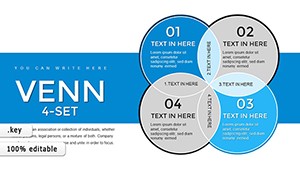
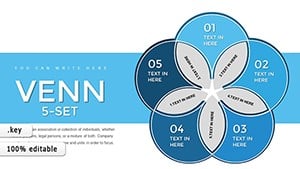
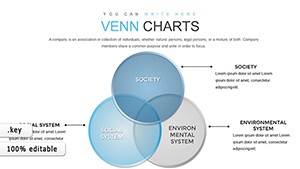
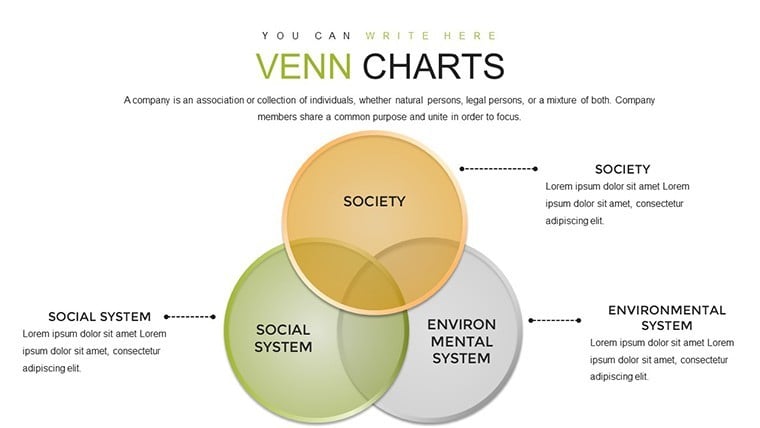
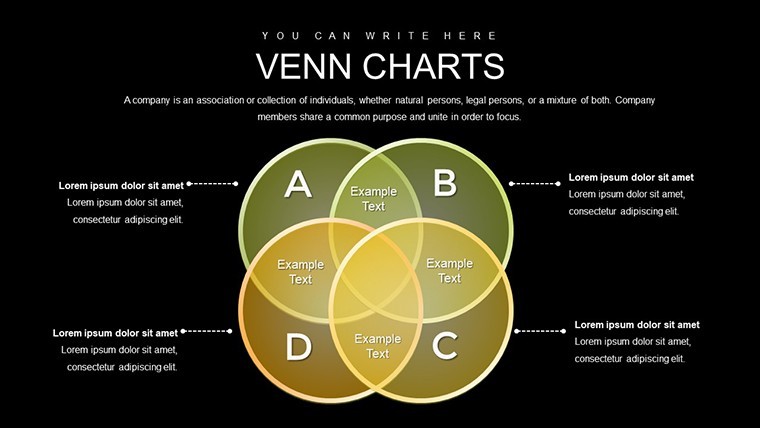
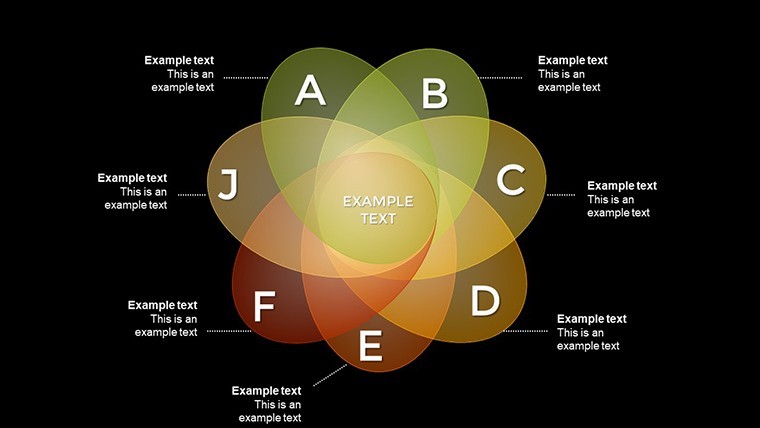
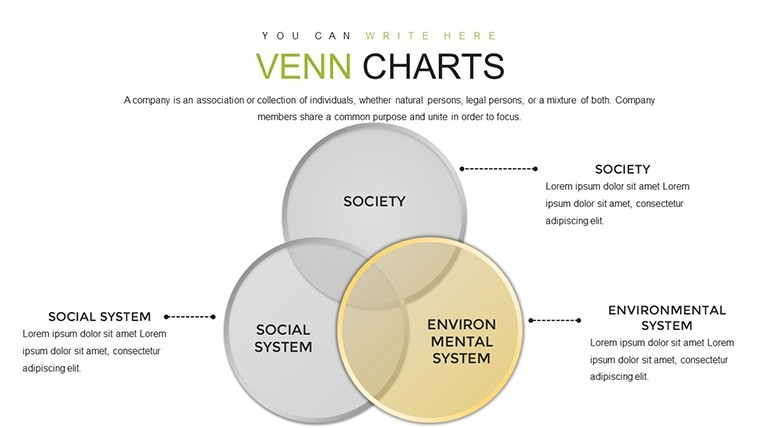
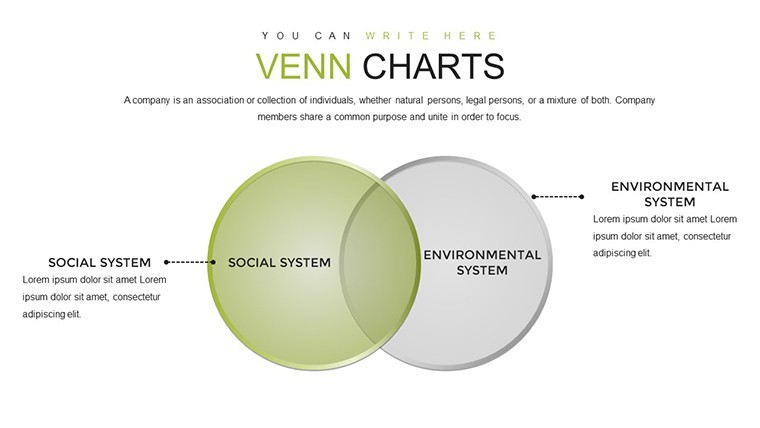
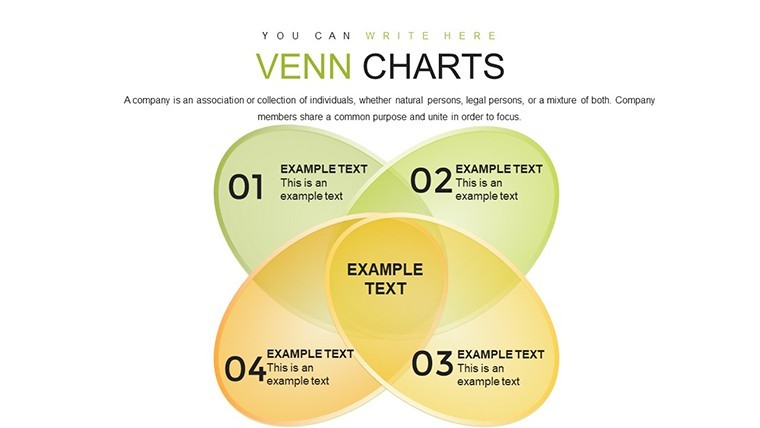
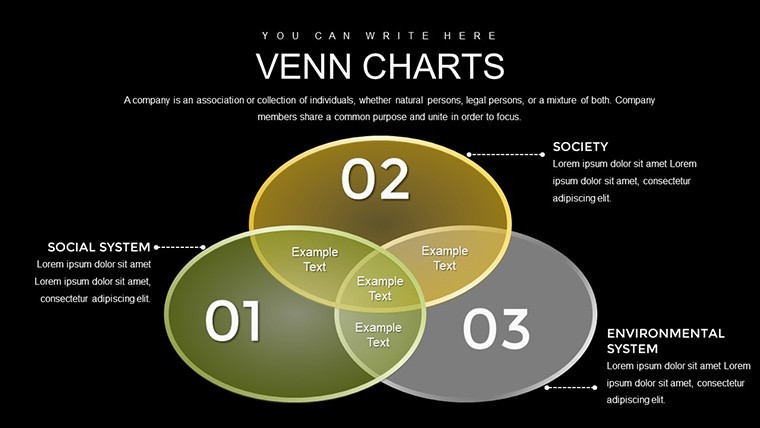
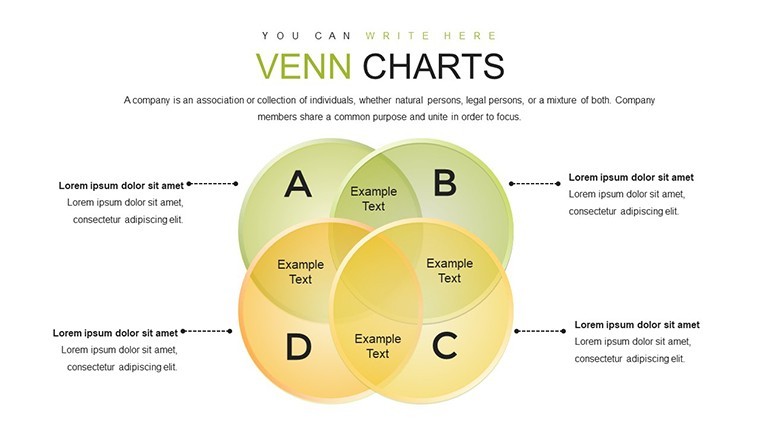
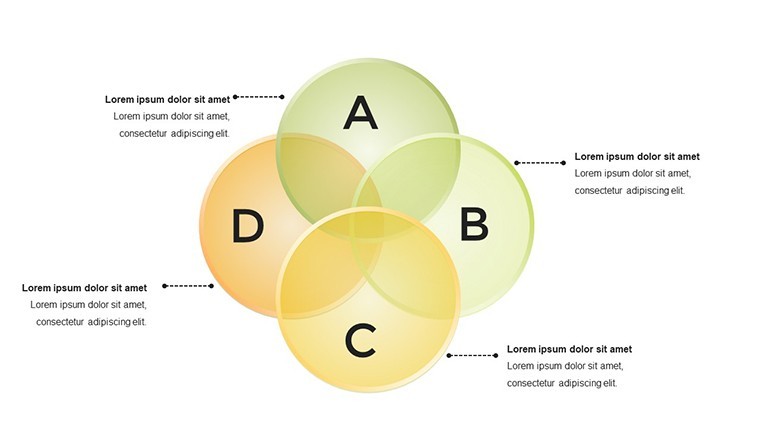
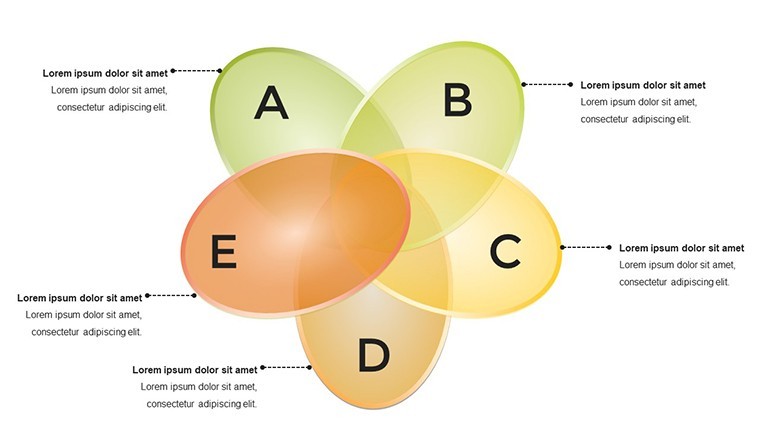
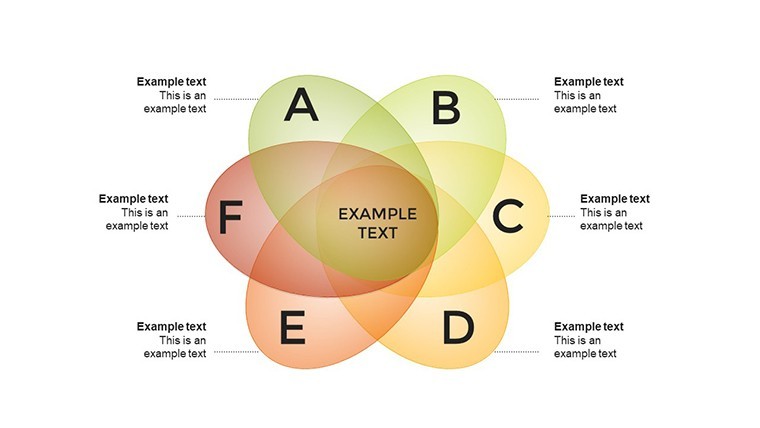
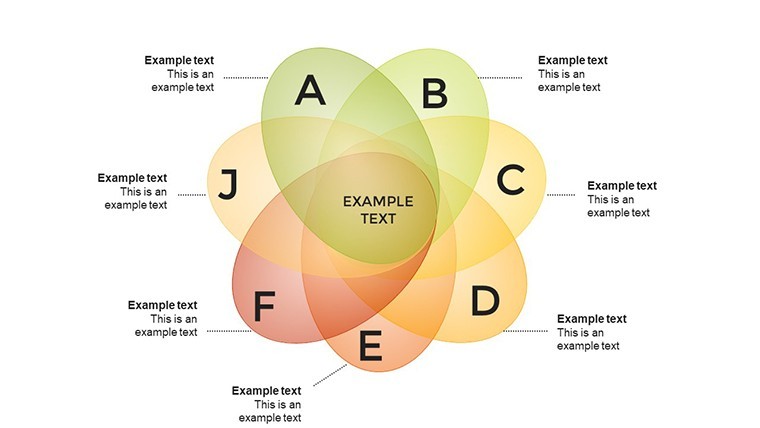
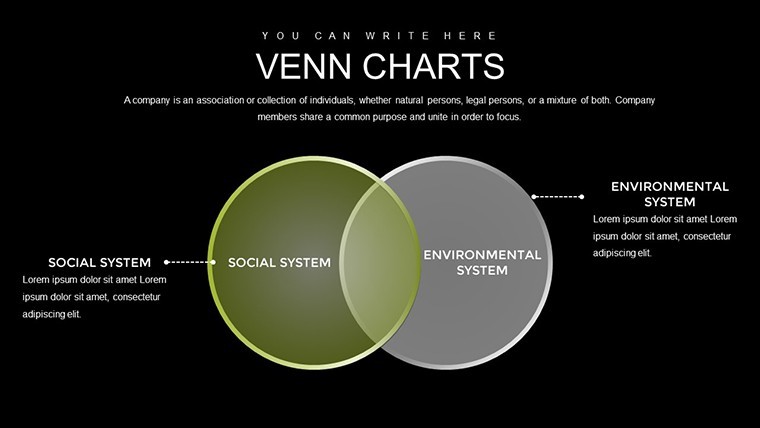
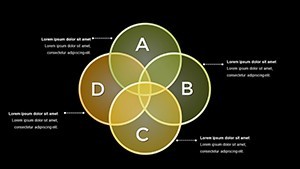
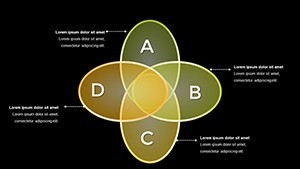
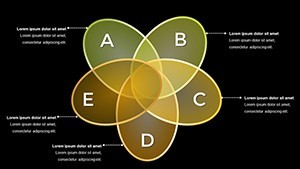
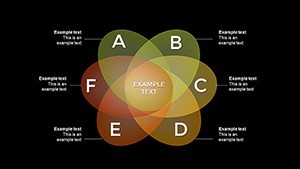
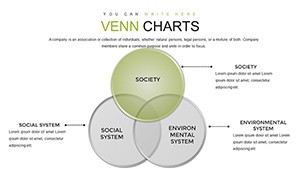
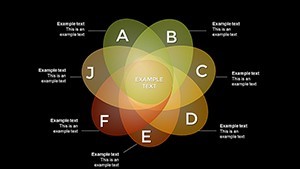
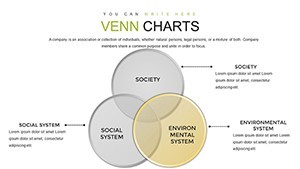
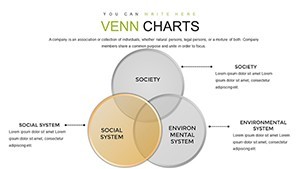
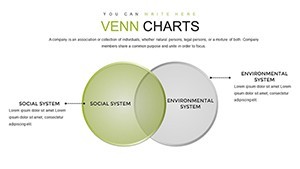
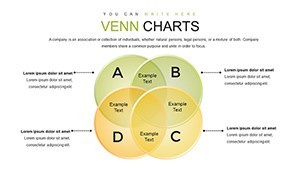
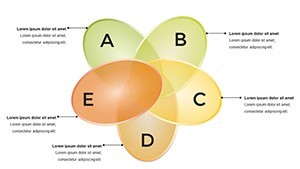
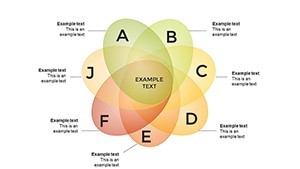
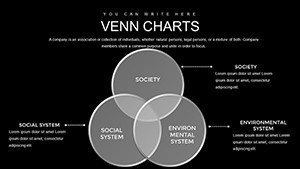
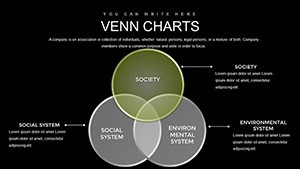
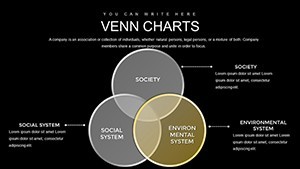
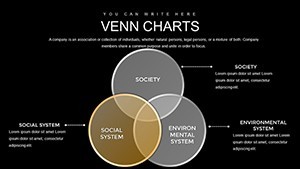
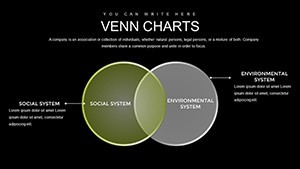
Venn diagrams excel at showing commonalities and distinctions, and this template maximizes that potential. Core slides offer multi-circle setups, from basic three-ring overlaps for science-tech-society triads to advanced configurations for deeper analyses. For instance, depict how climate tech (technology) draws from environmental research (science) while addressing societal needs like equity.
Weave in LSI terms like "interdisciplinary connections" or "ethical implications" via customizable labels, aligning with scholarly standards from journals like Social Studies of Science.
Core Features for Dynamic Diagrams
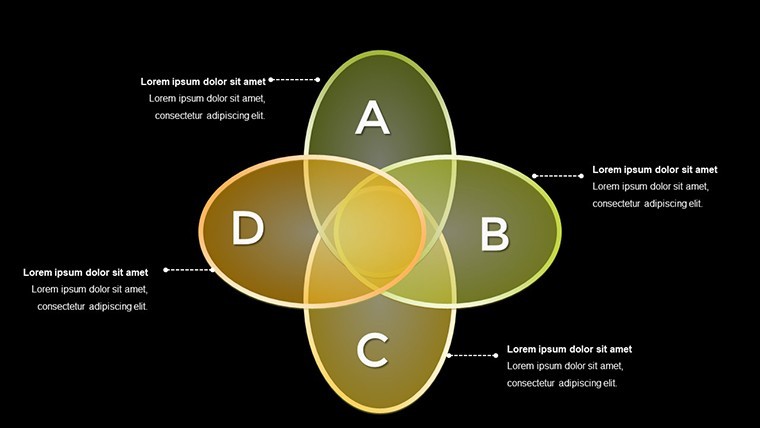
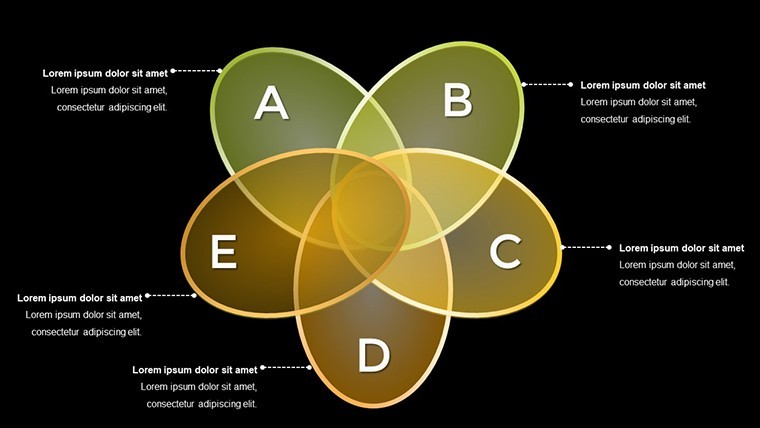
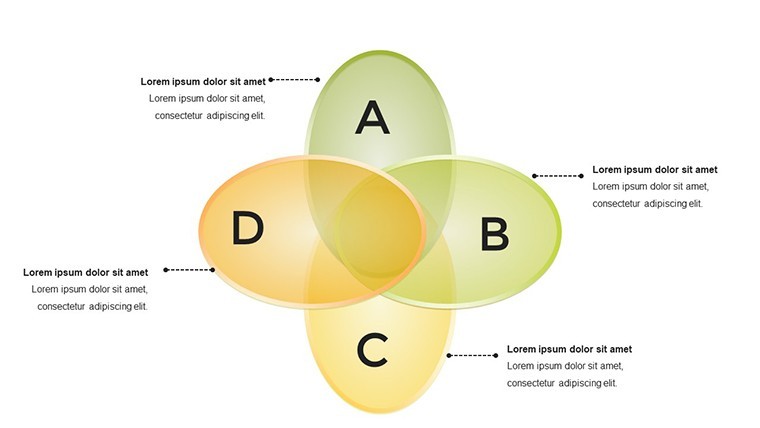
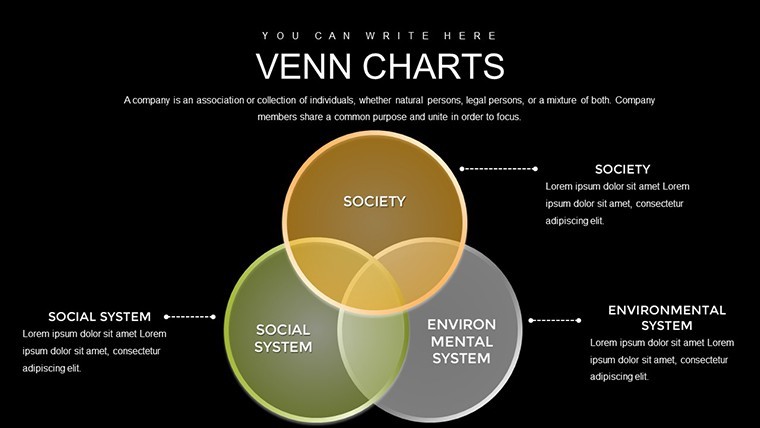
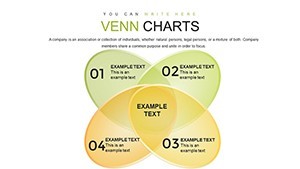
- Flexible Ring Manipulation: Move, add, delete, or resize circles to fit your narrative, with color changes for emphasis.
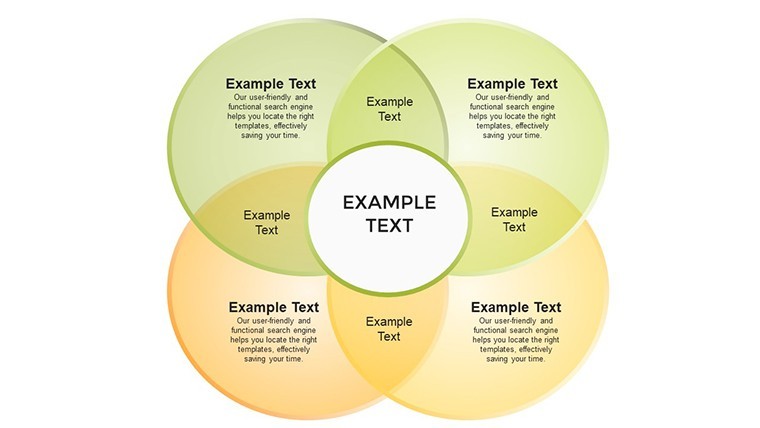
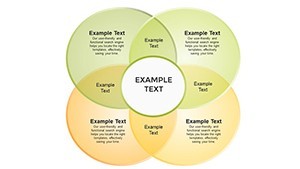
- Editable Annotations: Add text, icons, or data points within intersections for detailed explanations.
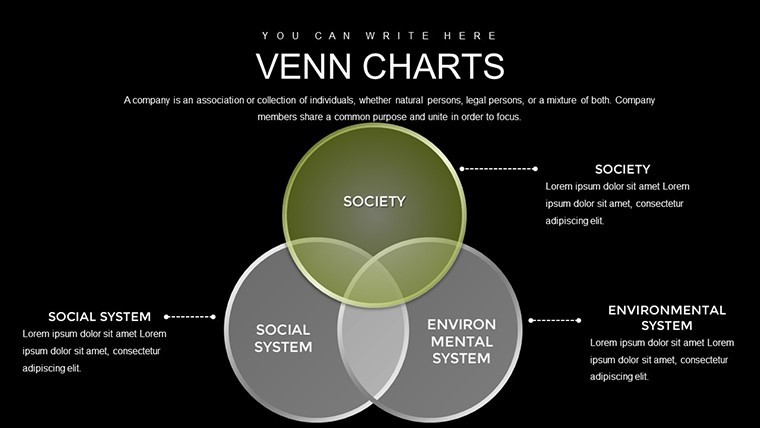
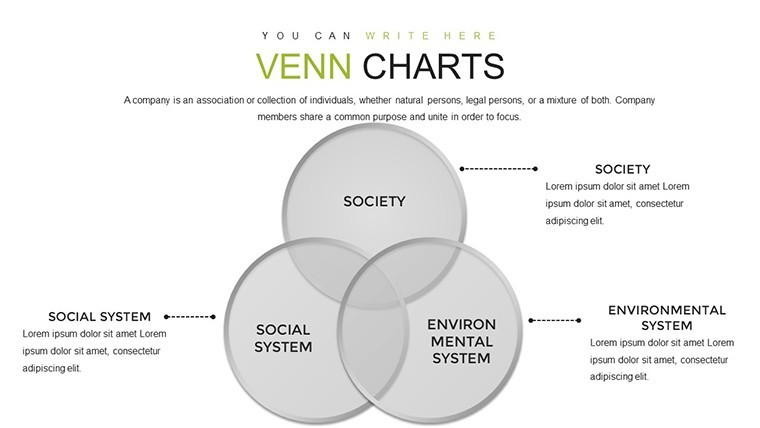
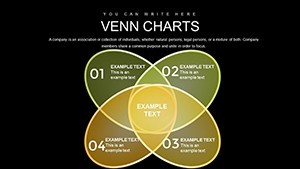
- High Customizability: Adjust opacities for subtle overlaps or bold contrasts in presentations.
- Thematic Elements: Includes STS-inspired icons, like gears for tech or globes for society.
- Easy Integration: Compatible with Keynote, supporting animations for revealing layers progressively.
These capabilities resolve typical issues, like static diagrams failing to convey nuance, by enabling interactive explorations.
Applications in Education and Beyond
This template thrives in academic environments, such as university courses on tech ethics, where Venn slides can illustrate privacy concerns at the tech-society nexus. A notable example: Researchers at MIT used similar visuals to present AI's societal impacts, fostering discussions that led to policy recommendations, as covered in STS literature.
For corporate R&D, map innovation pipelines, showing how scientific breakthroughs fuel tech developments with societal benefits. Policymakers might use it for impact assessments, like renewable energy's triple overlap.
- Choose a base Venn configuration based on your topics.
- Label circles and intersections with key concepts.
- Customize colors and add supporting text or images.
- Incorporate animations for step-by-step reveals.
- Present and gather feedback for refinements.
This sequence facilitates thoughtful creation. In K-12 education, simplify for younger audiences, perhaps with humor like "Where Science Meets Society: The Smartphone Saga."
Expert Tips for Engaging STS Presentations
Balance complexity - use fewer rings for intro topics, more for advanced. Enhance trustworthiness with citations, like referencing Bruno Latour's actor-network theory in notes.
Optimize for digital sharing with descriptive alt texts, e.g., "Venn Diagram of Science-Tech-Society Overlaps," boosting accessibility and search rankings. Leverage insights from STS conferences for authentic applications.
Empower Your Insights Today
This Venn template is a gateway to deeper understanding, blending flexibility with professional polish. With strong user feedback, it's a dependable resource for articulating interconnected ideas.
Uncover new perspectives - customize and present with confidence now.
FAQ
How flexible are the Venn diagrams? You can move, add, delete, or change colors of rings freely.
Suitable for which audiences? Educators, researchers, policymakers, and students in STS fields.
What format is the template in? .key for seamless Keynote use.
Can I add animations? Yes, Keynote supports easy animation additions to diagrams.
Ideal for group presentations? Absolutely, with collaborative editing features.
Any limitations on customization? None - full control over all elements.