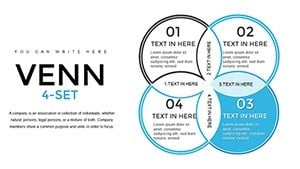
4-Set Venn Keynote Template - Fully Editable | ImagineLayout


Type: Keynote Charts template
Category: Venn
Sources Available: .key
Product ID: KC00790
Template incl.: 20 editable slides
Package Contents
20 editable slides arrive in one .key file.
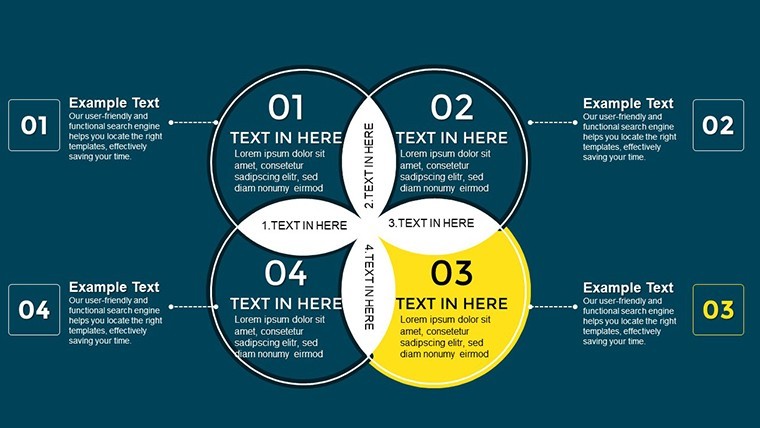
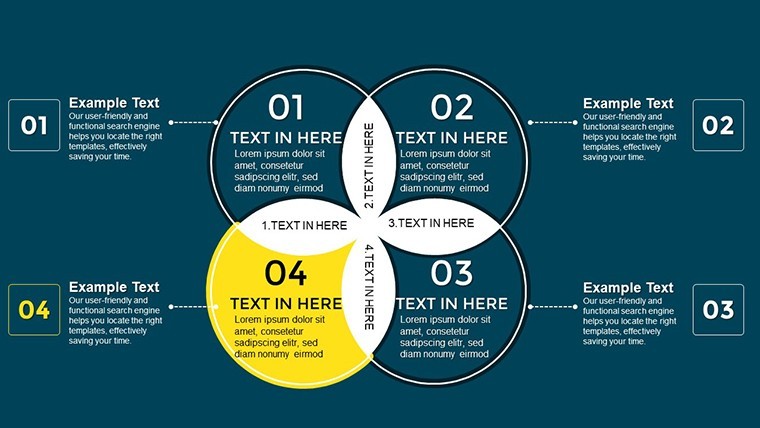
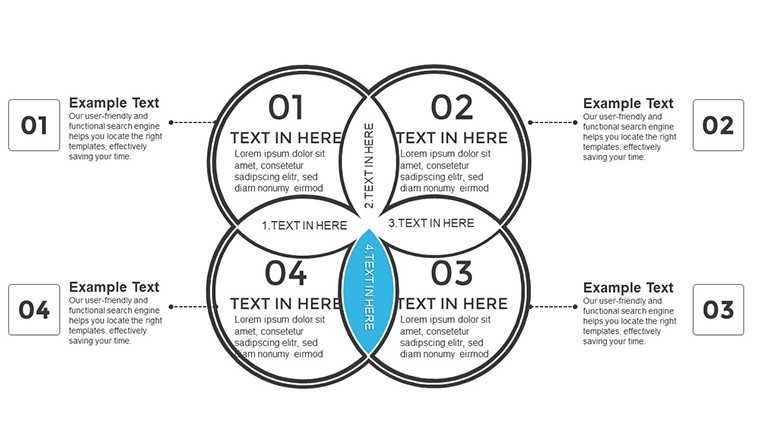
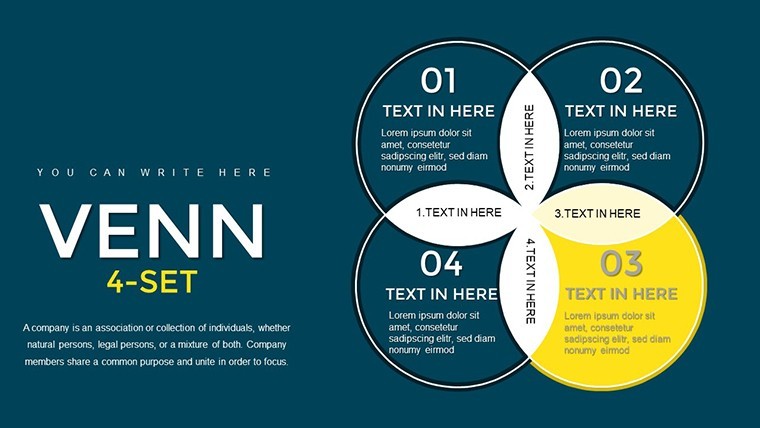
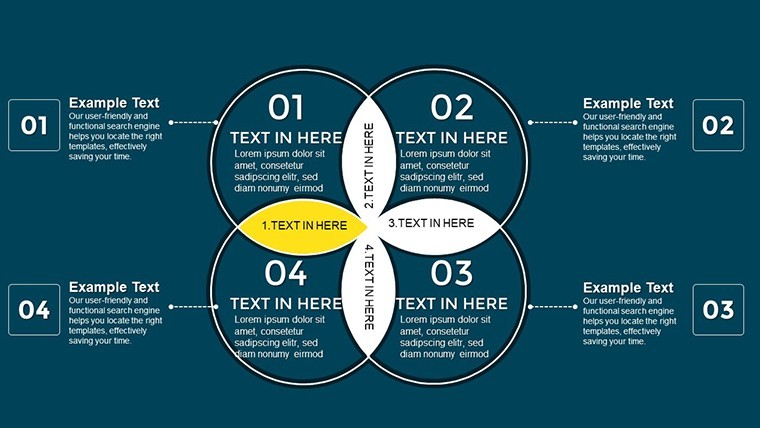
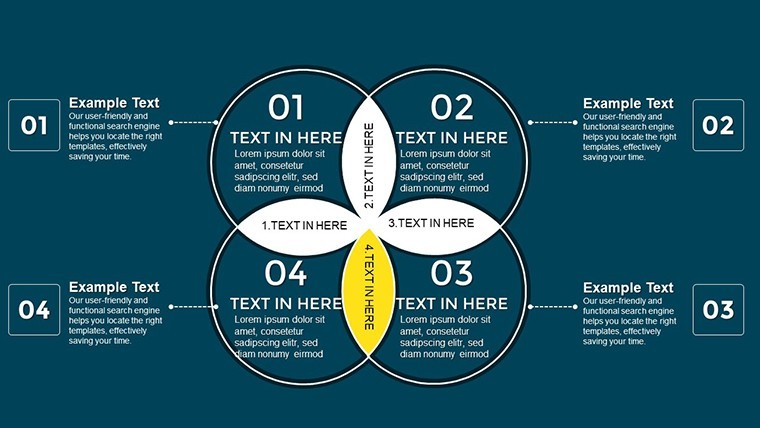
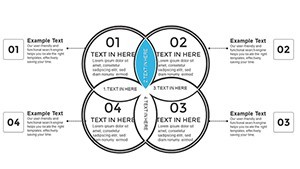
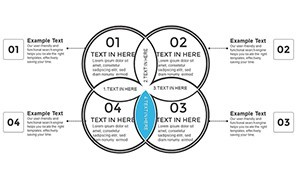
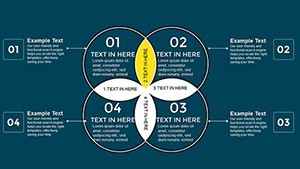
Colorful intersections plus animation builds cover all four sets.
File formats stay Keynote only.
Format and Compatibility Details
| Feature | Details |
|---|---|
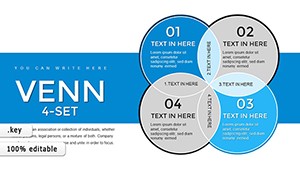
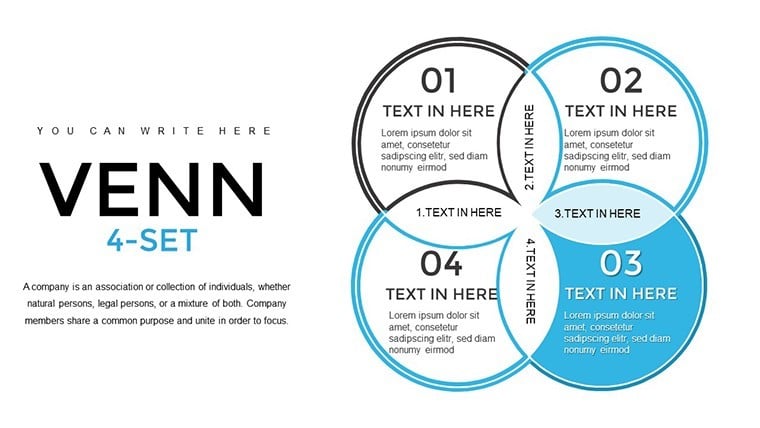
| Slides included | 20 editable slides built around 4-set Venn structure |
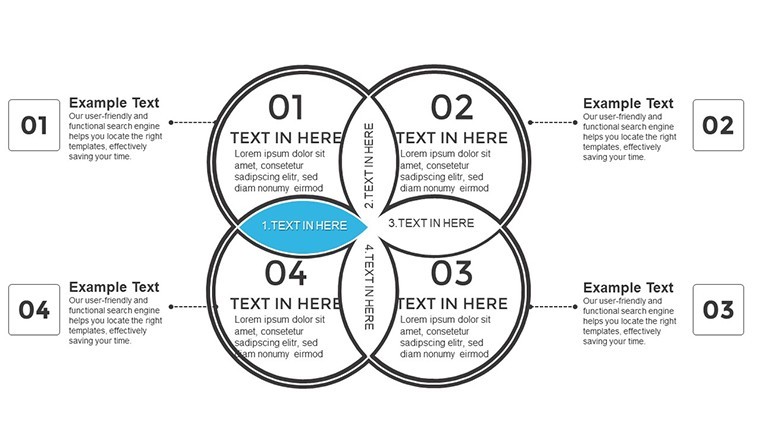
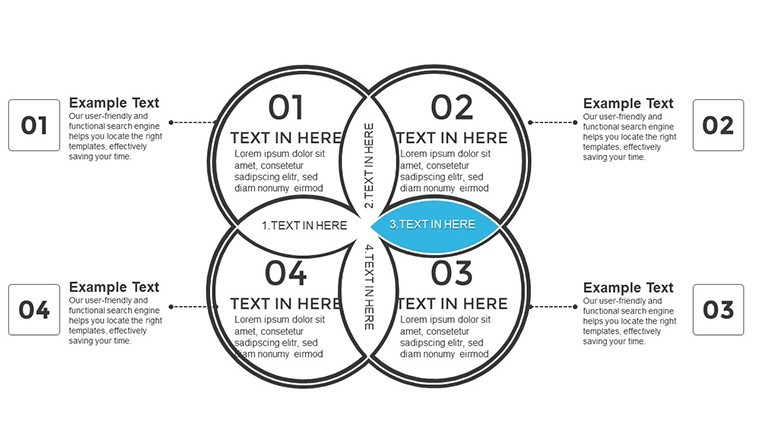
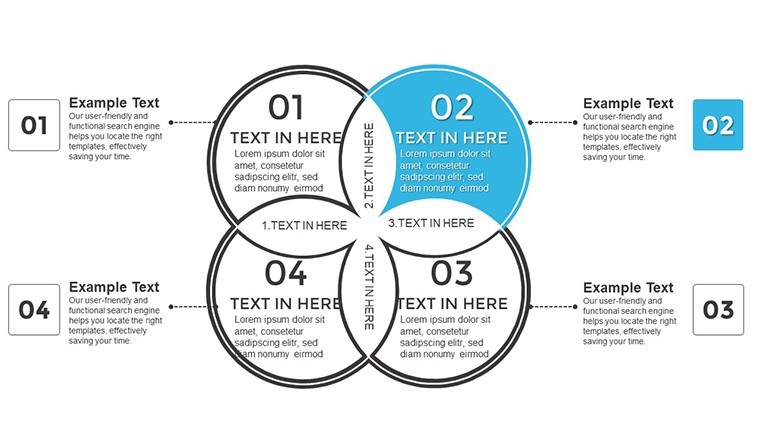
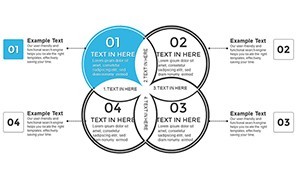
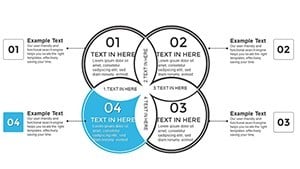
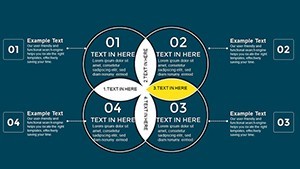
| Editable elements | intersection zones resize and recolor independently |
| Text placeholders | labels edit without unlocking grouped elements |
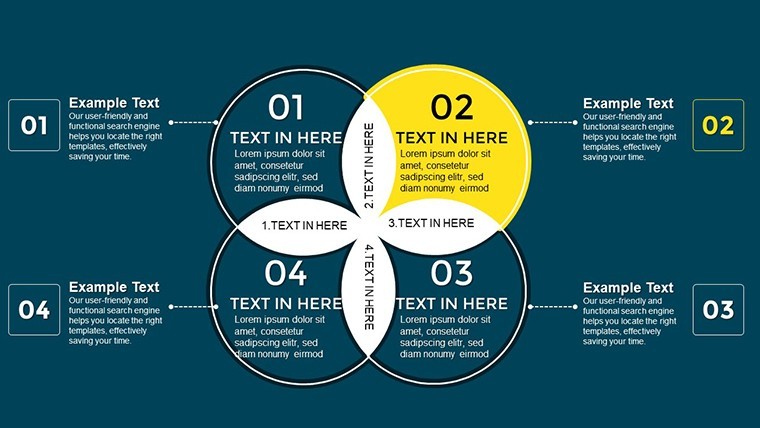
| Color theme adjustments | compatible with Keynote slide master color palette |
| Diagram connectors | overlap lines adjust direction and weight |
| Export options | Keynote for editing plus PDF for distribution |
| Aspect ratio | standard 16:9 across all slides |
Who Reaches for This Template
Data analysts in research firms use the file for internal reporting on market overlaps.
They reuse the same deck across three client reports by swapping color schemes.
Educators in statistics courses adapt it for academic lectures.
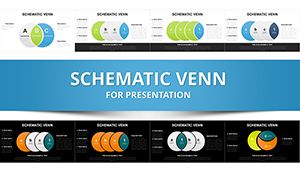
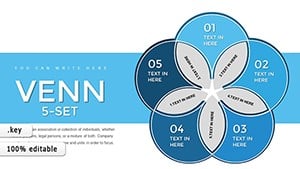
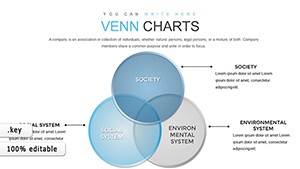
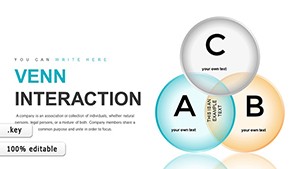
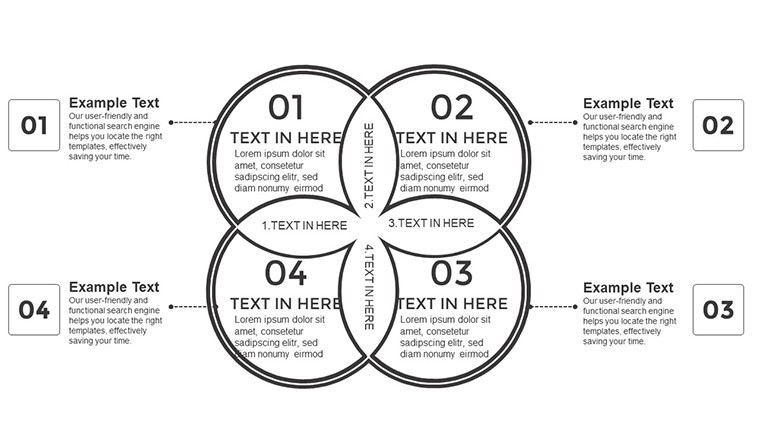
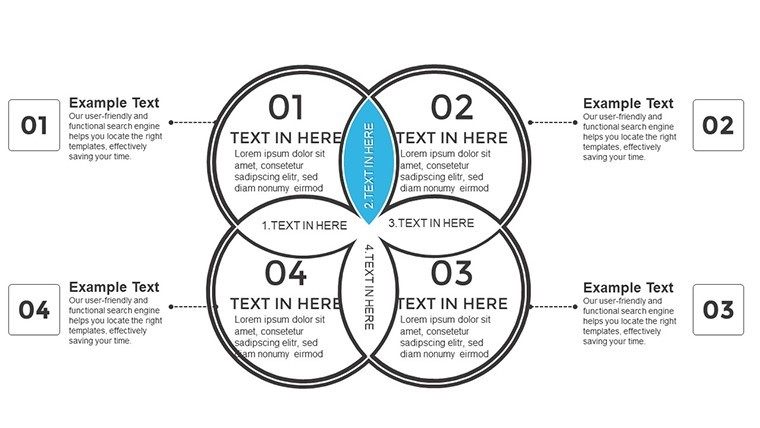
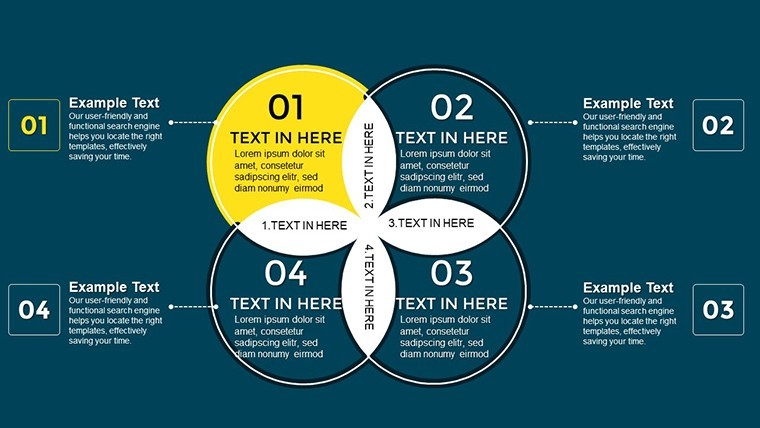
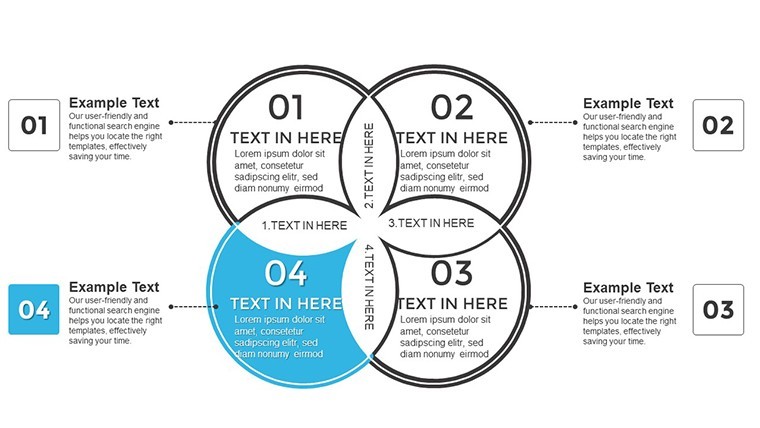
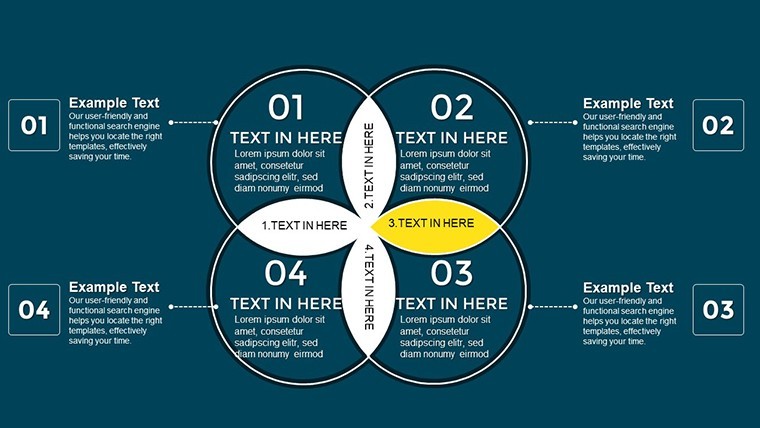
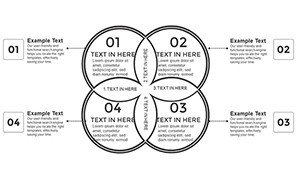
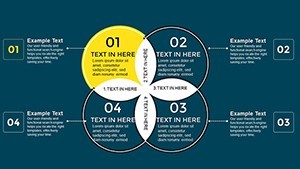
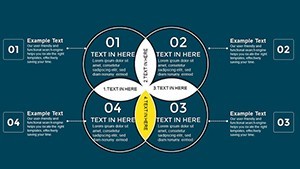
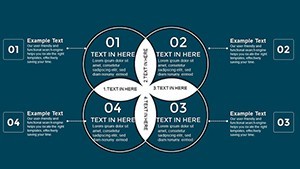
This 4-set version stands out from the related 5-set Venn and schematic Venn because it features animation builds on every intersection.
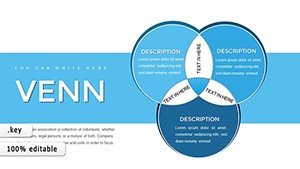
One specific visual characteristic is the colorful overlap zones.
It works best for data relationship tasks over neighbors since the four-set limit matches common comparison needs.
The paid version includes the full 20 slides and animation builds that previews omit.
Download now to visualize your next data overlaps
Edit, Brand, Present: The Workflow
1. Open the .key file in Keynote 12 or later (1 minute).
2. Replace placeholder text in intersection labels (3 minutes).
3. Adjust brand colors via slide master (2 minutes).
4. Modify zone segmentation and layout composition (4 minutes).
5. Trigger animation builds (2 minutes).
Editing difficulty stays moderate.
What You'd Need to Replicate This Yourself
Building equivalent Venn overlaps from scratch demands advanced Keynote skills plus three hours per set.
Here the intersection zones already exist so only labels change.
Many diagrams crowd labels inside zones yet that lowers readability during projection.
This layout places labels outside the overlaps connected by thin lines raising clarity in academic lectures.
Data analysts often combine this Venn with Fishbone Diagram Keynote Charts for root cause analysis.
Get the template and save hours on your next business presentation
Which Keynote versions does the file support?
The .key file opens correctly in Keynote 12 and all later releases including the latest 14.x versions.
Older releases before version 12 may show missing animations or layout shifts.
Always test in your installed version before the final meeting.
No PowerPoint conversion is required since the native format stays Keynote.
How do I change the color scheme?
Select any slide then open the slide master view.
Update the theme colors there and they propagate across every arrow and timeline.
Individual shapes can still receive custom fills without affecting the master.
The process takes under two minutes once you locate the master.
Is client work allowed under the license?
The license permits use in paid client projects and internal company decks.
Resale of the file itself or distribution as a standalone product remains prohibited.
Sublicensing or sharing the original .key with third parties also violates terms.
Modified exports in PDF or image format stay fully compliant for client delivery.
What separates the paid version from free previews?
The paid download supplies all 20 slides plus the complete animation suite.
Free previews contain only static JPEG exports of the first two slides.
Layered editable elements and timelines appear exclusively in the paid file.
No watermarks exist once you complete the purchase.
Which file formats are included?
Only the native .key format ships with the purchase.
Keynote remains the required software to open and edit the content.
Export to PDF or image happens inside Keynote after customization.
No POTX or PowerPoint files accompany the package.
What is the refund policy?
Refunds process within 14 days of purchase if the file fails to open in your Keynote version.
You must provide proof of the compatibility issue before approval.
Opened and edited files no longer qualify for refund.
Contact support directly through the account dashboard to start the request.