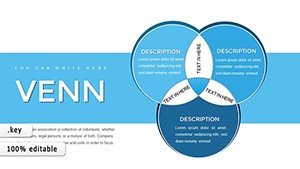
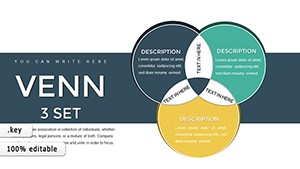
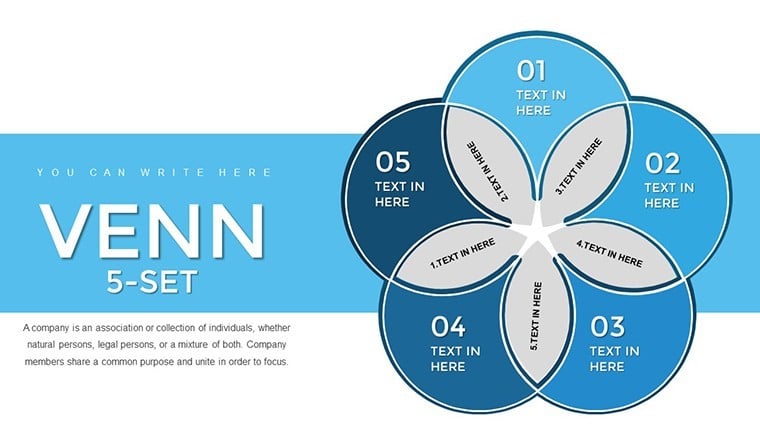
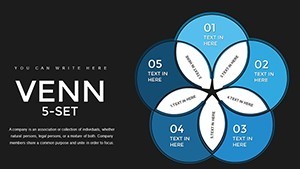
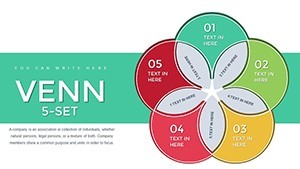
Venn 5-Set Keynote Charts: Decode Multifaceted Overlaps


Type: Keynote Charts template
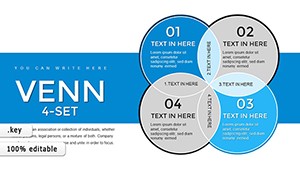
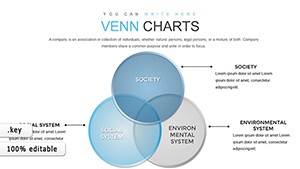
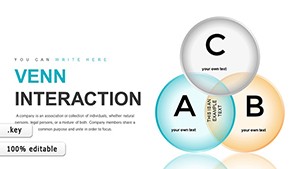
Category: Venn
Sources Available: .key
Slide size: widescreen (16:9)
Product ID: KC00789
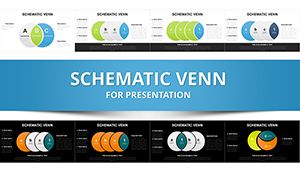
Template incl.: 39 editable slides
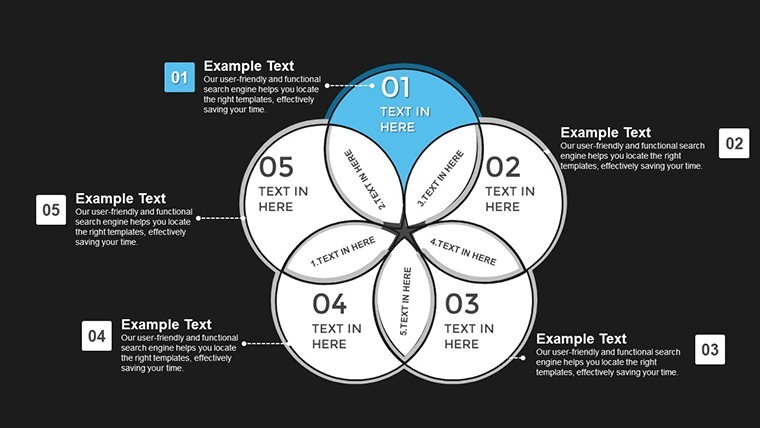
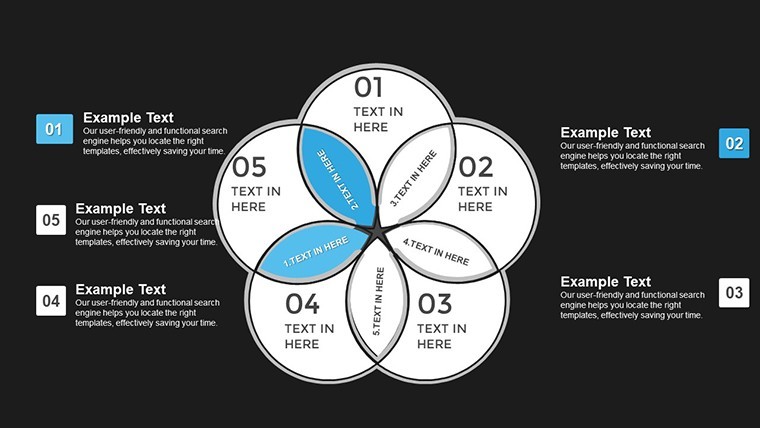
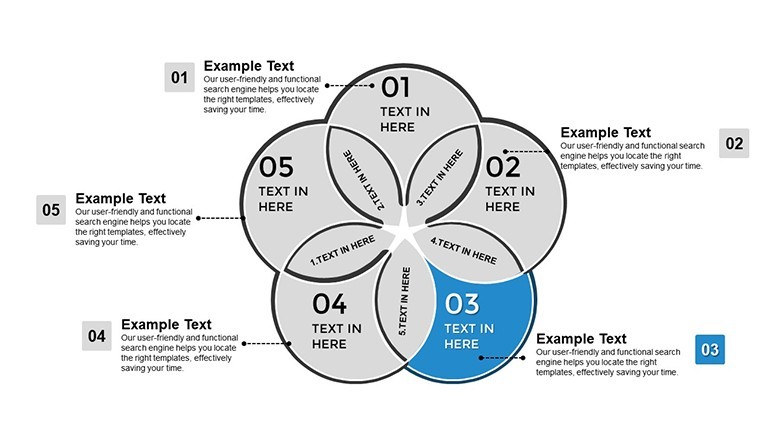
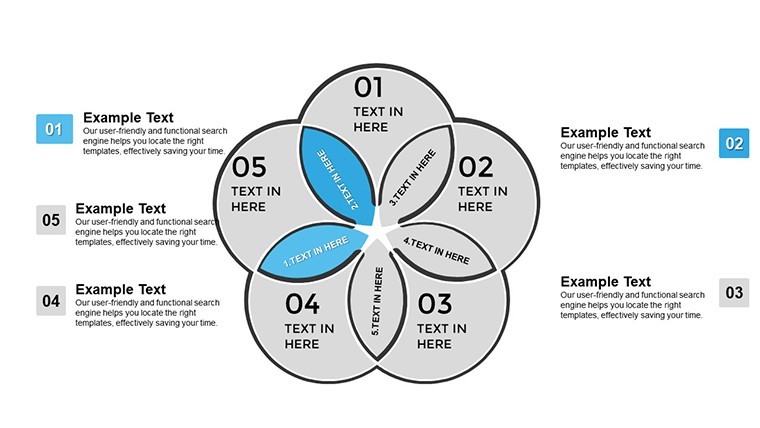
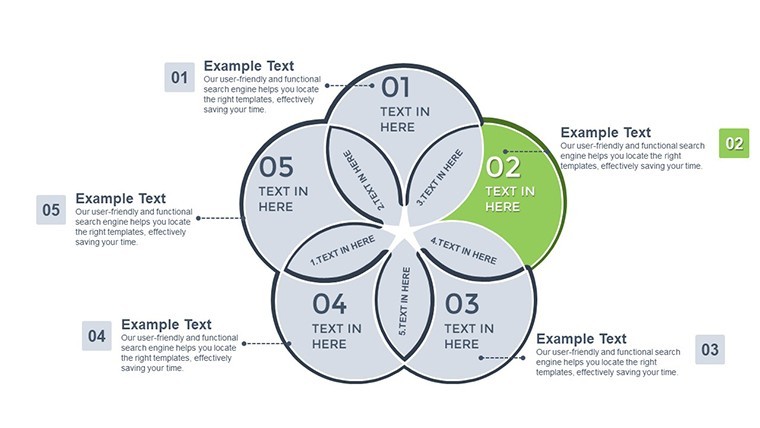
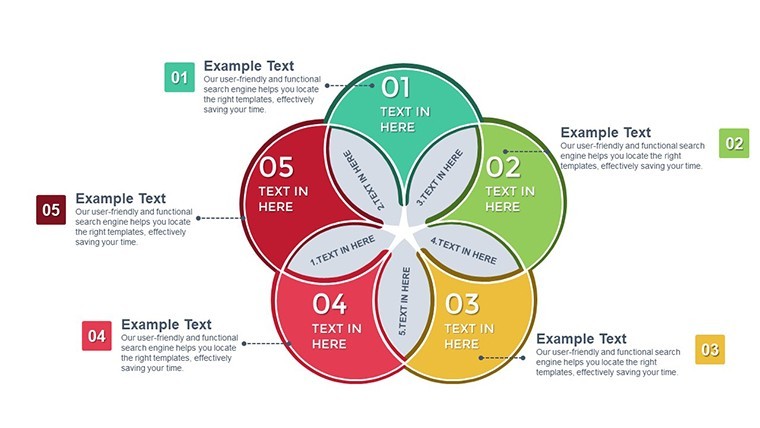
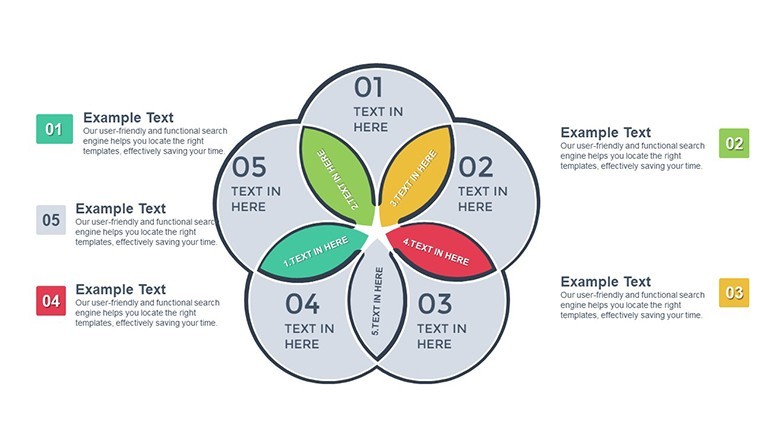
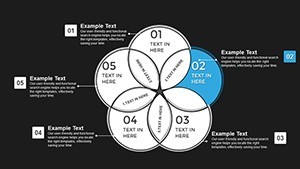
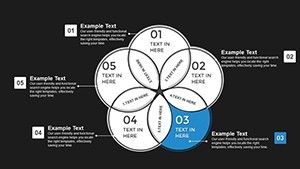
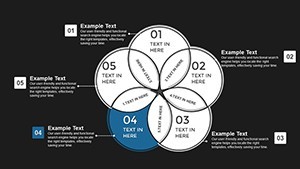
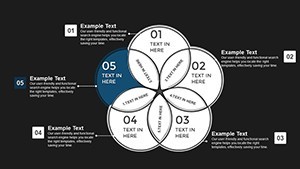
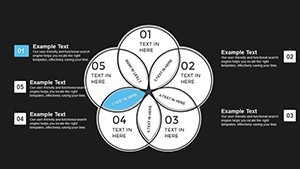
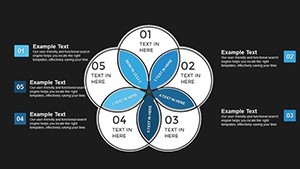
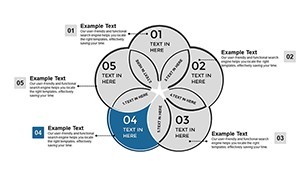
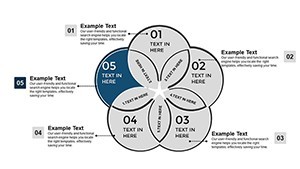
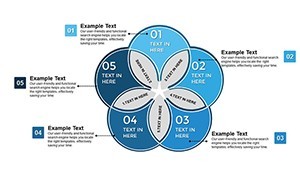
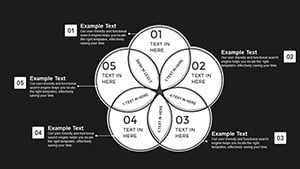
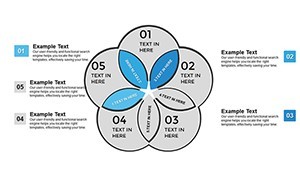
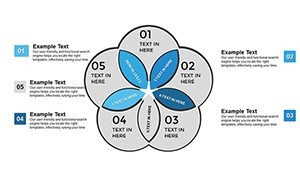
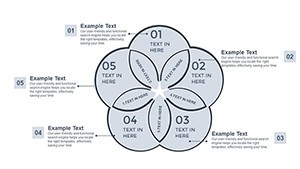
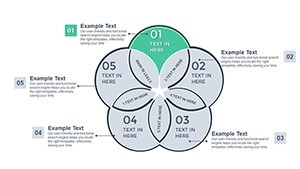
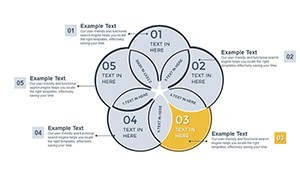
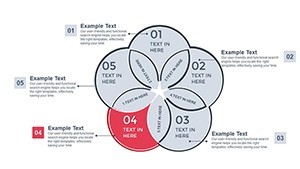
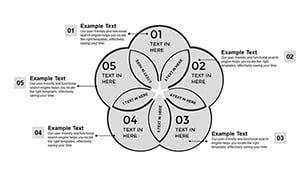
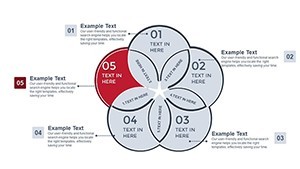
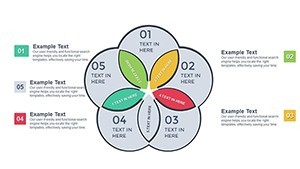
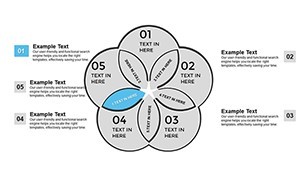
When datasets intersect in five dimensions, clarity becomes paramount - enter our Venn 5-Set Keynote Charts Template, a powerhouse with 39 editable slides for advanced logical visualizations. Designed for statisticians unraveling multivariate data, linguists exploring semantic fields, or computer scientists modeling algorithms, this template renders all possible relations among five sets with elegant precision. Circles overlap in intricate patterns, spotlighting shared qualities in intersection zones while delineating exclusions. More than static diagrams, it supports Keynote's widescreen format and animations, enabling you to animate builds for progressive reveals. This tool bridges the gap between complexity and comprehension, empowering users to present nuanced insights in conferences, research papers, or strategy meetings with authority and ease.
Core Features for Sophisticated Set Analysis
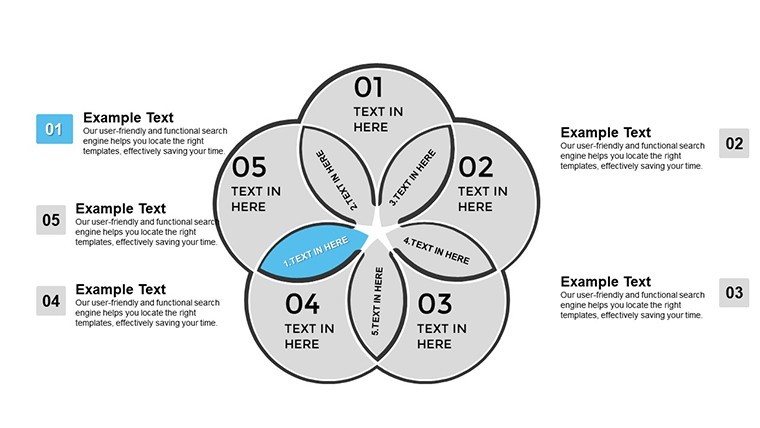
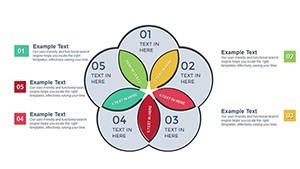
At its heart, the template excels in handling five-set complexities, where traditional tools falter. With 39 variations, you cover every configuration, from symmetric arrangements to asymmetric emphases. Benefits encompass time savings - bypass manual drawing - and deeper insights, as endorsed by logic frameworks from Boolean algebra pioneers. In practice, a data scientist might use slide #20 to map user behaviors across platforms, revealing niche overlaps. The vector-based design ensures scalability, adhering to standards from the Institute of Mathematical Statistics for precise representations.
Highlighting Key Attributes
- Extensive Variations: 39 slides offer diverse layouts for flexible application.
- Scalable Vectors: Edit without distortion, maintaining sharpness at any size.
- Animation Capabilities: Layer reveals to simulate set unions and intersections.
- Widescreen Optimization: Tailored for modern presentations, enhancing visibility.
- Easy Data Insertion: Populate with text, numbers, or icons for enriched content.
These draw from expert methodologies, like those in computational linguistics, for robust utility.
Diverse Applications in Advanced Fields
For probability experts, these charts illustrate joint distributions across five variables, aiding risk assessments in finance. In linguistics, slide #30 could depict phoneme overlaps in dialects, supporting comparative studies. Computer science benefits from visualizing graph theory nodes, as in network security models. Entrepreneurs use them for market analysis, overlapping consumer trends, tech adoption, and competitors. A notable case: A research team at a university employed 5-set Venns in a paper on bioinformatics, clarifying gene expression patterns and accelerating peer reviews. In corporate settings, they facilitate merger evaluations by mapping asset synergies.
Step-by-Step Customization Process
- Select a layout from the 39 options, starting with a balanced five-circle on slide #1.
- Label sets and intersections with your specifics - e.g., variables in a stats model.
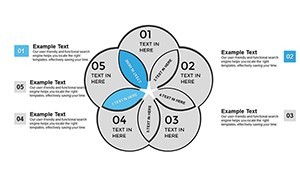
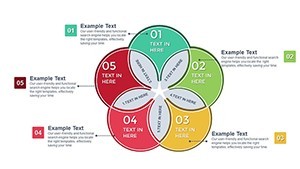
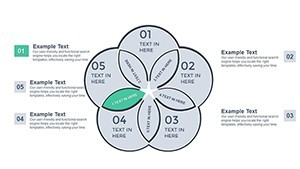
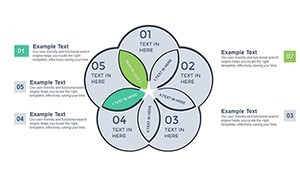
- Apply color gradients to denote hierarchy or intensity in overlaps.
- Add animations: Have outer sets fade in before revealing cores.
- Validate with Keynote's tools, exporting for cross-platform sharing.
Pair with software like Python's Matplotlib for data prep, streamlining advanced workflows.
Edge Over Simpler Venn Tools
Unlike basic three-set options, this handles five-way intricacies with uncluttered designs, including helper grids for alignment. Thematic elements bolster professionalism, instilling confidence. Phrases like "advanced 5-set Venn templates" integrate smoothly for optimization. Invitations such as "Explore multifaceted data now" guide users gently.
Expert Advice for Optimal Use
Craft stories: Begin with full sets and drill into intersections for revelation. Add whimsy with lines like "Where five worlds collide - in harmony!" for engaging talks. Back with citations from logic texts for . Test on devices to ensure animation fluidity in diverse settings.
Concluding, this Venn 5-Set Keynote Charts Template is essential for tackling complexity head-on. Amplify your analytical prowess - intersect with excellence starting today.
Frequently Asked Questions
How do I manage complexity in 5-set Venns?
Use color coding and animations to simplify visuals, focusing on key intersections.
Compatible with Keynote on iPad?
Yes, fully functional on iOS devices for on-the-go edits.
Can it handle quantitative data?
Absolutely - add numbers or charts within intersections for detailed analysis.
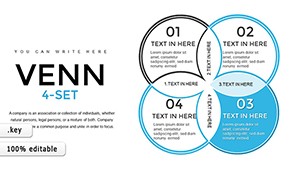
Differences from 4-set versions?
More slides and configurations for handling an extra set's added relations.
How to export for collaboration?
Save as PDF or share via iCloud, preserving most animations.