Venn Diagram Keynote Template - 34 Fully Editable Slides | Instant Download | ImagineLayout


Type: Keynote Charts template
Category: Venn
Sources Available: .key
Product ID: KC00786
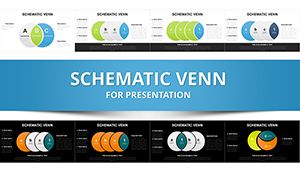
Template incl.: 34 editable slides
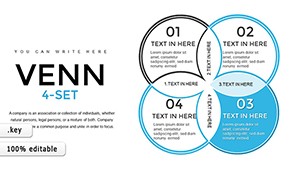
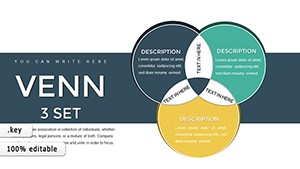
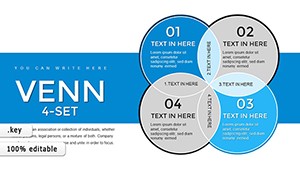
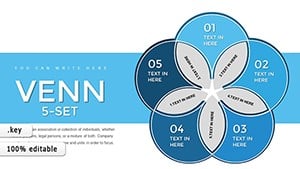
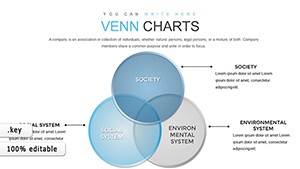
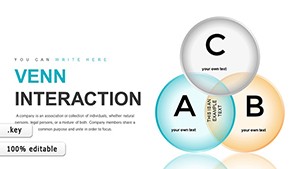
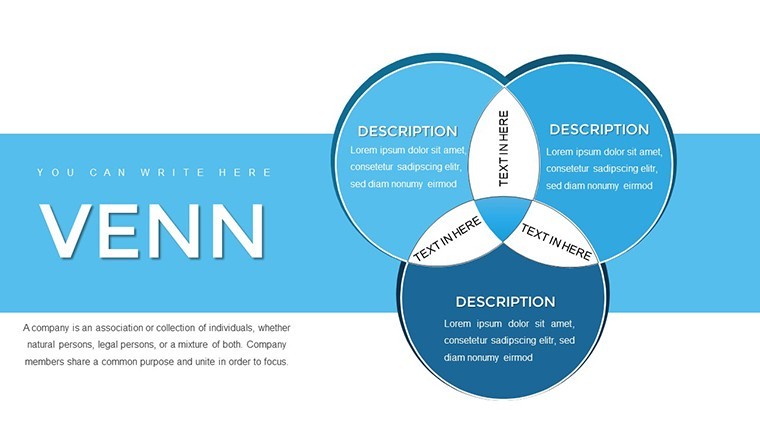
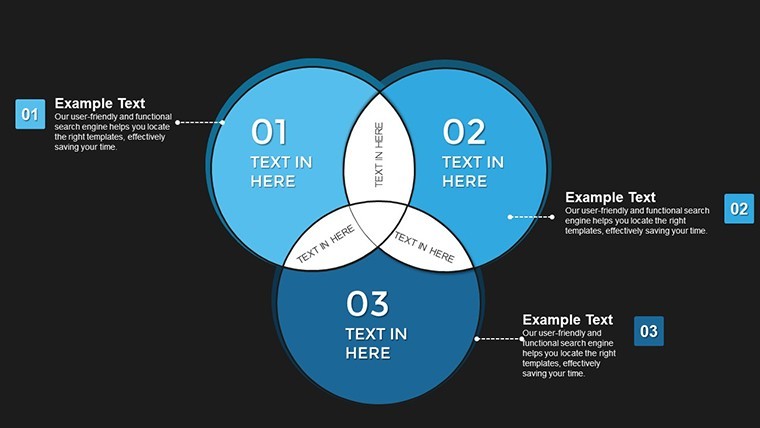
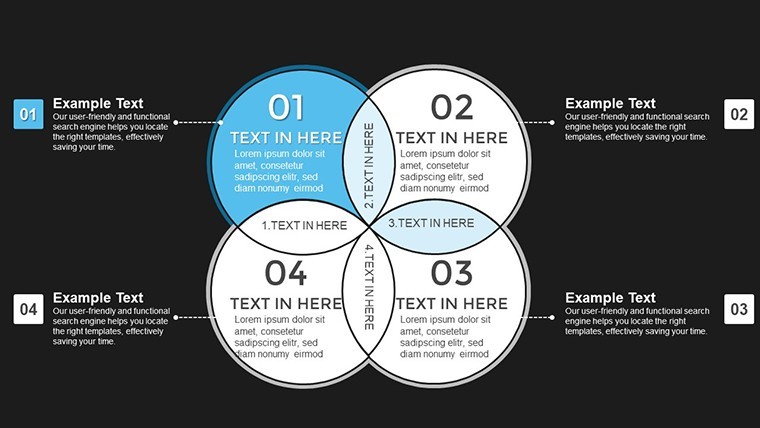
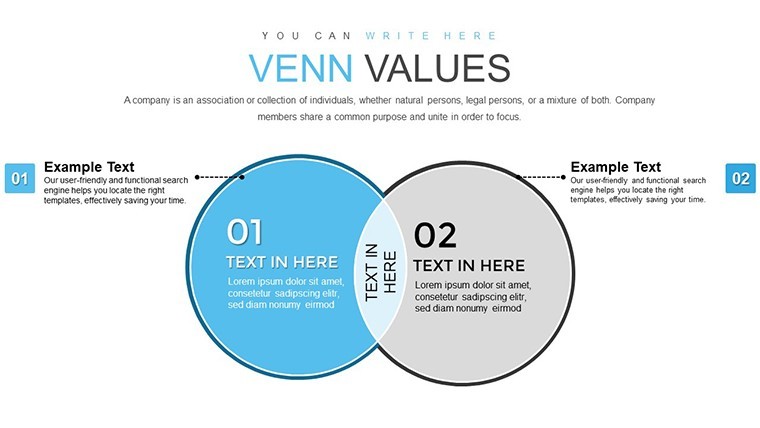
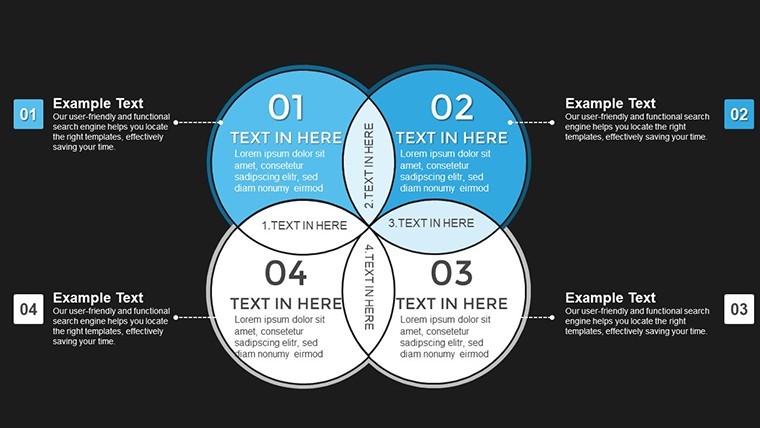
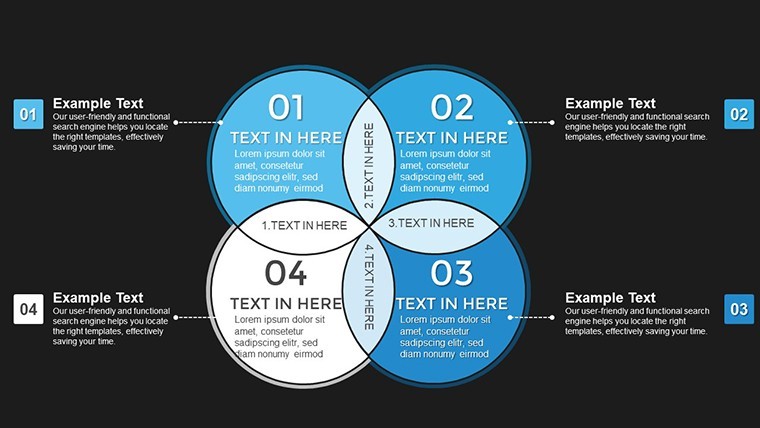
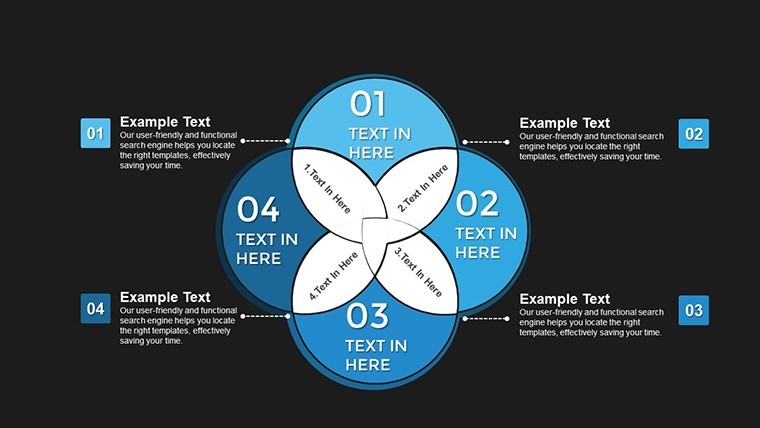
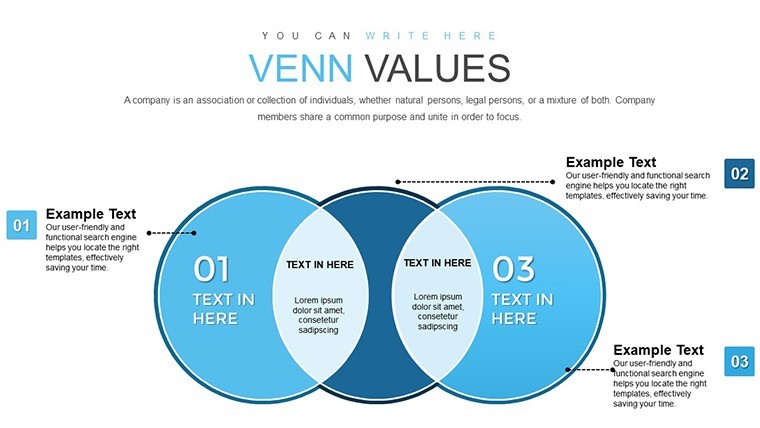
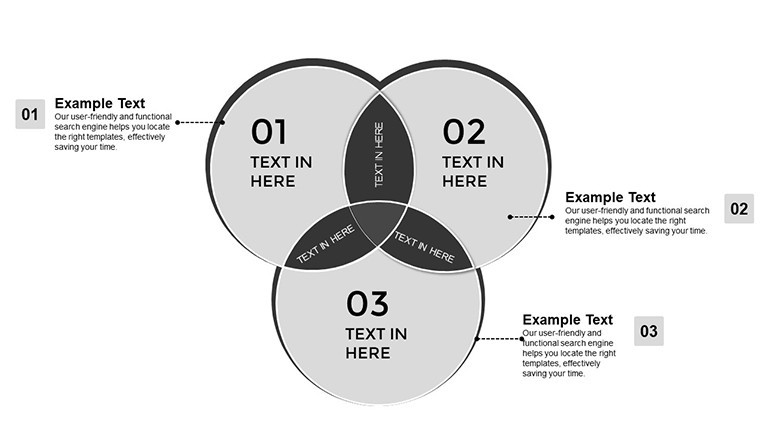
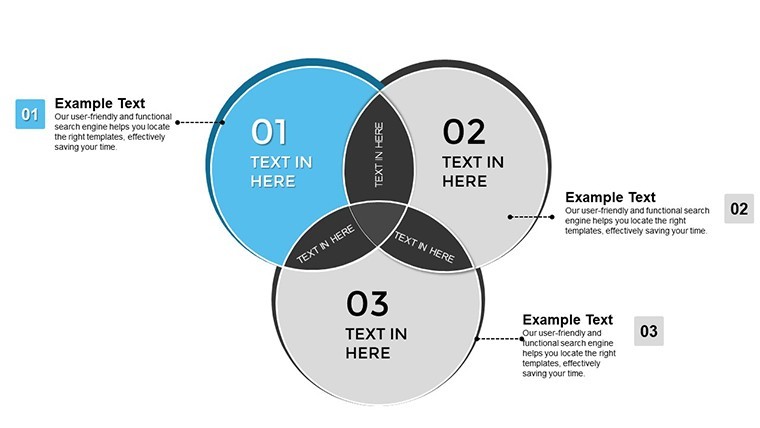
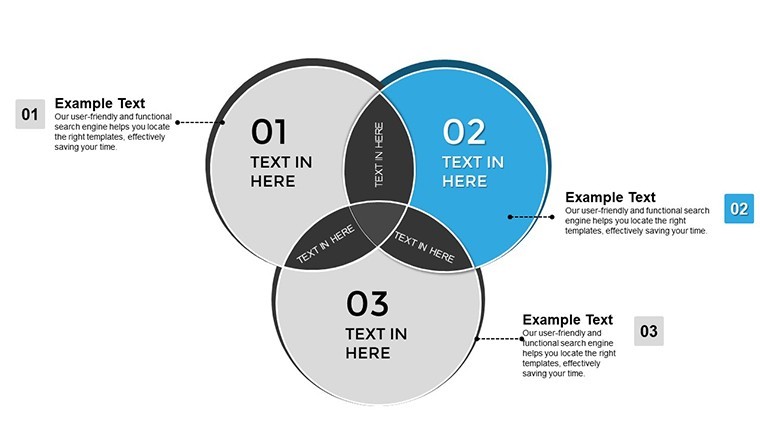
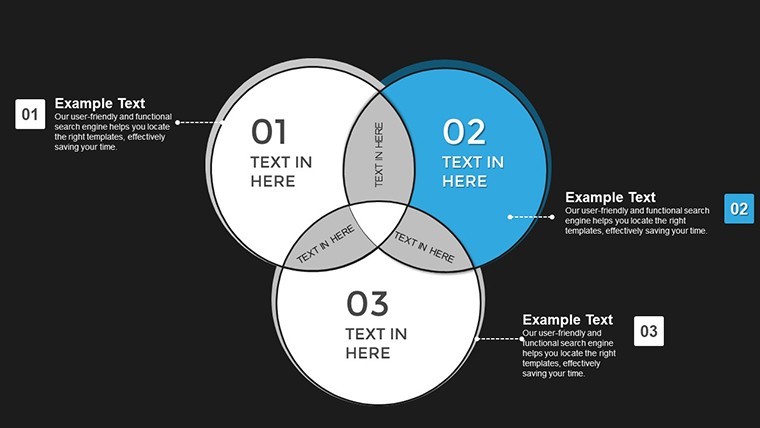
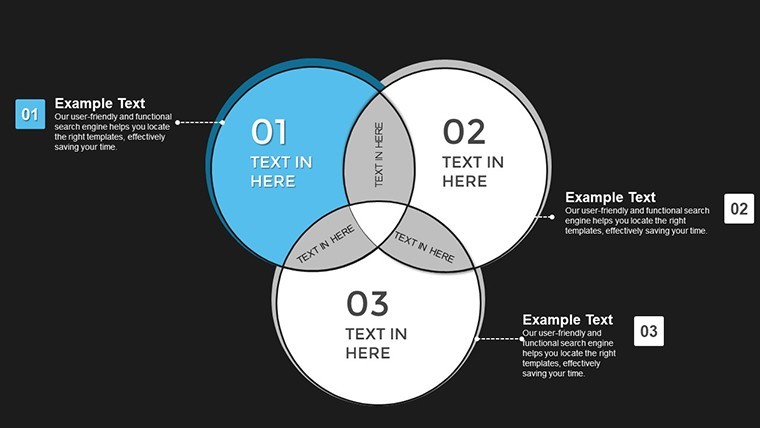
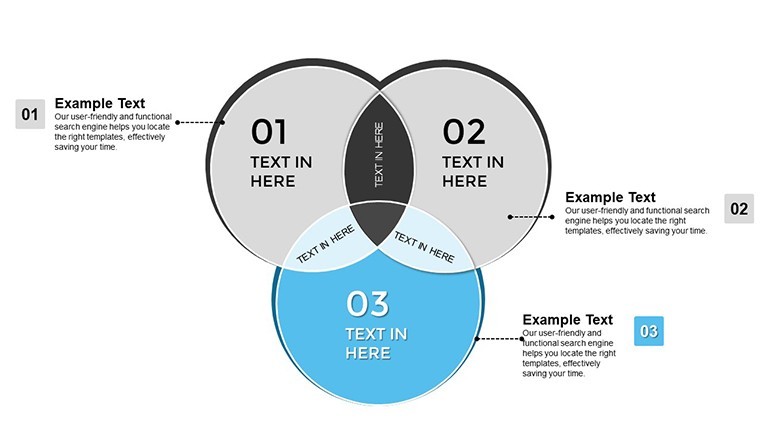
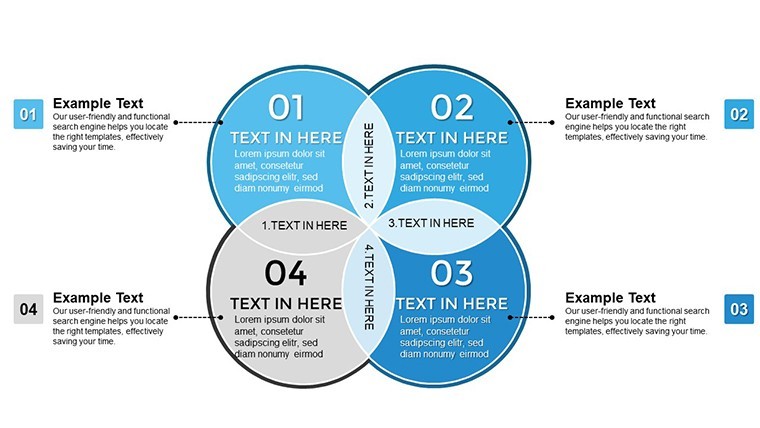
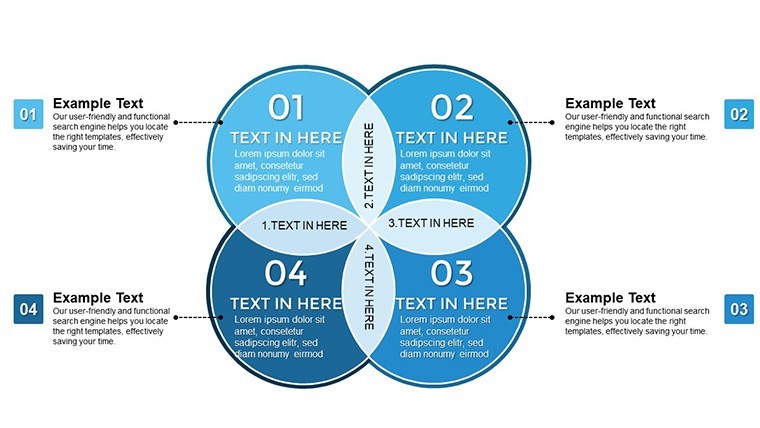
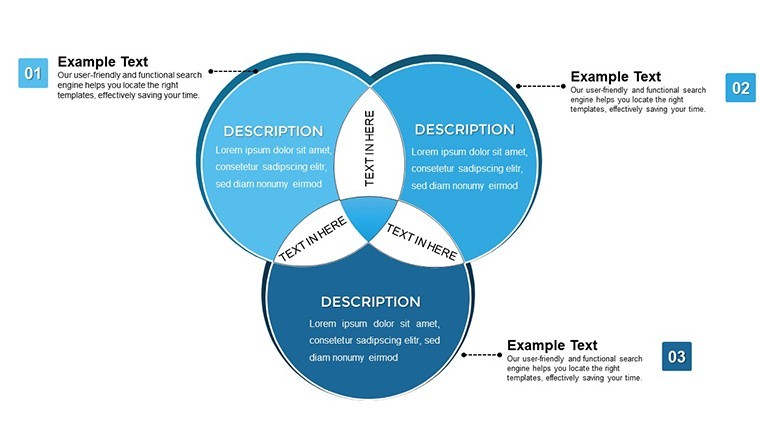
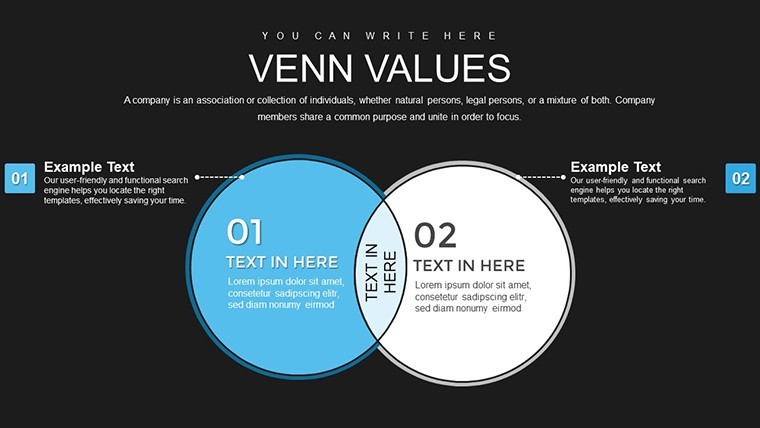
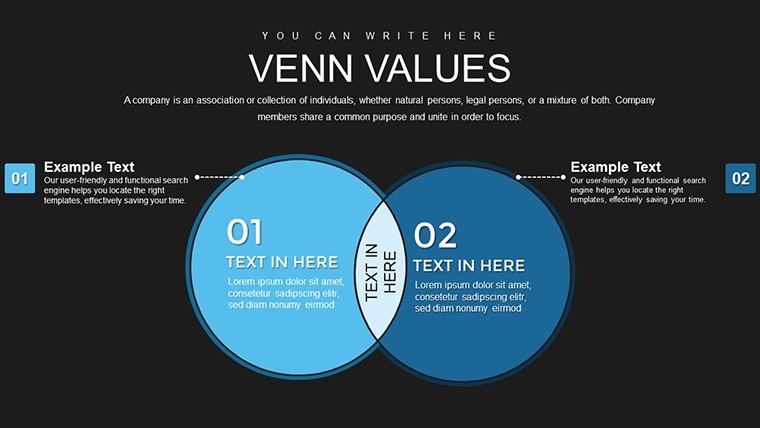
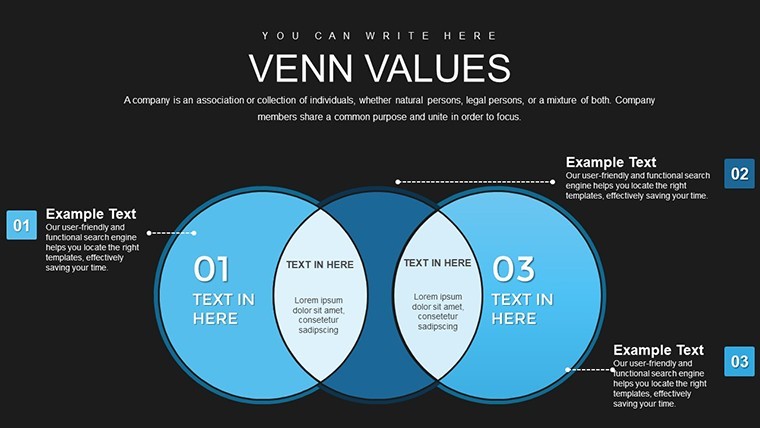
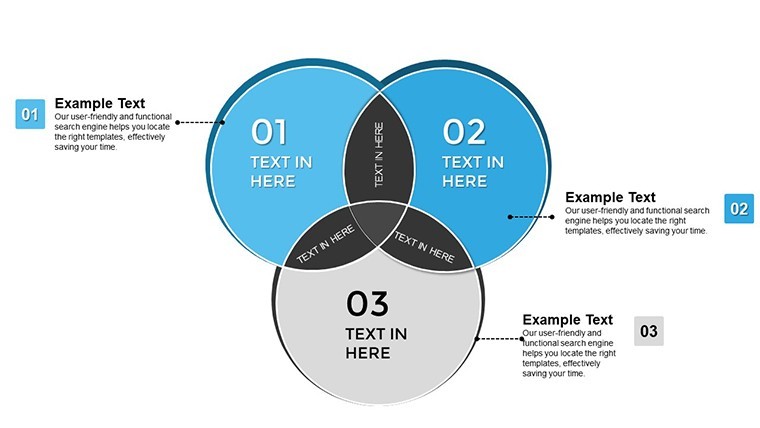
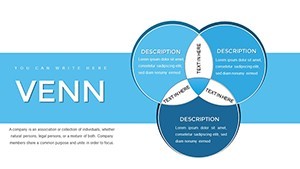
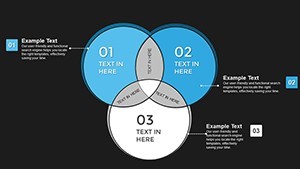
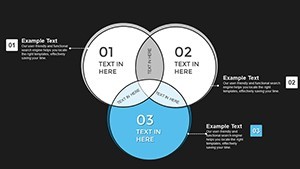
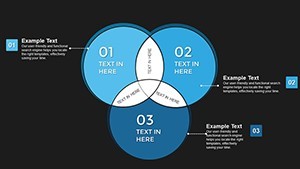
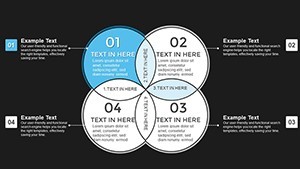
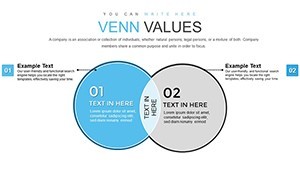
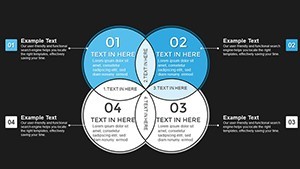
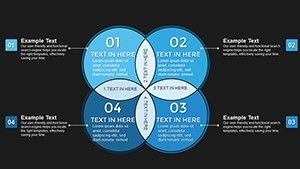
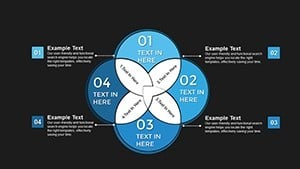
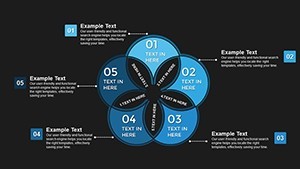
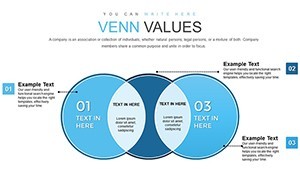
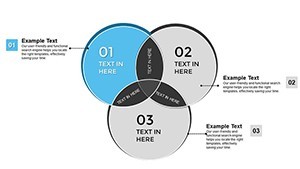
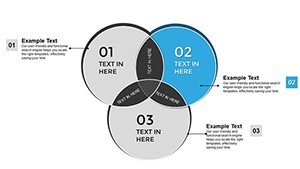
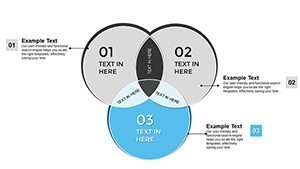
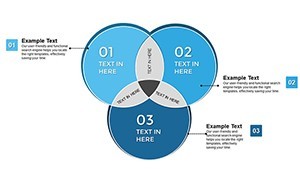
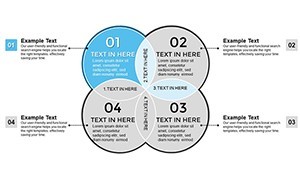
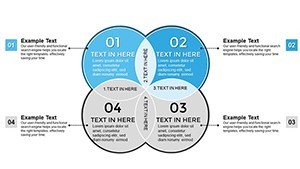
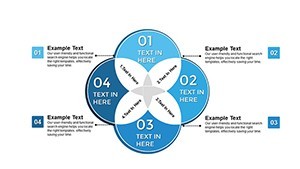
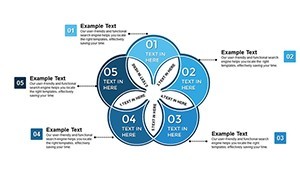
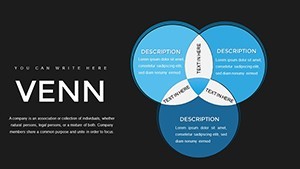
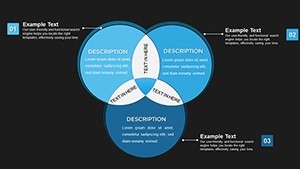
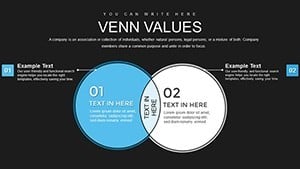
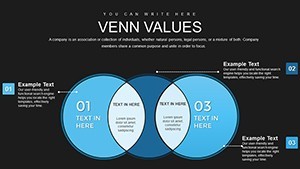
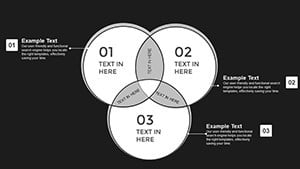
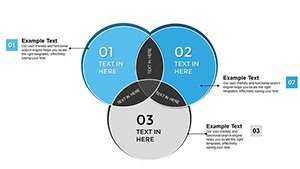
Advanced Venn Diagrams Keynote Template with 34 editable slides for relationship mapping overlaps and multi-set analysis. Flexible 2-4 set options with shadows gradients icons and color customization for marketing project management and education in Keynote. Instant download.
What's Included
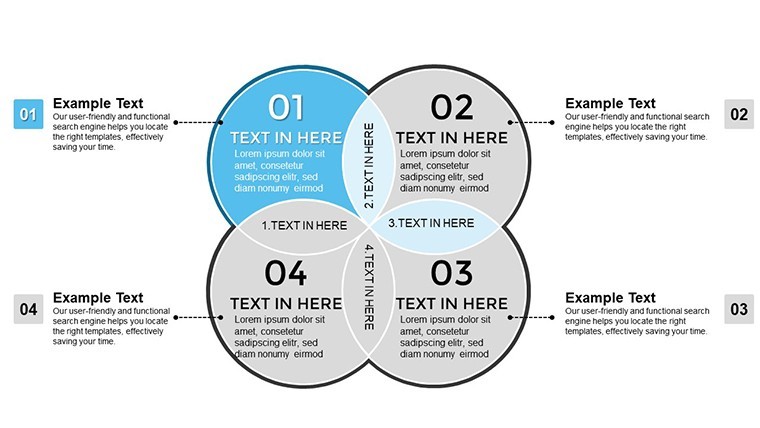
The Advanced Venn Keynote Template includes 34 fully editable slides in .key format focused on relationship mapping. Product ID KC00786 priced at $24.00 and categorized under Venn this template provides sleek graphics for shared traits unique differences and complex overlaps. It supports flexible set options from basic pairs to complex quartets enhanced graphics with shadows gradients and icons modern layouts and full color customization. The package is designed exclusively for Keynote ensuring high compatibility and professional polish for any screen size.
Core Specifications
With 34 editable slides the template allows scaling from simple to multifaceted Venn diagrams. All elements are drag-drop tweakable for minimal effort while maintaining precision.
Key Features
Verifiable features include 34 editable slides customizable Venns flexible set options up to quartets enhanced graphics with shadows gradients icons color customization pre-built schemes or custom modern layouts and easy modifications. The design follows usability principles for clarity in relationship visualization.
| Feature | Details |
|---|---|
| Slides | 34 editable |
| Set Options | 2 to 4 sets |
| Graphics | Shadows gradients icons |
| Customization | Drag drop color schemes |
| Layout | Modern adaptable |
| File | .key Keynote |
Professional Use Cases
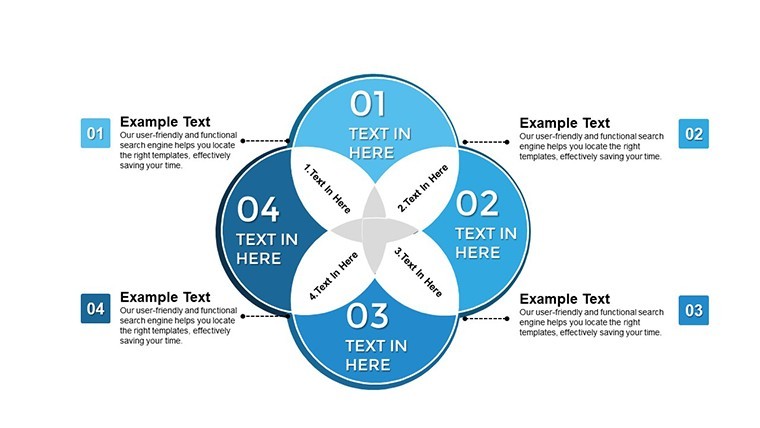
This template solves the problem of clearly mapping interconnected concepts overlaps and relationships in presentations. A marketing manager at a digital agency used the multi-set Venn slides to dissect campaign performance across channels identifying shared audience traits and unique channel strengths leading to optimized budget allocation. A project lead in construction aligned team roles and responsibilities using quartet Venn diagrams to visualize timeline resource and risk overlaps resulting in fewer scheduling conflicts. An educator in biology mapped overlapping scientific theories with the enhanced graphics for student lectures making abstract connections more tangible and improving exam scores on related topics. These scenarios leverage the 34 slides and flexible sets for precise professional outcomes.
Business Analysis
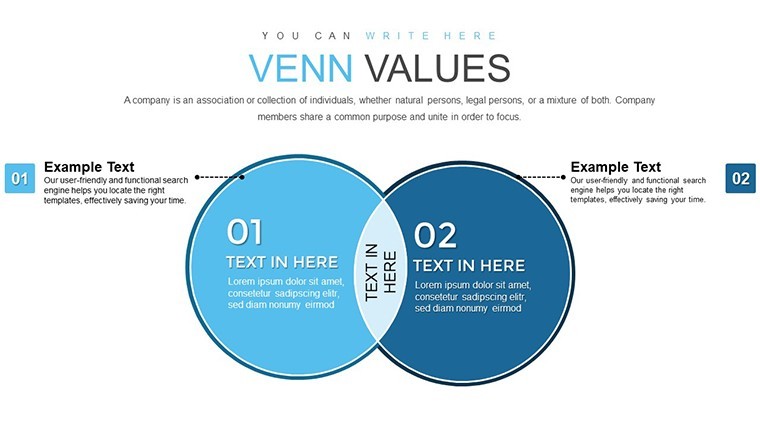
Intersect sales customer feedback operations and innovation metrics using the advanced Venn options.
Marketing Strategy
Compare audience segments across platforms with drag-drop custom sets and gradients for visual depth.
How to Customize
Import the .key file into Keynote. Choose a Venn slide and define your sets from pairs to quartets. Input data into the overlapping areas. Highlight key intersections with color or icons. Add shadows gradients for depth using built-in tools. Animate sequential reveals if needed. Tweak sizes positions or styles with drag and drop. The workflow ensures minimal effort while delivering polished relationship maps. This surpasses basic Keynote Venn tools by offering richer 34-slide options and faster results for complex visualizations.
Why Choose This Template
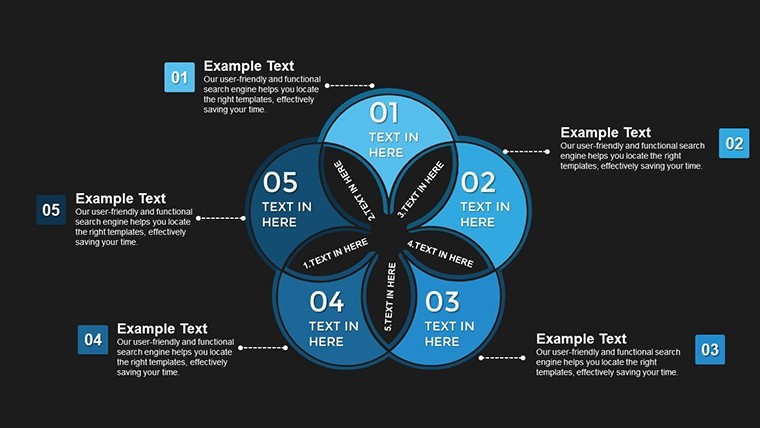
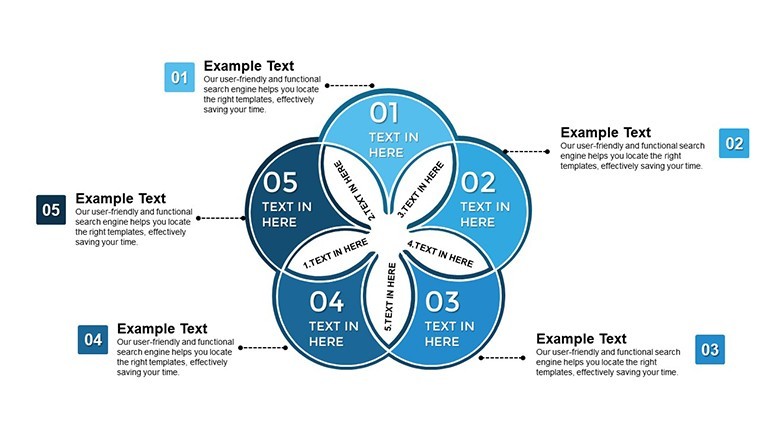
With 34 slides and advanced multi-set support up to quartets plus enhanced graphics this Venn Diagram Keynote Template exceeds simpler related options like basic 4-set or 5-set Venns that offer fewer slides or limited customization. The modern layouts and color customization were chosen to prioritize usability and brand consistency benefiting users in high-stakes presentations. Creating comparable relationship maps from scratch would require manual circle drawing overlap calculations and style testing across 34 variations taking significant time. This template provides instant professional quality differentiated by its precision mapping focus and richer feature set versus adjacent products on the site.
Map complex relationships with ease.
Download this template today.
Frequently Asked Questions
Are the Venn elements fully customizable?
Yes every shape content overlap and graphic in the 34 slides can be adjusted including sets shadows gradients icons and colors. Drag drop and tweak allows complete control from basic pairs to complex quartets while keeping the modern layout intact for any relationship mapping need in Keynote.
Is it suitable for large audience presentations?
The high-definition elements and clean modern layouts in all 34 slides scale perfectly for projections and large screens. Enhanced graphics remain sharp and readable ensuring clarity when mapping relationships to boards teams or conference audiences.
What licensing is provided?
Full editing and presentation rights are included for personal and commercial projects. Use the 34 slides in client work or internal reports as needed following standard ImagineLayout digital template terms.
Can I add animations?
Yes the template supports full Keynote animation compatibility on all Venn slides. Build sequential reveals for overlaps or sets to enhance storytelling in relationship mapping presentations.
What file is downloaded?
A single .key file with all 34 editable slides ready for Keynote. No extra assets required for immediate use in mapping relationships or overlaps.
What about refunds?
Standard digital refund policy applies if the 34-slide Venn template does not suit your needs. Preview the advanced features and use cases on the page to ensure it fits your relationship mapping requirements before purchase.