Fishbone Ishikawa Keynote Template - Editable | ImagineLayout


Type: Keynote Charts template
Category: Business Models, Analysis
Sources Available: .key
Product ID: KC00733
Template incl.: 37 editable slides
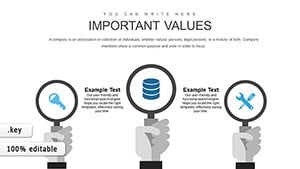
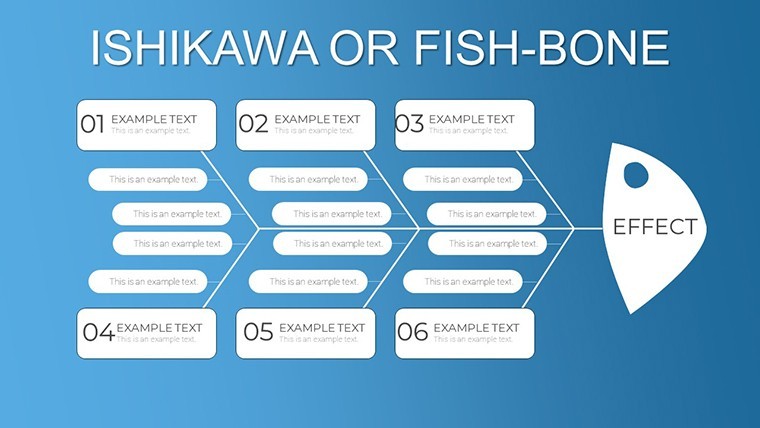
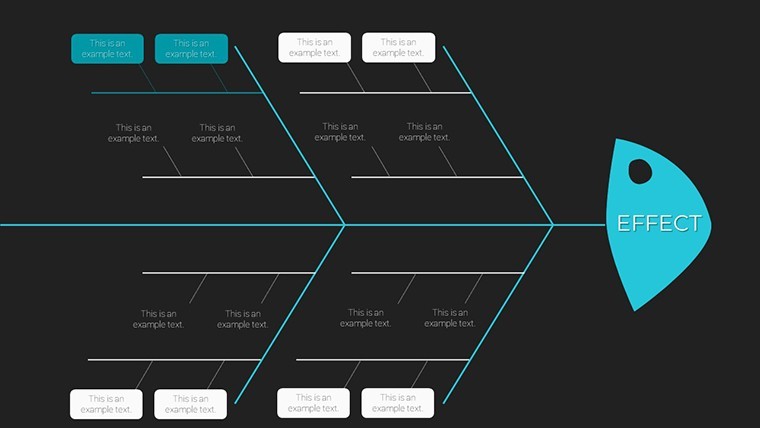
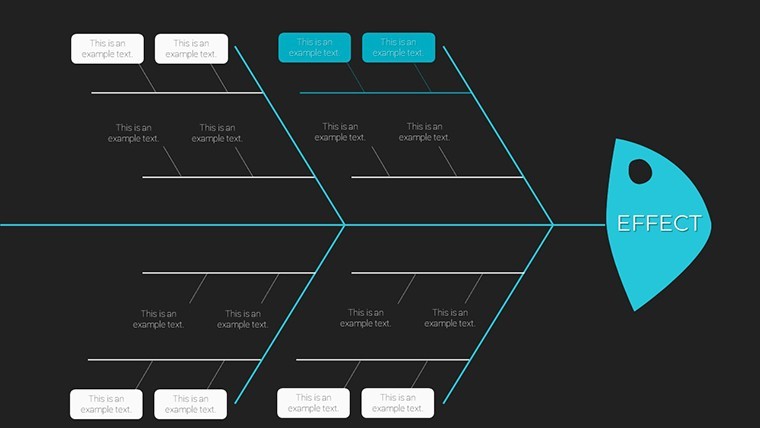
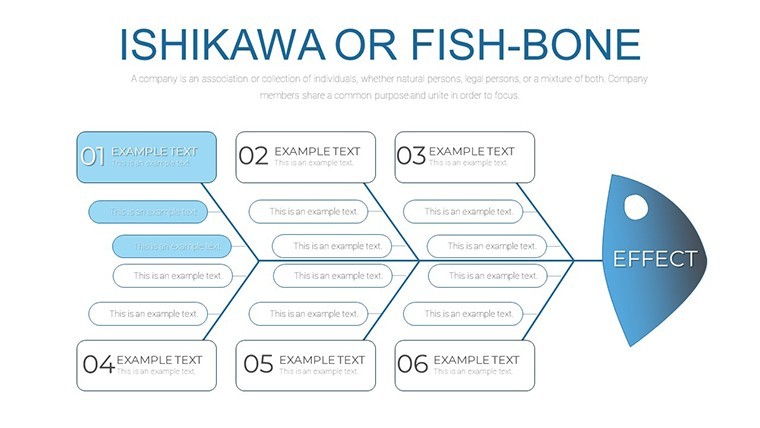
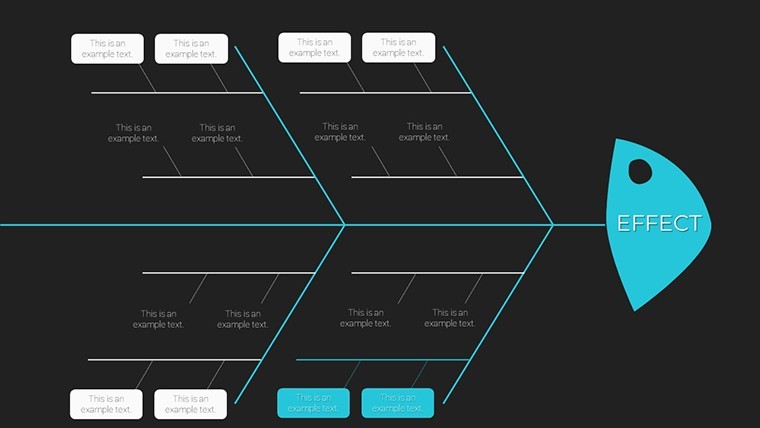
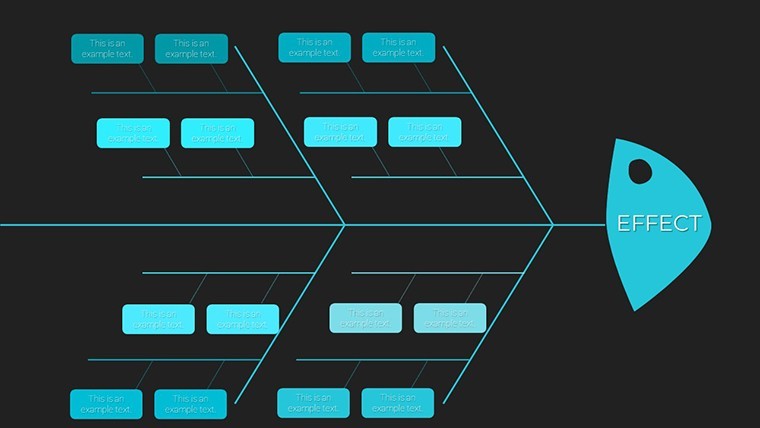
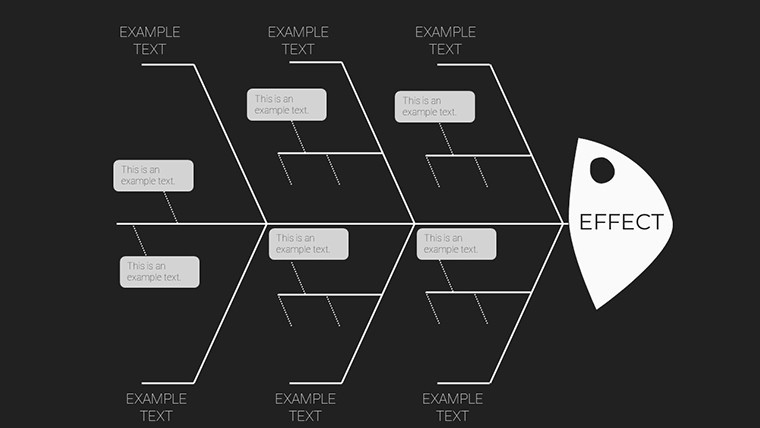
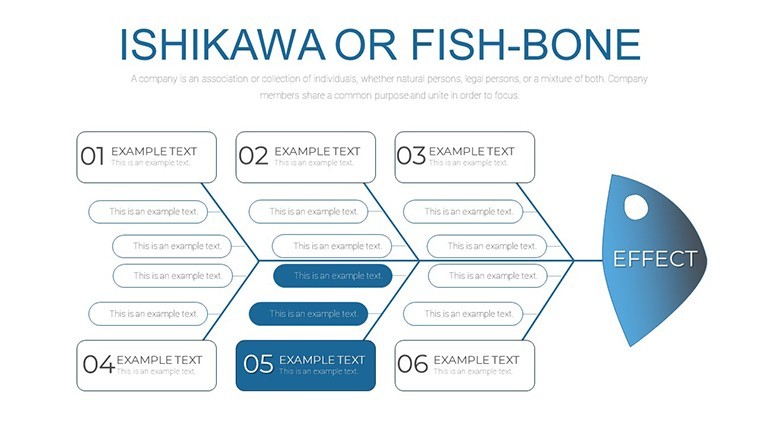
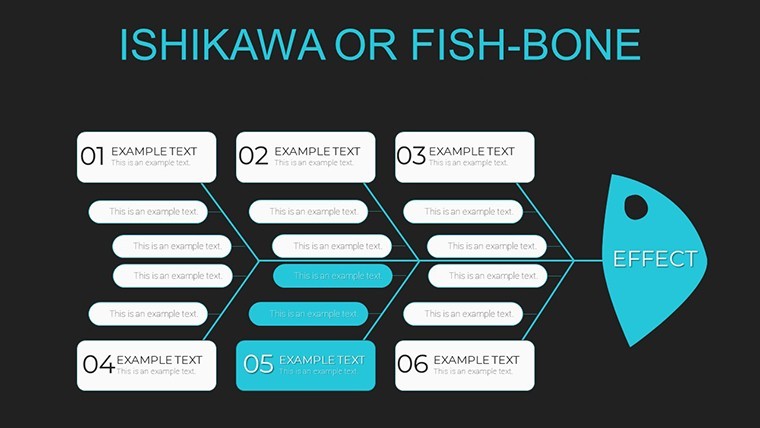
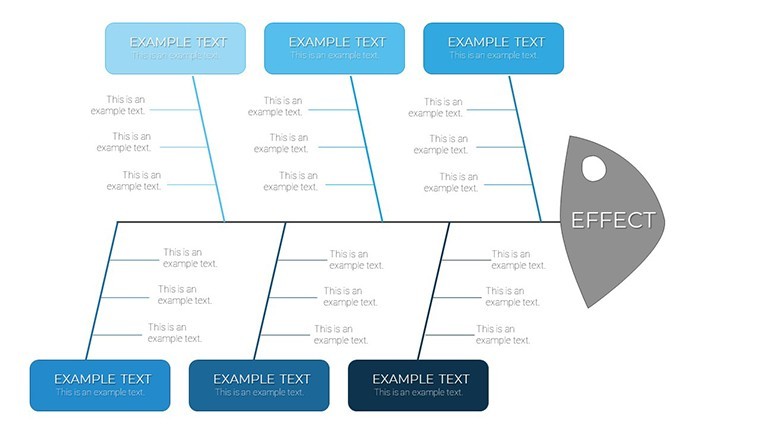
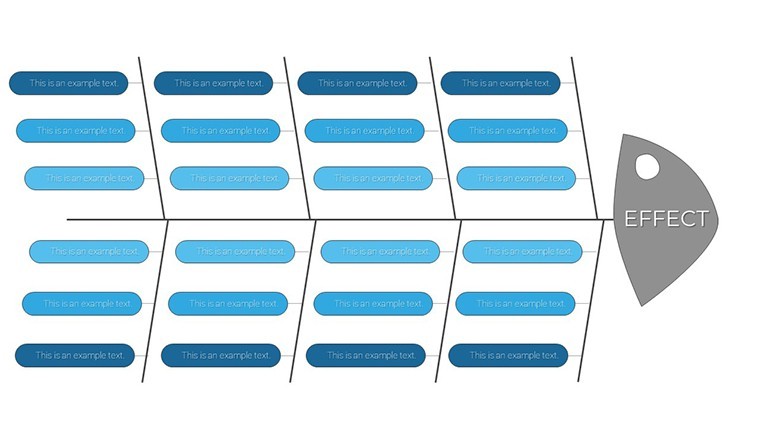
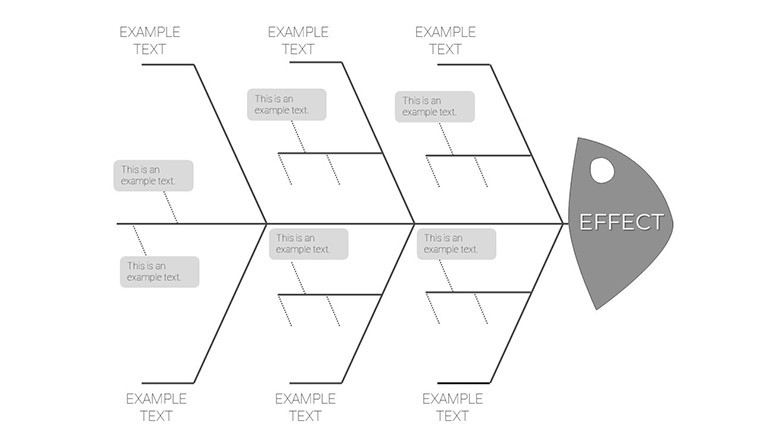
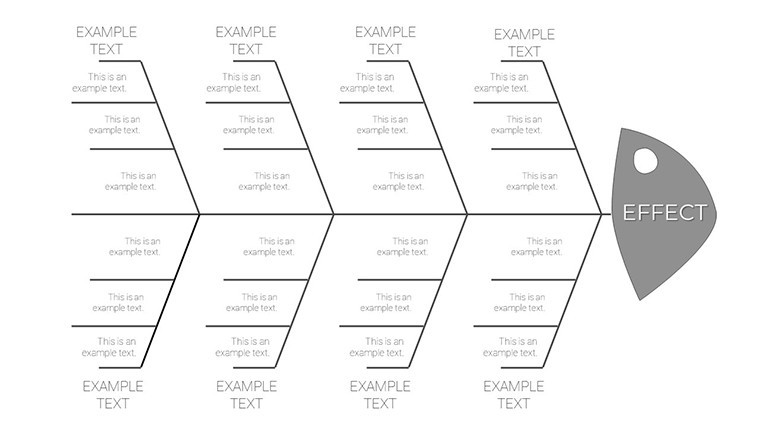
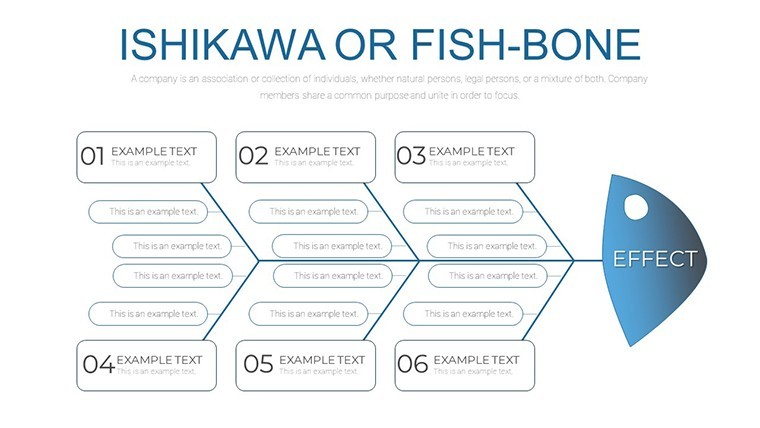
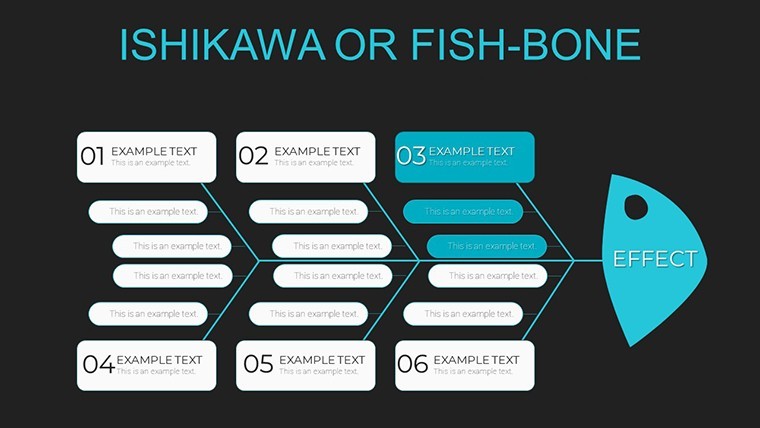
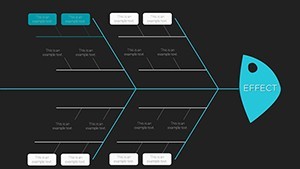
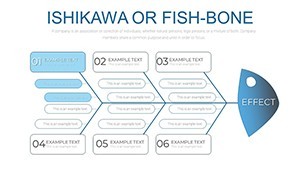
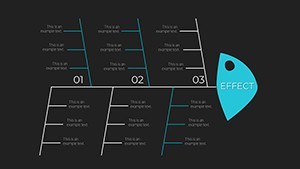
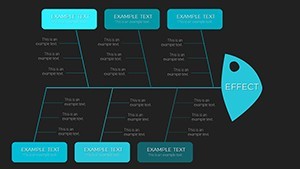
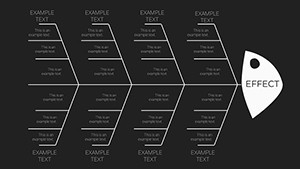
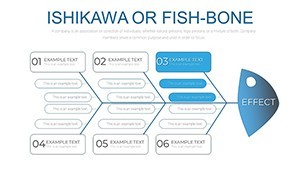
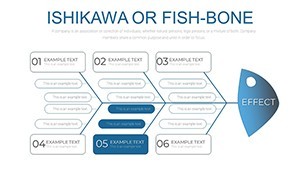
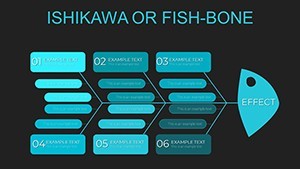
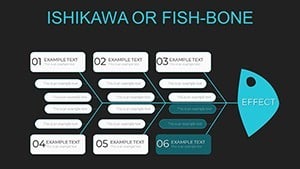
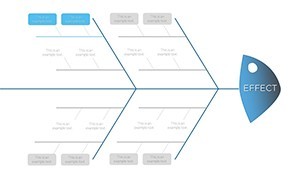
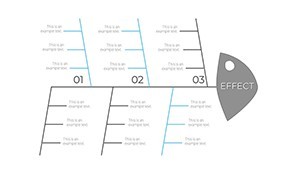
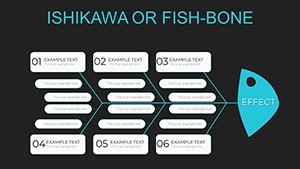
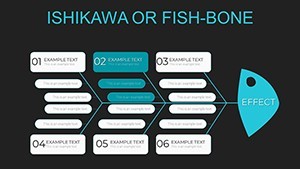
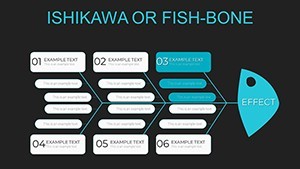
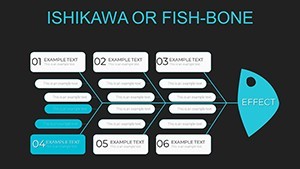
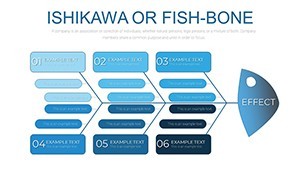
Ishikawa Cause-Effect Diagrams Ready for Analysis
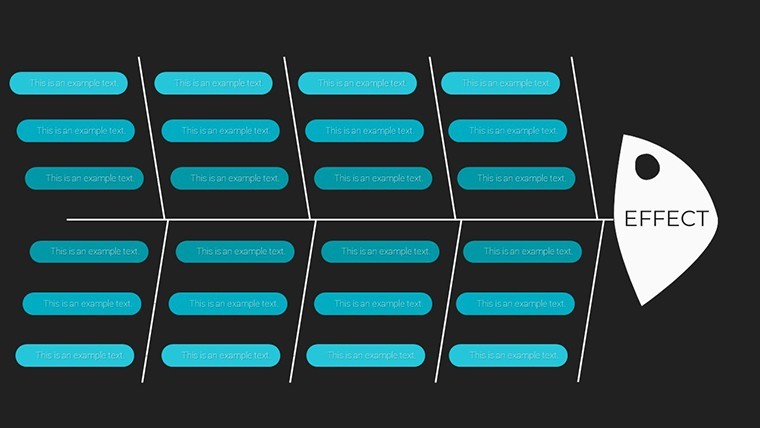
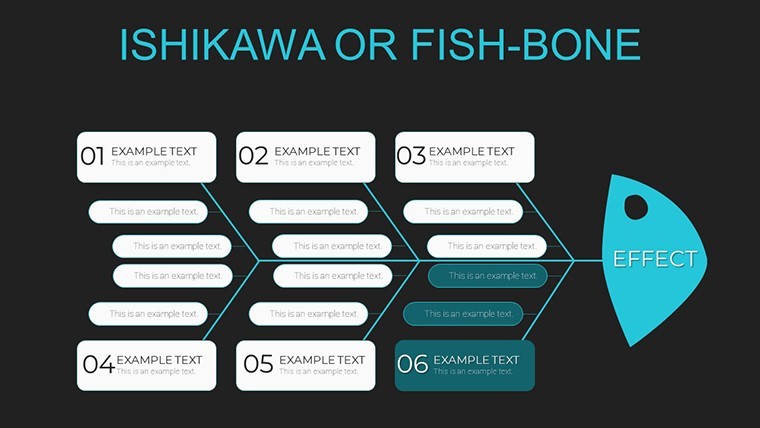
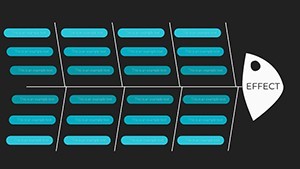
No complex layouts just structured blocks.
The KEY file packs 37 editable slides that adapt the Ishikawa methodology for cause and effect analysis in process troubleshooting or management reporting.
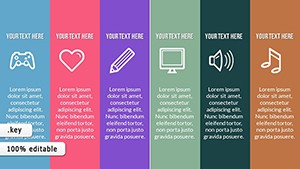
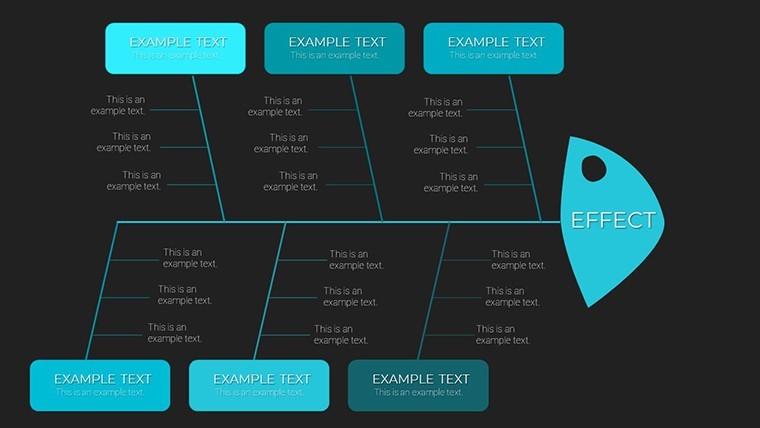
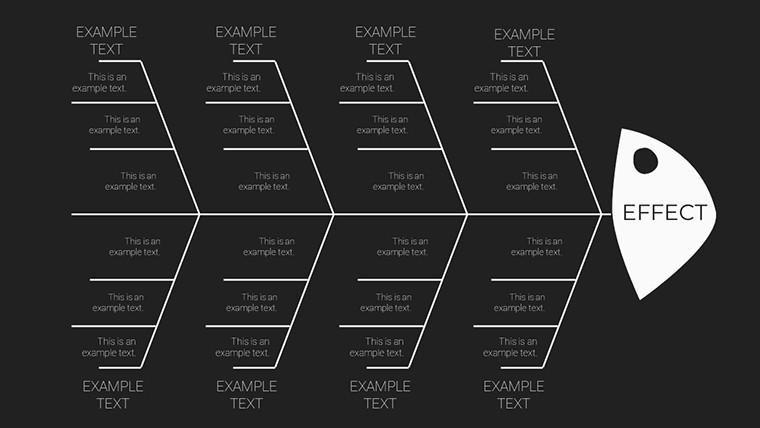
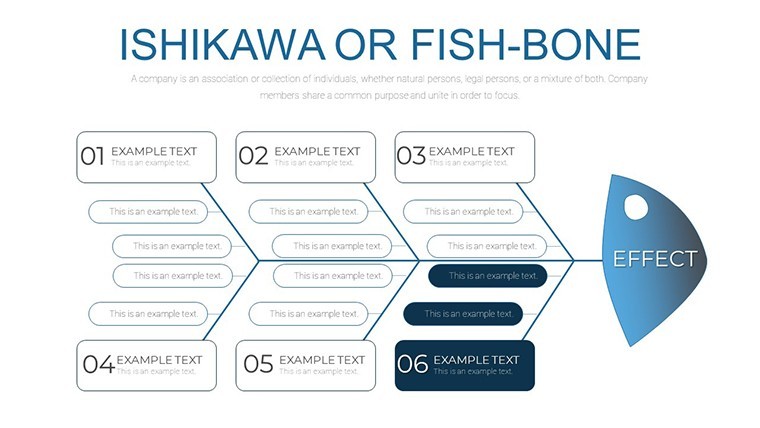
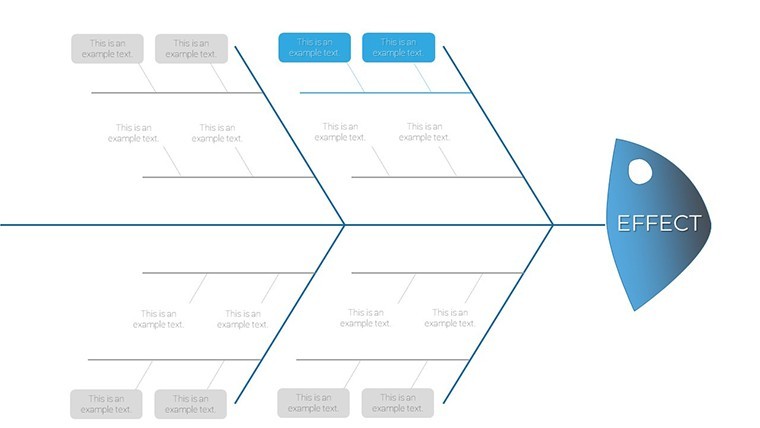
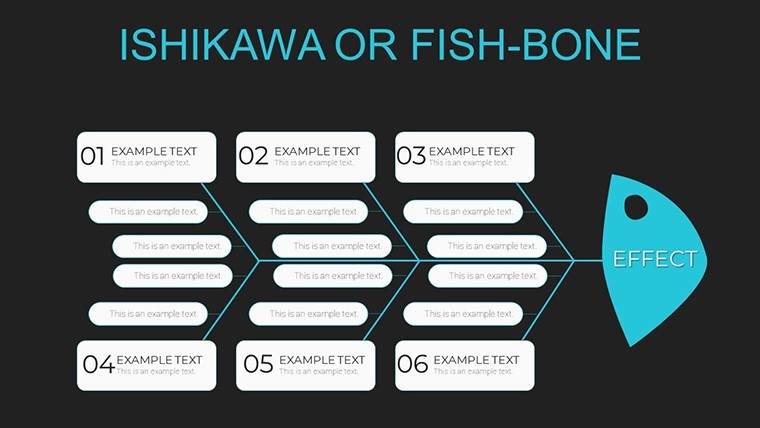
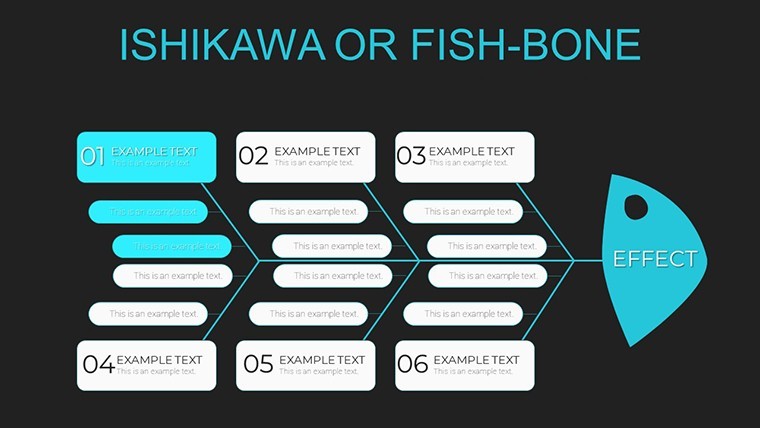
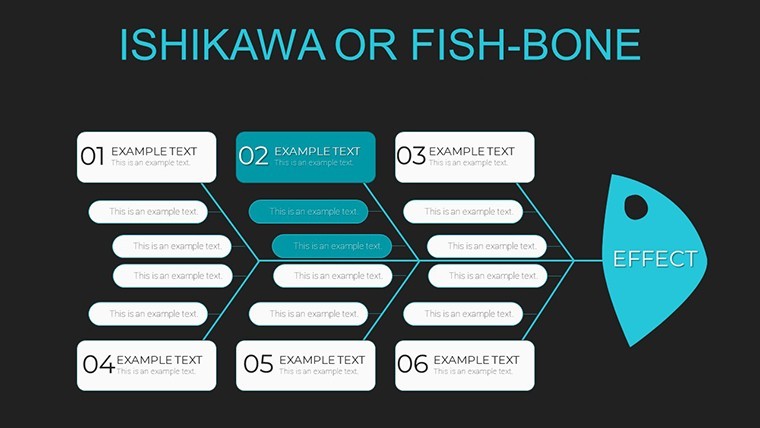
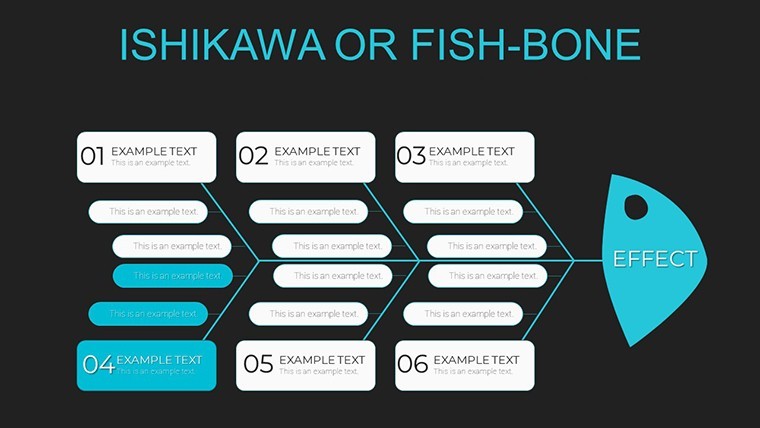
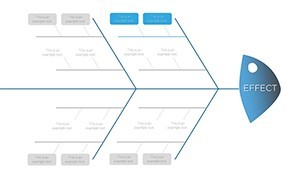
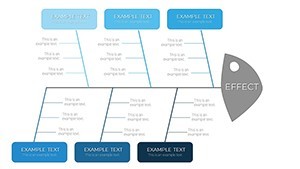
Every element is fully editable from text and colors to branch structures allowing complete customization to fit your specific analysis needs in most cases.
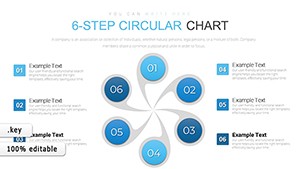
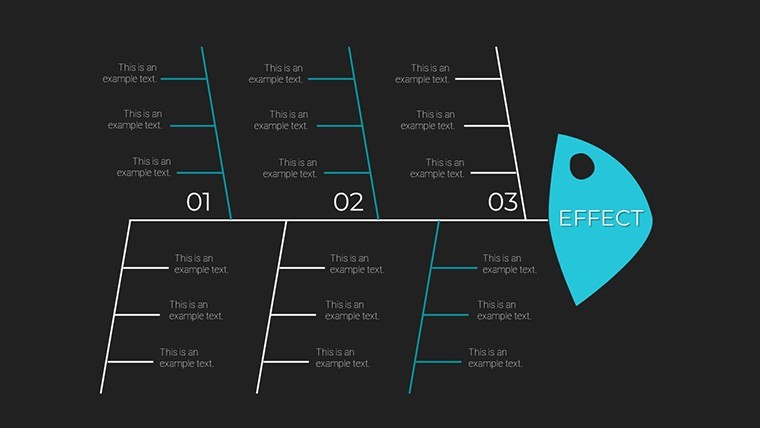
You drop in the data categories and the drag-and-drop interface handles the hierarchy instead of arranging shapes manually.
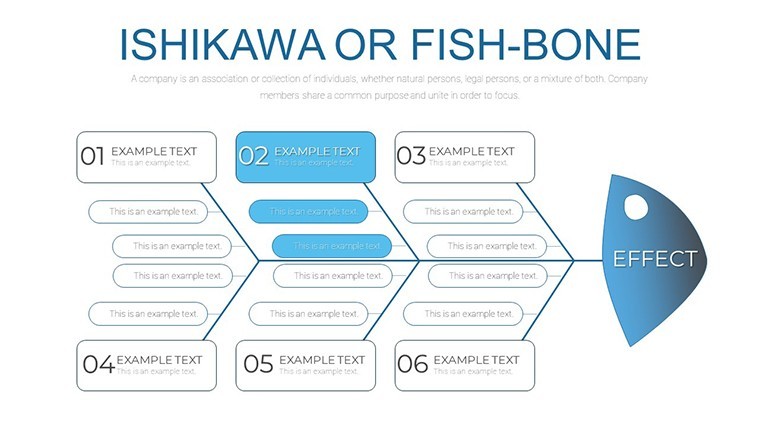
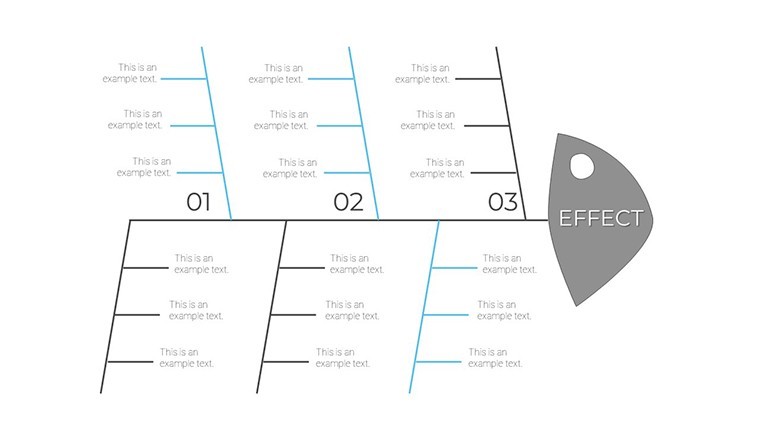
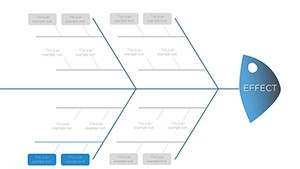
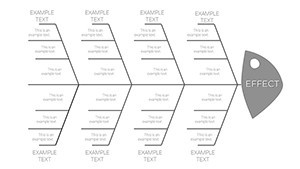
Consultants use this file when they need to show teams the relationships that are hard to explain in text alone.
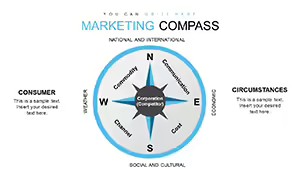
The diagram represents prioritization of causes so the viewer can decide on the most impactful fix after the presentation.
This template works best for structured diagrams and is not ideal for data-heavy dashboards.
It performs poorly when you require creative storytelling slides with loose flow.
Use this instead of building diagrams manually in Keynote.
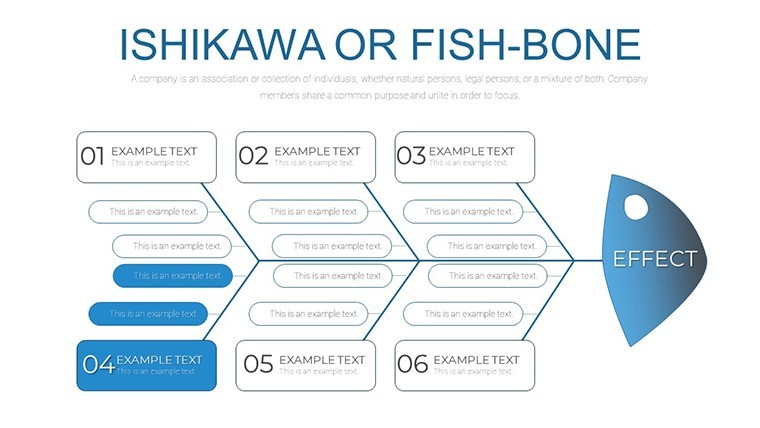
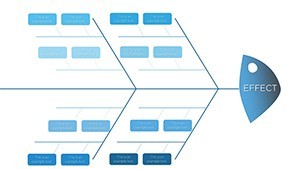
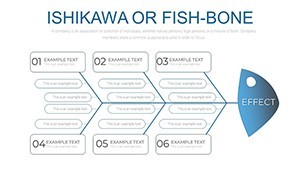
The predefined structure keeps everything aligned so you avoid adjusting spacing slide by slide.
Typically teams reuse the same diagram across weekly reports.
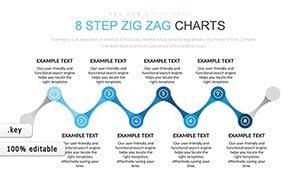
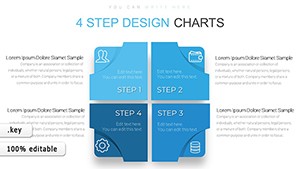
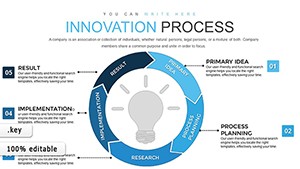
Explore the Steps to Action Campaign Keynote Charts or the Infographic Design Keynote Charts for more options.
| Feature | Details |
|---|---|
| Slides / diagrams | 37 Ishikawa fishbone diagrams |
| File format | KEY |
| Software version | Keynote 9+ compatible with Mac and iPad |
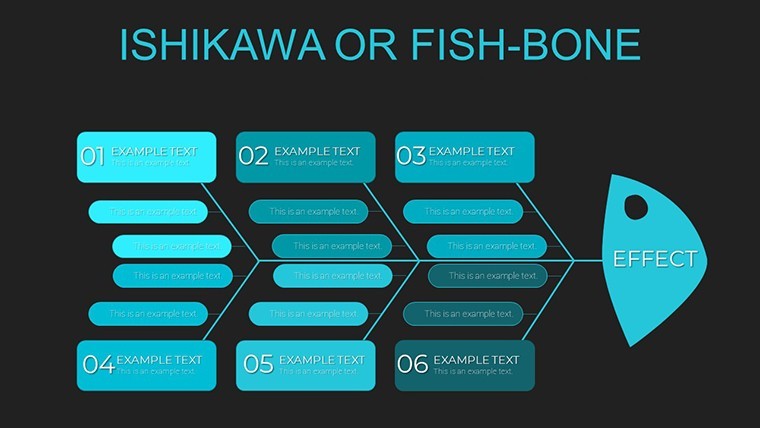
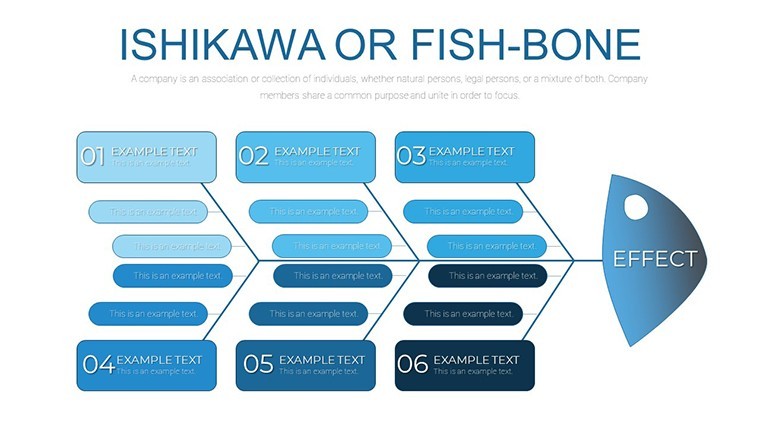
| Color schemes | Fully customizable colors updated via slide master |
| Editable elements | Drag-and-drop branches text and icons resize independently |
| Aspect ratio | 16:9 widescreen |
| Free vs Paid | Paid version includes the full 37 editable slides |
| Masters / Backgrounds | Slide master for global updates |
What Keynote versions are supported?
The template works with Keynote '09 and later versions on any macOS installation. It maintains full editability on both desktop and iPad versions of the app. You can open it directly and all animations and transitions remain functional.
How do I change colors via the slide master?
Open the file in Keynote then select View and choose Edit Master Slides. Select the shapes or text on the master slide and update fill stroke or font color in the format panel. This single change applies across every slide instantly.
Can I use this template for client work?
You can use the template for client work under the standard license terms. Modify the slides and deliver the presentation file to your clients without restriction on the output. The only condition is that you do not resell or redistribute the original template file itself to third parties.
What is the difference between free and paid versions?
The paid version includes the complete set of 37 editable slides with all branch structures and icons unlocked. No free version is listed on the page so the purchase gives you the full file immediately. You receive everything needed for immediate use upon download.
What are the refund conditions?
Refunds are available if the template does not open correctly in your Keynote version within the first 14 days. Contact the support team with your purchase receipt and details of the issue for prompt processing. Note that once the file is downloaded and used the refund window closes per standard digital policy.
You open the file and start editing.
Download and start editing immediately