Combination Lock Keynote Chart - Free Editable Keynote | ImagineLayout


Type: Keynote Charts template
Category: Free Templates, Illustrations
Sources Available: .key
Product ID: KC00641
Template incl.: 8 editable slides
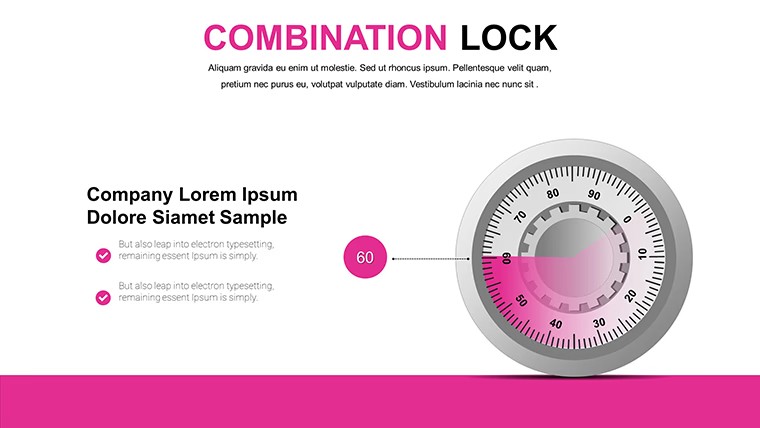
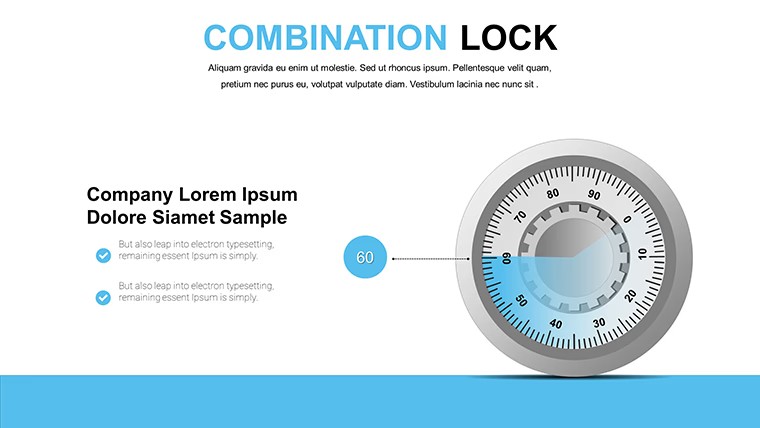
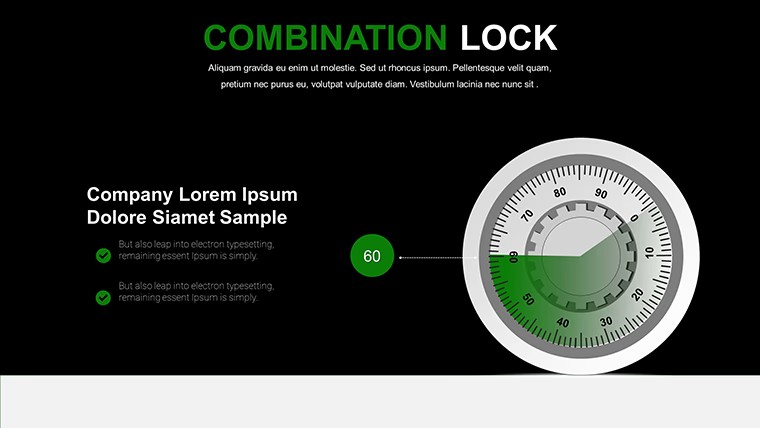
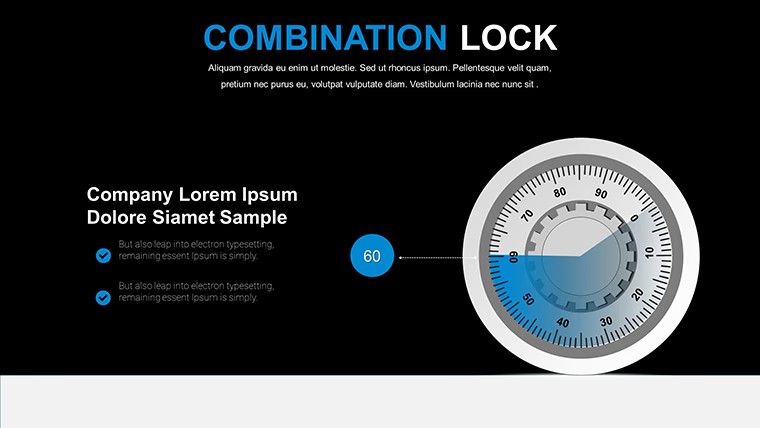
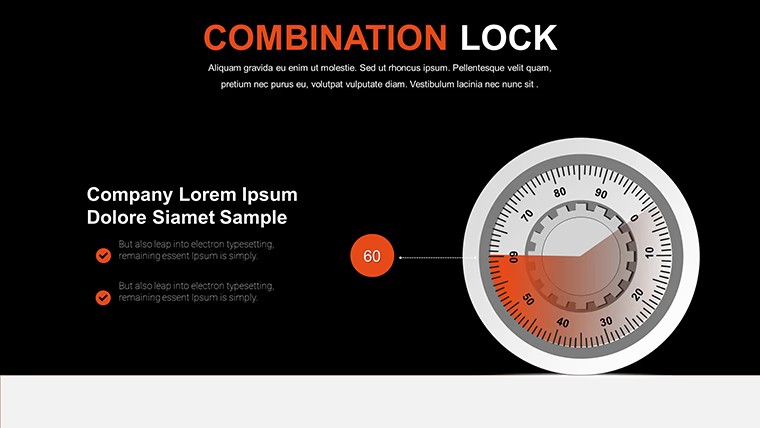
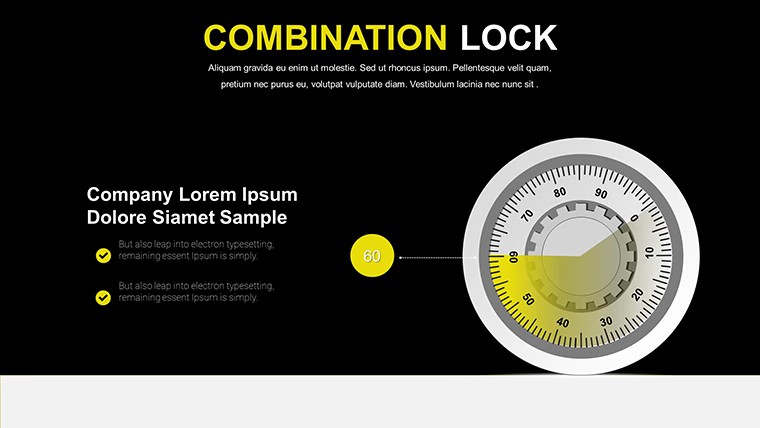
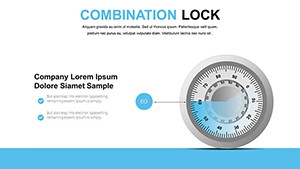
8 Free Combination Lock Illustration Slides for Keynote
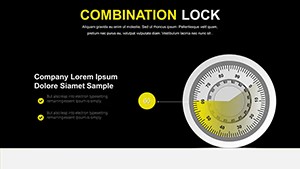
8 editable slides, free to download, in .key format - this Keynote chart file uses combination lock imagery as the visual framework for presenting layered information. Each slide pairs lock-shaped graphics with editable text areas, making the format suited to topics where precision, sequencing, or access control is the subject: security policy rollouts, compliance checklists, or multi-factor process approvals.
The illustrations are flat-style icons - lock dials, shackles, and related symbols - combined with text blocks positioned alongside or beneath each graphic. The layout is modular: individual icons and their paired text labels resize and recolor independently, so you can adjust the visual weight of each element without breaking the overall composition.
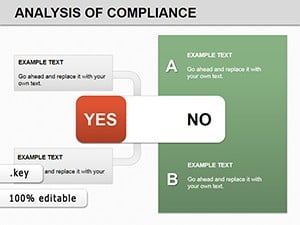
This file works when your content has a thematic need to communicate protection, control, or structured access. A security team presenting a new authentication workflow, or a compliance officer walking stakeholders through a policy approval chain, would find the metaphor functional rather than decorative. Not ideal for straightforward data charting or numerical dashboards - the lock visual carries conceptual weight, not quantitative structure.
When you need to present a multi-layer security or compliance narrative without building custom illustrations in Keynote from scratch, this file removes that step. You open it, replace the label text in each lock segment, and the slide is ready. In most cases, no layout adjustments are needed - the spacing between icon and text is already set.
No paid upgrade exists for this product. All 8 slides are available in the free download (KC00641). The file follows standard .key format, compatible with current Keynote installations; the specific minimum Keynote version is not listed on the product page, but KEY files open in Keynote 12 and later without issues on macOS and iPadOS.
Works best for structured conceptual presentations, not creative storytelling slides.
Download and start editing immediately
Specifications
| Feature | Details |
|---|---|
| Slides | 8 editable illustration slides with lock-themed graphics |
| File format | .key (Keynote) |
| Software version | Keynote 12+ (standard KEY format) |
| Color schemes | Not specified on page; flat icons recolor via Format panel |
| Editable elements | Lock icons, text labels, color fills per element |
| Aspect ratio | Not specified on page |
| Free vs Paid | Fully free - all 8 slides at no cost, no paid tier |
| Product ID | KC00641 |
Frequently Asked Questions
What Keynote version is required to open this file?
The file uses standard .key format, which opens in Keynote 12 and later versions on macOS and iPadOS. The product page does not specify an exact minimum version beyond the standard KEY format. Any current Keynote installation available through the Mac App Store will open the file without additional configuration. If you are using an older macOS version, update Keynote first to avoid compatibility issues with newer shape or animation types.
How do I recolor the lock icons to match my brand?
Click any lock icon shape to select it, then open the Format panel and navigate to the Style tab. Use the Fill color picker to apply your brand color. For flat vector icons in Keynote, the entire shape fill changes with a single color selection. To apply a consistent color across multiple icons, hold Shift and click each shape, then change the fill once - all selected shapes update simultaneously. If the icons use grouped layers, double-click the group first to select individual elements inside.
Is this file licensed for use in client or commercial presentations?
Free templates on ImagineLayout are intended for personal and commercial use, which includes presentations built for paying clients. The license does not cover redistribution of the template file itself as a downloadable product. For complete license terms, review ImagineLayout's Terms of Use at imaginelayout.com/terms/ before using the file in commercial work.
What happens if the downloaded file has a technical problem?
Since this file is free, there is no payment and no refund process applies. If the downloaded .key file is corrupted, incomplete, or fails to open in Keynote, contact ImagineLayout support via imaginelayout.com/contact-us/ and describe the issue. The support team can provide a replacement download or troubleshoot the delivery.
Does a paid version with more slides exist for this template?
This product (KC00641) is free and includes all 8 slides - there is no separate paid upgrade tier. If you need more illustration-style Keynote chart slides on security or compliance topics, browse the Illustrations category at ImagineLayout or check related paid templates such as the Compliance Analysis Keynote Charts (product /keynote_charts-template-5240/) for a larger slide set.
See more free illustration layouts in the Free Keynote Charts collection. A related paid option is the Compliance Analysis Keynote Charts.