 Click to zoom
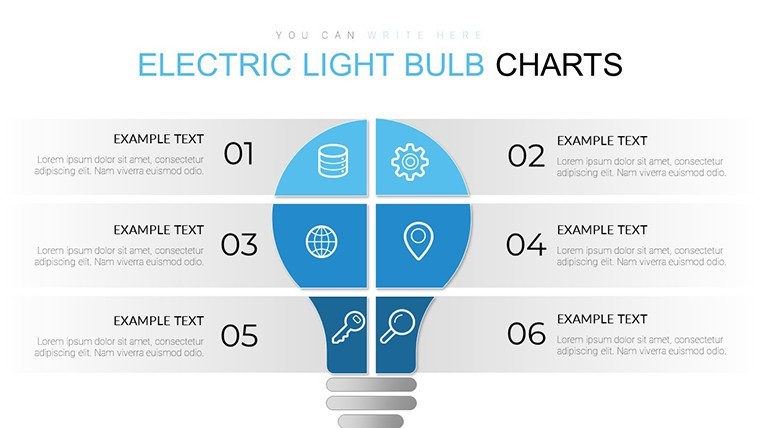
Light Bulb Keynote Charts - Fully Editable | ImagineLayout
| Format | .pptx |
| Slides | 20 unique layouts |
| Aspect ratio | 16:9 |
| Compatibility | PowerPoint |
| Animated | No |
| Language | English |
| License | Commercial |
| File size | — |
| Version | v1.0 |
| Last updated | April 2026 |
What's inside
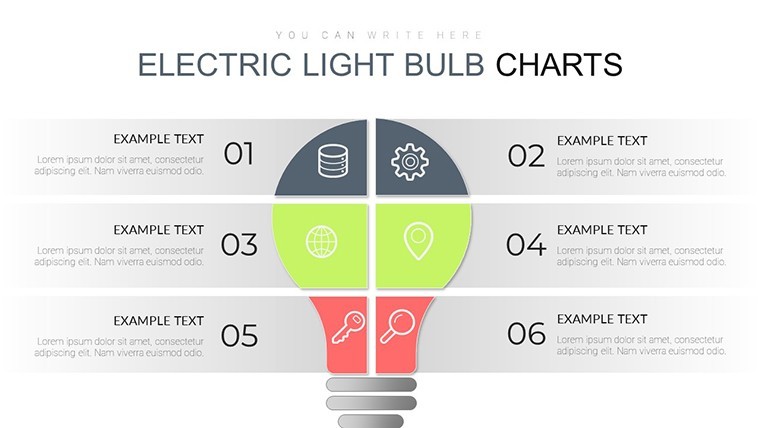
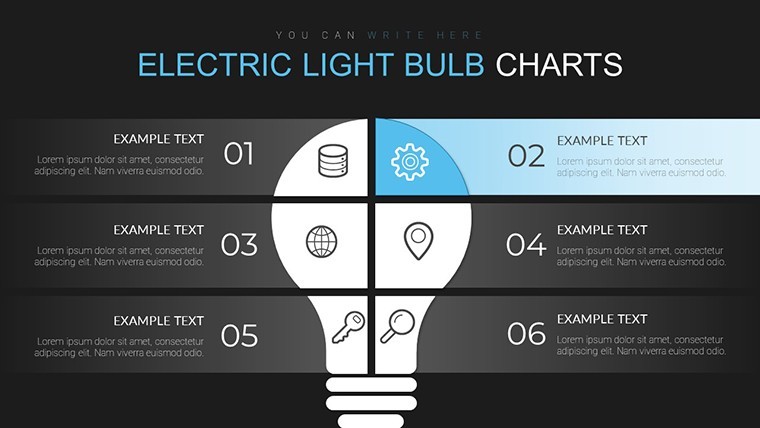
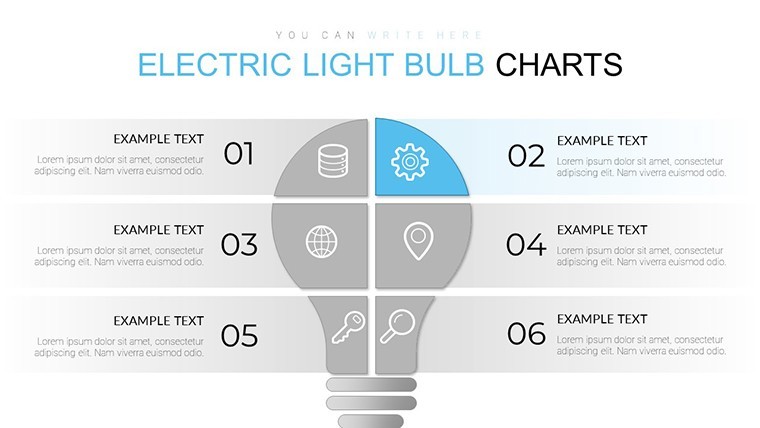
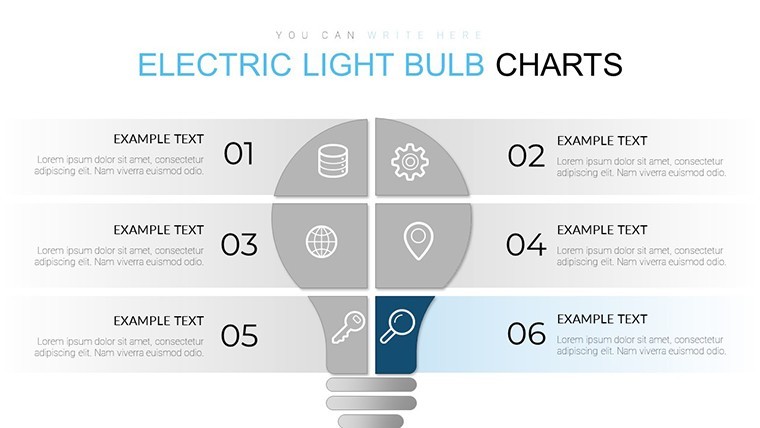
For strategy sessions where ideas need visual spark the 20 editable slides deliver light bulb matrices.
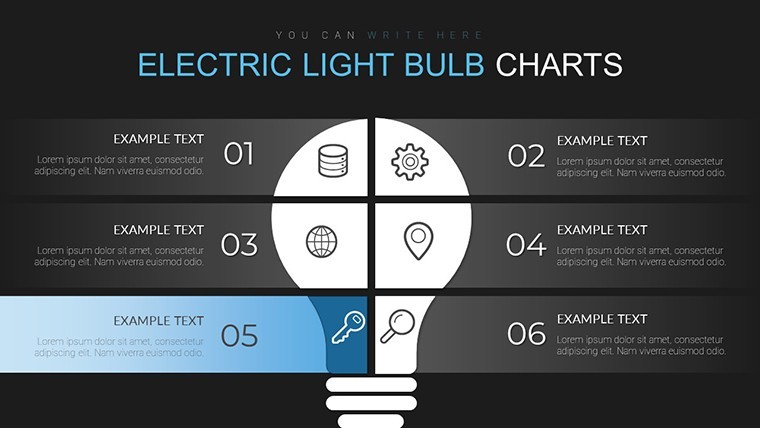
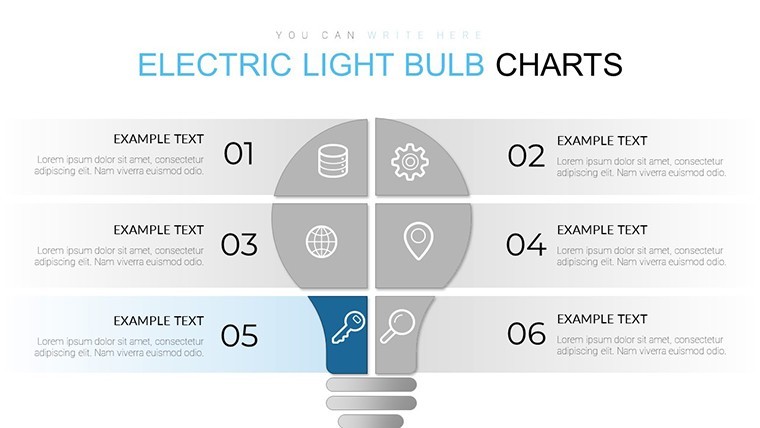
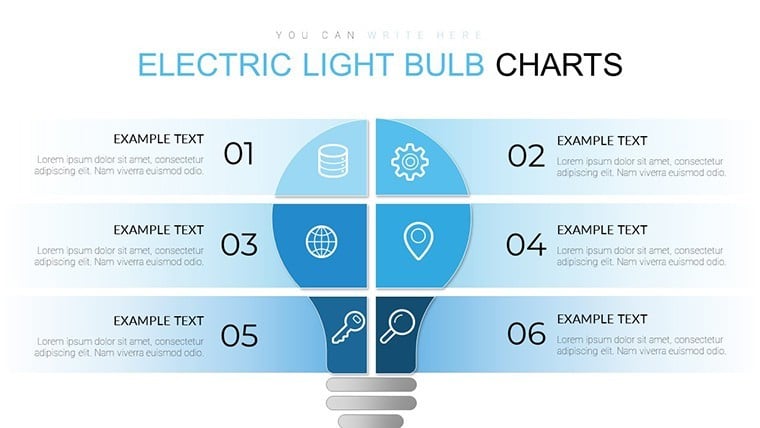
You insert concepts into the structured zones and the layout organizes comparison instantly. In practice only labels get swapped.
The paid version supplies the complete 20-slide KEY file.
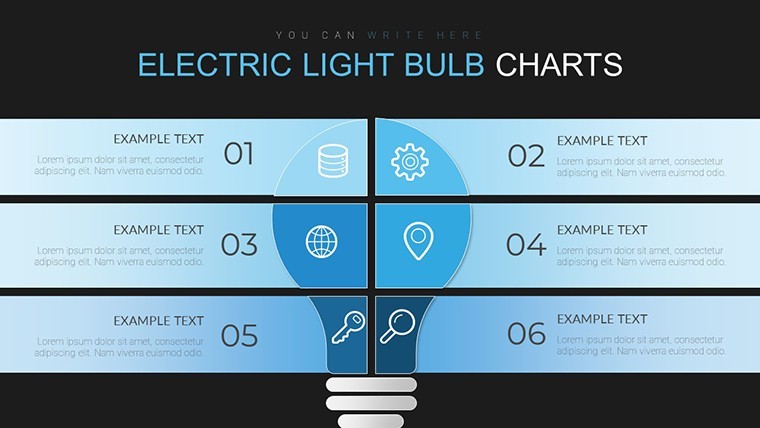
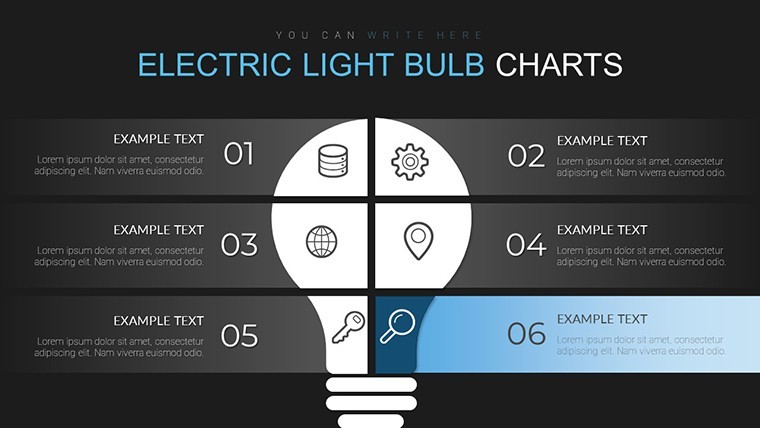
Matrix layouts integrate light bulb icons with modular spacing that keeps every idea distinct. Color adjustments occur once in the slide master and apply deck-wide.
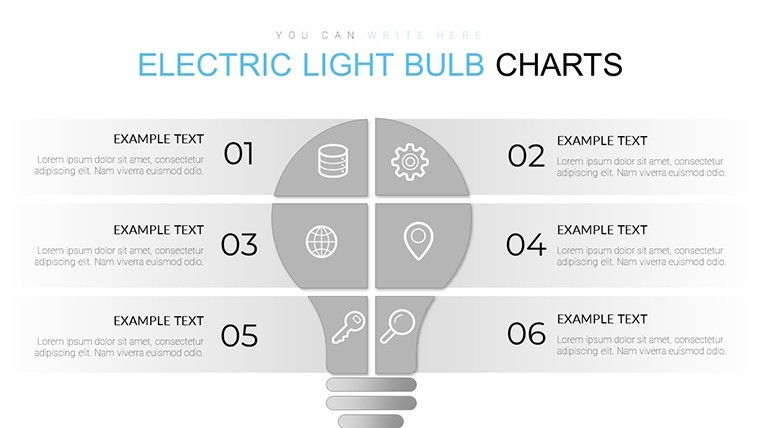
This suits innovation leads running brainstorming workshops. When you need to compare multiple options without arranging icons manually the matrix structure handles the organization out of the box.
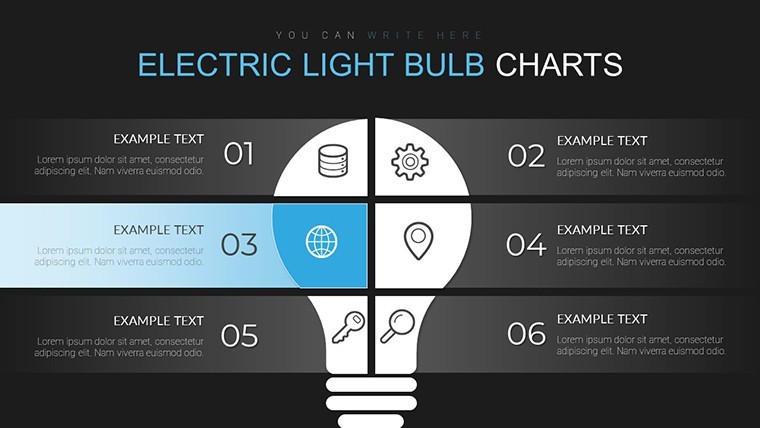
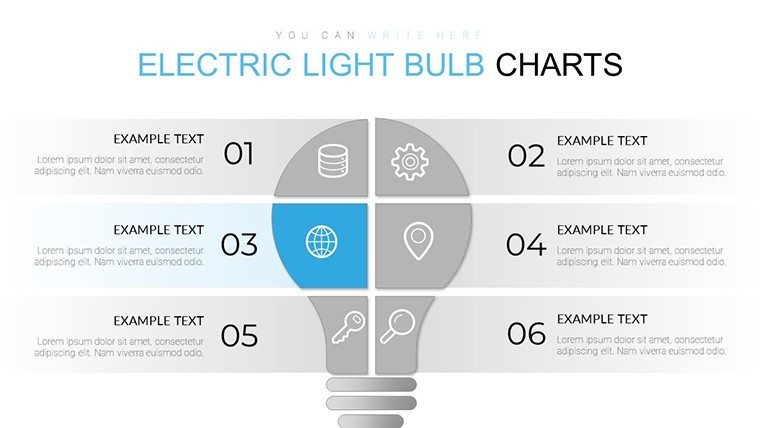
Idea mapping supports prioritization because the grid forces side-by-side evaluation. Viewers see relationships and gaps immediately and reach selection decisions with confidence.
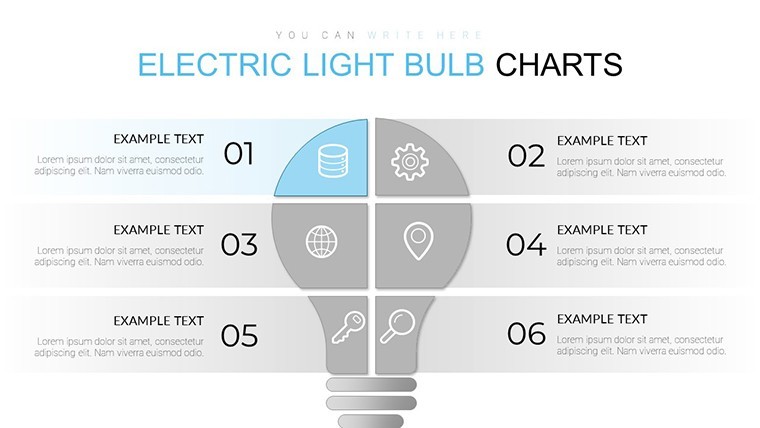
Use this when you need to show innovation pipelines without rebuilding matrices in Keynote. The fixed grid prevents misalignment so viewers follow logic without distraction.
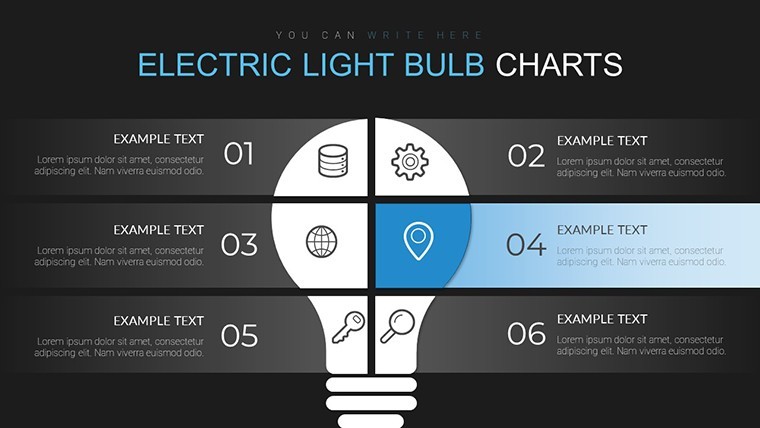
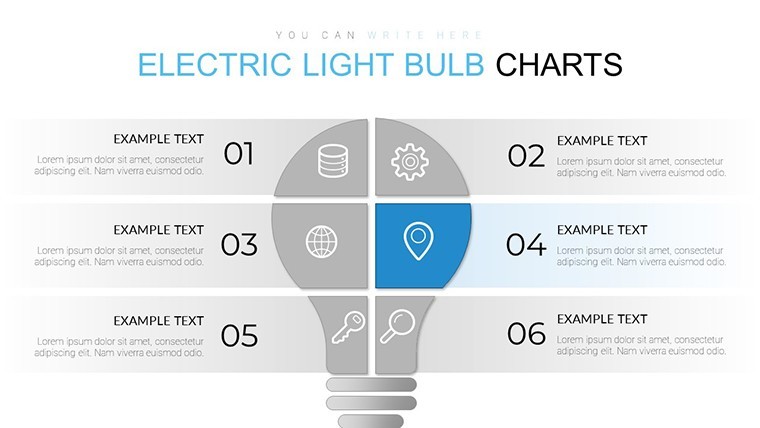
Works well for structured comparison. It is not suited for data-heavy dashboards or purely textual summary slides.
You can duplicate slides and reuse the same structure.
FeatureDetailsSlides / diagrams20 matrix chart layoutsFile formatKEYSoftware versionKeynote 12+ (standard KEY format compatible with current installations)Color schemesSwitch via slide master in one clickEditable elementsText, bulb icons and grid cells resize independentlyAspect ratio16:9Free vs PaidPaid includes full 20 editable slidesMasters / BackgroundsStandard master slides for theme updatesEverything is already structured.
Download and start editing immediately
How do I change colors via slide master?Changing colors starts with opening the slide master view in Keynote. Update the theme palette once and all 20 matrix slides reflect the change instantly across every light bulb icon. This approach saves hours when you need consistent branding for multiple innovation workshops in practice.
Does the license allow client work?The license allows use for client work after purchase. You can customize the charts and deliver them in presentations for paying clients without additional fees. Standard terms apply with attribution not required for end use.
What is the difference between free and paid?The paid version includes the complete 20 editable slides ready for immediate use while any free preview may show only sample diagrams. Full access comes with the purchase to unlock all matrix variations. You get the KEY file without watermarks or restrictions.
What are the refund conditions?Refunds are available within 14 days if the file does not open in your Keynote installation. Contact support with the order details for processing. No refunds after successful download and use of the template.
Which Keynote version and macOS is required?The template works in Keynote 12 and newer versions on macOS. It requires macOS Ventura or later for full compatibility with latest features. Older versions may need file conversion but the structure remains intact.
See also Chemical Charts Keynote Template for Science Presentations or Light Bulb Keynote Charts: Illuminate Your Ideas with Style for related idea visuals.
Good for
- Project roadmaps and sprint plans
- Product launch timelines
- Quarterly or annual review decks
- Company history and milestone summaries
Licence
reviews
The comparison layouts were useful.
Good template for data presentations.
The charts were clear without too much decoration.
Some pages felt a bit old fashioned.
Easy enough to customize for meetings.
FAQ
Will it work in Google Slides?
Are fonts embedded?
Can I use this for client work?
What's the refund policy?
Do you update the template after purchase?
Similar templates
See all Keynote Charts →

All 20 slides