Flat icons of renewable tech define the 28 diagrams.
Gear symbols and battery icons sit inside vertical flowcharts on a precise grid. The paid version supplies every layout and scheme without restrictions while the page lists no free option.
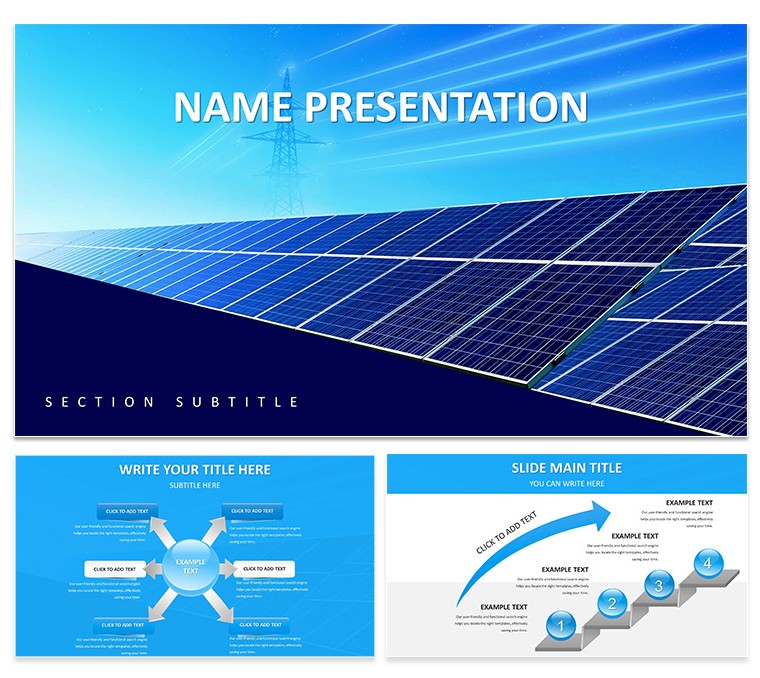
This Keynote diagram template gives renewable energy analysts instant access to 28 diagrams and 7 color schemes. Edit text once and the entire deck stays consistent.
Pie charts use thin 2pt strokes. Timelines align to a 12-column structure.
Color switches take one click. The master slide handles it.
Technology consultants preparing innovation reports rely on this set. All elements stay vector and fully scalable.
Open the master to change hues across seven schemes. Icons recolor independently while text placeholders expand without breaking alignment. The design supports quick PDF export or video recording.
28 diagrams cover data structures tailored to renewable technologies. The .KEY file runs in Keynote 12+ on macOS 11 or later.
Specifications
| Feature | Details |
|---|
| Slides / diagrams | 28 vector diagrams including pie charts, flowcharts and timelines |
| File format | .KEY / .KTH |
| Software version | Keynote 12+ |
| Color schemes | 7 schemes switched instantly by editing one master slide |
| Editable elements | Icons resize and recolor independently; text placeholders scale without distortion |
| Aspect ratio | 16:9 |
| Free vs Paid | Paid version contains full 28 diagrams and all 7 schemes; no free version listed |
| Masters / Backgrounds | Single master slide controls all 28 diagrams |
See also Energy - Power Keynote Theme and Solar and Wind Power Keynote Template for more options.
Download and start editing immediately
Which Keynote version and macOS does the template require?
The template works in Keynote 12 and newer. It requires macOS 11 Big Sur or later for full compatibility. Older versions may open the file but master slide updates or vector scaling could behave differently.
How do I change colors via slide master?
Open the template in Keynote 12+. Go to View > Edit Master Slides, select the master, and update the color palette. All 28 diagrams and 7 schemes update automatically. This takes under one minute and maintains perfect consistency across every slide.
Can I use this template for client work?
The license allows client work. You can deliver the final edited presentation to clients. You cannot resell or redistribute the original .KEY file itself. One license covers one user or project team.
What is the difference between free and paid versions?
The paid version includes the complete .KEY file with all 28 diagrams and 7 color schemes. No free version appears on the page. The paid option gives immediate full access without watermarks or missing elements.
What are the refund conditions?
You can request a refund within 30 days if the template does not meet your needs. Contact support with your order number. Refunds are not issued after the file has been downloaded and opened in Keynote.