Europe PowerPoint Maps
Presenting European data has never been easier. Our comprehensive library of Europe map templates for PowerPoint gives you instant access to professionally designed graphics that transform complex regional information into clear, compelling visuals your audience will understand and remember.
From country-level analysis to continent-wide overviews, these templates are built for professionals who need presentation-ready maps without the time investment of creating them from scratch. Every template is fully customizable in PowerPoint, allowing you to adjust colors, highlight specific regions, add data overlays, and create the exact visual your message requires.
 (702)
(702) Russia PowerPoint Maps Template: Precision for Every PresentationID: #PM00203$55.00
 (415)
(415) Jamaica Keynote Maps: Download Maps of Jamaica TemplateID: #PM00202$50.00
 (651)
(651) Unlock Portugal's Geographic Charm with Our Customizable PowerPoint Map TemplateID: #PM00194$53.00
 (101)
(101) Elevate Insights with the Pro Ukraine PowerPoint Maps TemplateID: #PM00193$45.00
 (462)
Norway PowerPoint Maps Template: Download PPTID: #PM00191$55.00
(462)
Norway PowerPoint Maps Template: Download PPTID: #PM00191$55.00 (958)
Netherlands PowerPoint Maps - Download TemplateID: #PM00190$50.00
(958)
Netherlands PowerPoint Maps - Download TemplateID: #PM00190$50.00 (242)
Italy PowerPoint Maps Template: PresentationID: #PM00189$55.00
(242)
Italy PowerPoint Maps Template: PresentationID: #PM00189$55.00 (883)
Greece PowerPoint Maps: Bring Ancient Lands to Modern AudiencesID: #PM00188$50.00
(883)
Greece PowerPoint Maps: Bring Ancient Lands to Modern AudiencesID: #PM00188$50.00 (542)
Croatia PowerPoint Map Template - Fully Editable & Print ReadyID: #PM00184$40.00
(542)
Croatia PowerPoint Map Template - Fully Editable & Print ReadyID: #PM00184$40.00 (436)
Czech Republic PowerPoint Maps: Editable Professional Templates for Insightful PresentationsID: #PM00183$48.00
(436)
Czech Republic PowerPoint Maps: Editable Professional Templates for Insightful PresentationsID: #PM00183$48.00 (343)
Belgium PowerPoint Maps Template: Chart European EleganceID: #PM00178$55.00
(343)
Belgium PowerPoint Maps Template: Chart European EleganceID: #PM00178$55.00 (1088)
Austria PowerPoint Maps Template: Precision Meets EleganceID: #PM00177$55.00
(1088)
Austria PowerPoint Maps Template: Precision Meets EleganceID: #PM00177$55.00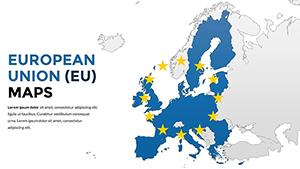 (1133)
Editable EU Maps PowerPoint Template: 61 SlidesID: #PM00175$58.00
(1133)
Editable EU Maps PowerPoint Template: 61 SlidesID: #PM00175$58.00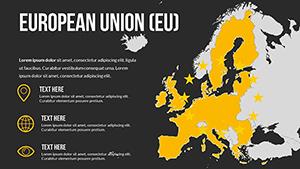 (1085)
EU Countries PowerPoint Maps Template - High-Quality PPTID: #PM00174$35.00
(1085)
EU Countries PowerPoint Maps Template - High-Quality PPTID: #PM00174$35.00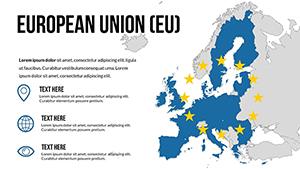 (826)
EU PowerPoint Maps Template - Customizable & DetailedID: #PM00173$35.00
(826)
EU PowerPoint Maps Template - Customizable & DetailedID: #PM00173$35.00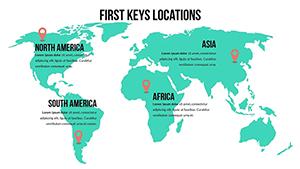 (681)
World Country Maps PowerPoint Template: Unlock Global InsightsID: #PM00169$26.00
(681)
World Country Maps PowerPoint Template: Unlock Global InsightsID: #PM00169$26.00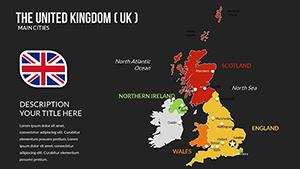 (345)
Editable UK PowerPoint Maps Template - DownloadID: #PM00166$25.00
(345)
Editable UK PowerPoint Maps Template - DownloadID: #PM00166$25.00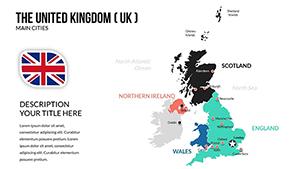 (1013)
United Kingdom (UK) Maps for PowerPoint: Navigate Success with PrecisionID: #PM00165$25.00
(1013)
United Kingdom (UK) Maps for PowerPoint: Navigate Success with PrecisionID: #PM00165$25.00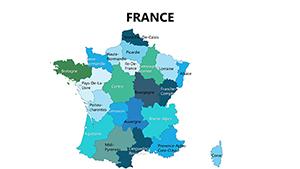 (331)
Editable France Regions PowerPoint Maps: Regional Storytelling RedefinedID: #PM00085$25.00
(331)
Editable France Regions PowerPoint Maps: Regional Storytelling RedefinedID: #PM00085$25.00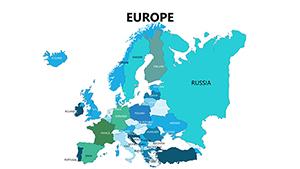 (803)
Complete Europe Maps for PowerPoint: 38 SlidesID: #PM00084$25.00
(803)
Complete Europe Maps for PowerPoint: 38 SlidesID: #PM00084$25.00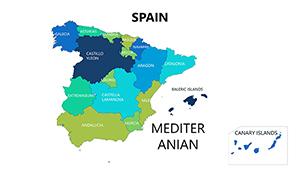 (827)
Spain PowerPoint Maps Template: 30 Editable SlidesID: #PM00083$25.00
(827)
Spain PowerPoint Maps Template: 30 Editable SlidesID: #PM00083$25.00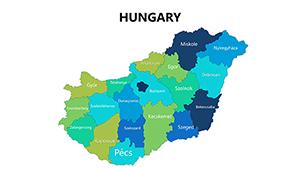 (310)
Editable Hungary PowerPoint Maps: 44 Versatile SlidesID: #PM00082$25.00
(310)
Editable Hungary PowerPoint Maps: 44 Versatile SlidesID: #PM00082$25.00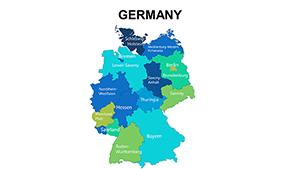 (111)
Maps of Germany Europe for PowerPoint: Explore Continental PrecisionID: #PM00072$25.00
(111)
Maps of Germany Europe for PowerPoint: Explore Continental PrecisionID: #PM00072$25.00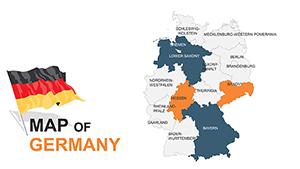 (1106)
Germany PowerPoint Maps Template: Engineering Excellence on DisplayID: #PM00059$40.00
(1106)
Germany PowerPoint Maps Template: Engineering Excellence on DisplayID: #PM00059$40.00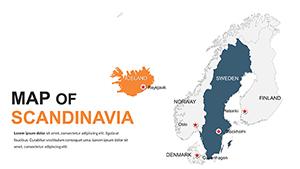 (807)
Editable Scandinavia PowerPoint Maps: Nordic Narratives AwaitID: #PM00058$50.00
(807)
Editable Scandinavia PowerPoint Maps: Nordic Narratives AwaitID: #PM00058$50.00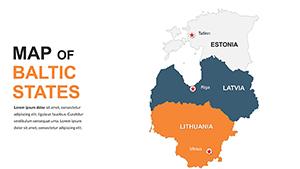 (590)
Editable Baltic States PowerPoint Maps Template: Visualize Your VisionID: #PM00056$45.00
(590)
Editable Baltic States PowerPoint Maps Template: Visualize Your VisionID: #PM00056$45.00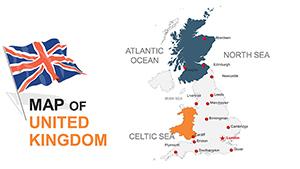 (920)
UK Editable PowerPoint Maps: Dynamic TemplateID: #PM00055$45.00
(920)
UK Editable PowerPoint Maps: Dynamic TemplateID: #PM00055$45.00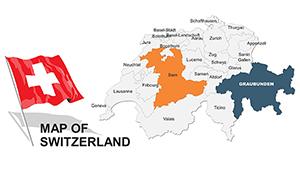 (73)
Switzerland Map PowerPoint Template | Fully Editable & Print ReadyID: #PM00046$40.00
(73)
Switzerland Map PowerPoint Template | Fully Editable & Print ReadyID: #PM00046$40.00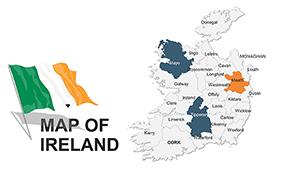 (866)
Editable Ireland Maps PPT Template: Unlock Geographic StorytellingID: #PM00044$45.00
(866)
Editable Ireland Maps PPT Template: Unlock Geographic StorytellingID: #PM00044$45.00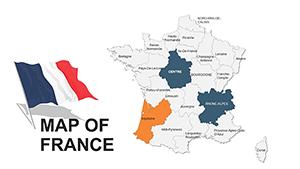 (1083)
France Editable Maps Template: 44 Pro SlidesID: #PM00042$48.00
(1083)
France Editable Maps Template: 44 Pro SlidesID: #PM00042$48.00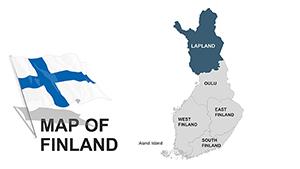 (462)
Finland Maps for PowerPoint: 44 Custom SlidesID: #PM00041$45.00
(462)
Finland Maps for PowerPoint: 44 Custom SlidesID: #PM00041$45.00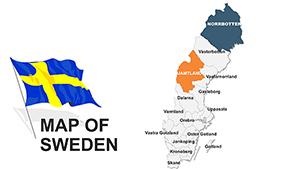 (586)
Sweden Map PowerPoint Template | Editable Corporate & Education SlidesID: #PM00040$40.00
(586)
Sweden Map PowerPoint Template | Editable Corporate & Education SlidesID: #PM00040$40.00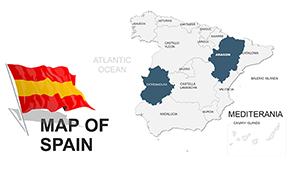 (579)
Spain PowerPoint Maps Template - Customizable ExcellenceID: #PM00038$48.00
(579)
Spain PowerPoint Maps Template - Customizable ExcellenceID: #PM00038$48.00
Transform Your Data into Compelling Visual Stories
In today's fast-paced business environment, audiences expect information delivered with clarity and visual appeal. Raw numbers and text-heavy slides fail to engage, while well-designed maps immediately communicate geographic patterns, regional differences, and spatial relationships that drive understanding and decision-making.
These PowerPoint map templates bridge the gap between data and comprehension. Instead of asking your audience to interpret spreadsheets or imagine geographic distributions, you show them exactly where performance is strong, where opportunities exist, and where attention is needed. This visual approach accelerates understanding and keeps presentations focused on insights rather than data interpretation.
Who Benefits from These Europe Map Templates
Sales and Business Development Teams
Regional sales managers showcase territory performance, quota attainment, and pipeline distribution across European markets. Highlighting top-performing countries with one color while identifying growth opportunities in different shades creates immediate visual hierarchy that focuses team discussions on priorities.
Business development professionals present market entry strategies, competitive landscapes, and expansion roadmaps. Maps showing current presence versus target markets help leadership teams visualize growth trajectories and resource allocation needs at a glance.
Finance and Investment Professionals
Financial analysts display portfolio exposure, investment concentration, and market valuations across European economies. Color-coded countries by asset allocation or risk profile help investment committees quickly assess diversification and identify concentration risks.
M&A teams track acquisition targets, competitive positioning, and market consolidation trends. Visualizing where companies operate, where competitors are strong, and where white space exists informs strategic recommendations and deal prioritization.
Marketing and Brand Teams
Marketing directors demonstrate campaign performance, brand awareness levels, and customer acquisition across different European regions. Maps showing social media engagement by country or advertising spend distribution help justify budget allocations and identify underserved markets.
Product launch teams coordinate go-to-market strategies, showing phased rollout plans or regional adaptation requirements. Visual timelines overlaid on maps communicate complex launch sequences more effectively than Gantt charts alone.
Academic and Research Applications
Professors teaching European studies, international relations, economics, or geography use these templates to illustrate historical events, political movements, trade relationships, and cultural patterns. Students retain concepts better when visual anchors reinforce textual information.
Researchers presenting findings at conferences or in publications use maps to show survey coverage, sample distribution, or regional variations in study results. Clear geographic visualization helps audiences evaluate methodology and interpret findings within proper context.
Government and Public Sector
Policy analysts communicate regulatory comparisons, compliance requirements, and program implementation across EU member states. Maps showing where policies differ or align help stakeholders understand complex regulatory landscapes.
Development organizations track project locations, funding distribution, and impact metrics across European regions. Visual reporting makes complex program portfolios accessible to diverse stakeholder groups including donors, partners, and beneficiaries.
Essential Features That Set These Templates Apart
Complete Editability: Every country, border, and label functions as a standard PowerPoint shape. Apply fills, gradients, outlines, shadows, and 3D effects using familiar tools. No special plugins or software required.
Multiple Map Styles: Choose from outline maps, filled maps, physical relief maps, and specialized thematic designs. Different presentation contexts call for different visual approaches, and having options ensures you select the style that best serves your content.
Layered Organization: Templates are built with logical grouping that makes editing intuitive. Countries, labels, borders, and backgrounds are typically on separate layers, allowing selective editing without affecting other elements.
High Resolution: Vector-based graphics maintain perfect clarity whether you're presenting on a laptop, projecting in a conference room, or printing poster-sized materials. Scale up or down without any quality degradation.
Brand Alignment: Apply your corporate color palette instantly using PowerPoint's format painter or by adjusting fill colors. Maintain visual consistency across your entire presentation deck.
Creative Ways to Enhance Your Map Presentations
Interactive Elements
PowerPoint's action settings allow you to create clickable maps where selecting a country jumps to a detailed slide about that market. This approach works exceptionally well for sales reviews where leadership wants to dive deep into specific territories without sitting through information about every region.
Hover effects using animation triggers can reveal additional information when the cursor moves over specific countries. This keeps your main slide uncluttered while making supplementary data available on demand.
Data Visualization Integration
Overlay charts and graphs directly onto map regions to show detailed breakdowns without requiring separate slides. A small pie chart on Germany showing product mix, a bar graph on France displaying quarterly trends, and data labels on other countries creates a comprehensive dashboard view.
Heat maps using color gradients communicate intensity or magnitude across the continent. Revenue per capita, growth rates, customer satisfaction scores, or any metric that varies by location becomes immediately comprehensible when displayed as graduated color scales.
Animation Techniques
Build your narrative progressively by revealing countries in sequence as you discuss them. This focuses attention and prevents audiences from reading ahead while you're explaining earlier points. Group animations by region to show clusters of related markets together.
Use emphasis animations like pulse or color change to highlight key countries during verbal explanation. This visual reinforcement helps audiences follow complex narratives involving multiple regions and data points.
Create before-and-after comparisons using morph transitions to show change over time. Display 2024 data on one slide and 2026 projections on the next, with PowerPoint smoothly transitioning the color changes to emphasize growth or decline in specific markets.
Design Principles for Professional Results
Simplicity Over Complexity
Resist the temptation to show everything at once. If you have data for twenty different metrics across thirty countries, create multiple focused maps rather than one overwhelming visualization. Each slide should communicate one clear insight.
Remove unnecessary detail that doesn't serve your message. If your presentation focuses on major markets like Germany, France, and the UK, consider using subtle neutral colors for smaller countries that provide geographic context without competing for attention.
Color Psychology and Accessibility
Choose colors that align with your message. Green typically signals positive performance, red indicates concerns, and neutral tones work for context. However, ensure your color choices remain accessible to colorblind viewers by incorporating patterns, labels, or sufficient brightness contrast alongside color coding.
Maintain consistency across slides. If Western Europe uses blue in one map, don't switch to green for the same region on the next slide unless the color change itself communicates meaningful information.
Typography and Labeling
Use clear, legible fonts for country labels and data callouts. Avoid decorative typefaces that sacrifice readability for style. Ensure text size is large enough to read from the back of your presentation room.
Position labels consistently, typically centered within countries or placed with leader lines for smaller nations. Inconsistent label placement creates visual chaos that distracts from your message.
Technical Tips for PowerPoint Map Customization
When editing grouped objects, right-click and select "Edit Points" to adjust country boundaries if needed, though most templates are accurately drawn and won't require this level of modification. For most users, simply changing fills and adding text accomplishes everything needed.
Use PowerPoint's alignment and distribution tools to position multiple text boxes or icons evenly across your map. This creates professional polish that audiences notice subconsciously, contributing to overall credibility.
Save customized maps as PowerPoint templates or slide masters if you'll use them repeatedly. This ensures consistency across presentations and saves preparation time for recurring reports or regular updates.
Test your presentation on multiple devices before presenting. Color accuracy, animation timing, and font availability can vary between computers. Running through your deck on the actual presentation equipment prevents last-minute surprises.
Maximizing Return on Your Template Investment
Think beyond single-use applications. A well-designed Europe map template can serve quarterly business reviews, investor presentations, training materials, proposal documents, and internal reporting. The time saved across multiple uses far exceeds the initial download investment.
Build a library of customized versions for different purposes. Create one showing your sales territories, another highlighting manufacturing locations, and a third focused on customer distribution. Having these ready to insert speeds up presentation development significantly.
Start creating more impactful presentations today. Browse our collection of Europe PowerPoint map templates and discover designs that will transform how you communicate regional data and geographic insights.
Frequently Asked Questions
Do these templates work with PowerPoint for Mac and Windows?
Yes, these templates are compatible with both Windows and Mac versions of PowerPoint. They use standard PowerPoint features and shapes that work across platforms. However, always test on your specific system to ensure fonts and animations behave as expected.
Can I separate individual countries from the map?
Absolutely. Most templates are built with individual country shapes that can be ungrouped, moved, resized, or removed as needed. This allows you to create custom regional maps focusing on specific areas like the Balkans, Scandinavia, or Benelux countries.
How do I add my company logo or branding to the maps?
Simply insert your logo image using PowerPoint's picture insert function and position it where desired on the slide. You can also apply your brand colors to the map elements using the format painter tool or by manually changing fill colors to match your corporate palette.
Are these templates suitable for printing or only screen presentation?
These templates work excellently for both purposes. The vector graphics scale to any size without quality loss, making them suitable for everything from printed handouts to large-format posters. For print projects, ensure your PowerPoint page size matches your intended output dimensions.
Can I animate different countries to appear in sequence?
Yes, PowerPoint's animation pane allows you to apply entrance effects to individual countries or groups of countries. You can create builds that reveal your map progressively, emphasize specific regions, or demonstrate change over time using morph transitions between slides.
What PowerPoint version do I need to use these templates?
Most templates work with PowerPoint 2013 and later versions, including Microsoft 365 subscriptions. Some advanced features like morph transitions require newer versions. Check individual template descriptions for specific compatibility information.