Cubes PowerPoint Charts
These templates contain ready 3D cube layouts for comparing volumes, showing layered metrics, and building infographics in PowerPoint. A product manager updating feature adoption numbers or a finance analyst presenting budget allocation reaches for one when the data model is finalized.
Picture a sales director who must show regional performance by product line in the quarterly review. The 3D cube template opens with pre-set shadows and reflections; swapping values and colors takes minutes. Depth perspective makes volume differences obvious at a glance.
Choose the cube style that fits your metrics and open the file.
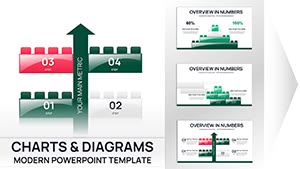 (16)
(16) 42-Slide Building Blocks PowerPoint Chart Template - Instant Download for Investor PresentationsID: #PC01107$18.00
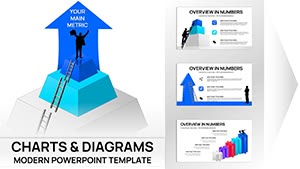 (10)
Career Personal Trainer Proposal Charts PowerPoint TemplateID: #PC01098$18.00
(10)
Career Personal Trainer Proposal Charts PowerPoint TemplateID: #PC01098$18.00 (13)
(13) Editable 3D Cubes Charts PowerPoint TemplateID: #PC01095$22.00
 (17)
3D Cube Charts PowerPoint TemplateID: #PC01071$25.00
(17)
3D Cube Charts PowerPoint TemplateID: #PC01071$25.00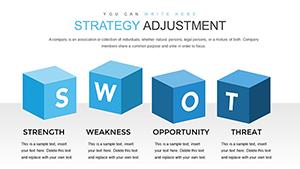 (20)
(20) Strategy Adjustment PowerPoint Charts: Enhance Goal AchievementID: #PC00866$20.00
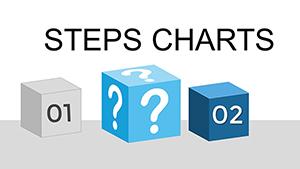 (960)
Steps Processing PowerPoint Charts Presentation TemplateID: #PC00809$20.00
(960)
Steps Processing PowerPoint Charts Presentation TemplateID: #PC00809$20.00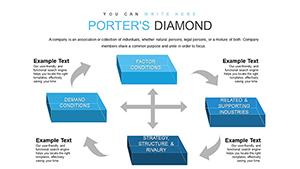 (528)
3D Cubes Porter's Five Forces PowerPoint TemplateID: #PC00806$15.00
(528)
3D Cubes Porter's Five Forces PowerPoint TemplateID: #PC00806$15.00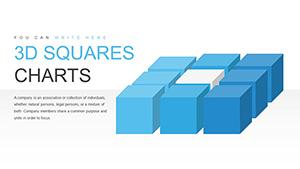 (145)
3D Squares Cube PowerPoint Charts Template - 30 SlidesID: #PC00801$18.00
(145)
3D Squares Cube PowerPoint Charts Template - 30 SlidesID: #PC00801$18.00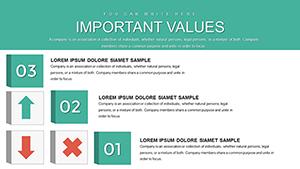 (537)
(537) Business Process Modeling 3D Cube PowerPoint Charts TemplateID: #PC00794$15.00
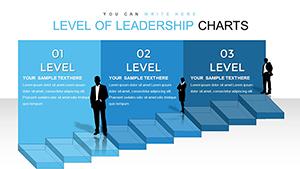 (5)
Level of Leadership 3D Cube PowerPoint Charts TemplateID: #PC00793$20.00
(5)
Level of Leadership 3D Cube PowerPoint Charts TemplateID: #PC00793$20.00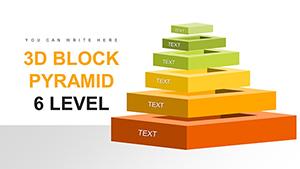 (298)
6-Level 3D Block Pyramid PowerPoint Charts: Visualize Hierarchies with DepthID: #PC00744$23.00
(298)
6-Level 3D Block Pyramid PowerPoint Charts: Visualize Hierarchies with DepthID: #PC00744$23.00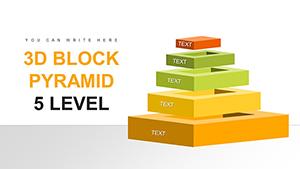 (692)
Fully Editable 4-Segment Data Comparison PowerPoint Template - Instant DownloadID: #PC00743$22.00
(692)
Fully Editable 4-Segment Data Comparison PowerPoint Template - Instant DownloadID: #PC00743$22.00 (253)
4-Level 3D Block Pyramid: PowerPoint Charts for Clear HierarchiesID: #PC00742$21.00
(253)
4-Level 3D Block Pyramid: PowerPoint Charts for Clear HierarchiesID: #PC00742$21.00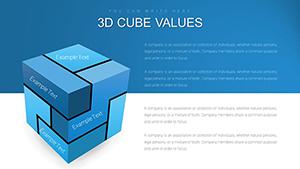 (1104)
3D Cube Marked Sides PowerPoint Charts TemplateID: #PC00676$20.00
(1104)
3D Cube Marked Sides PowerPoint Charts TemplateID: #PC00676$20.00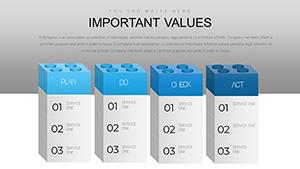 (116)
3D Blocks Plan-Do-Check-Act PowerPoint Charts Template: Fuel Your Process EvolutionID: #PC00673$20.00
(116)
3D Blocks Plan-Do-Check-Act PowerPoint Charts Template: Fuel Your Process EvolutionID: #PC00673$20.00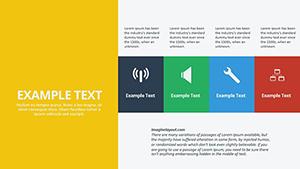 (967)
Action Steps Charts: PowerPoint TemplateID: #PC00335$18.00
(967)
Action Steps Charts: PowerPoint TemplateID: #PC00335$18.00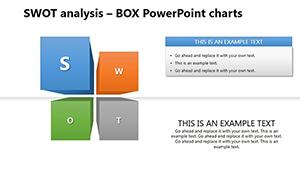 (58)
SWOT Analysis Box PowerPoint Charts Template for ArchitectureID: #PC00261$20.00
(58)
SWOT Analysis Box PowerPoint Charts Template for ArchitectureID: #PC00261$20.00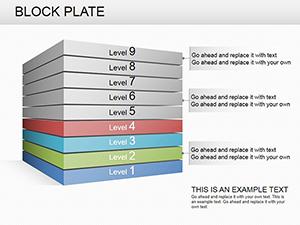 (139)
Block Plate PowerPoint Charts: Versatile 11-Slide TemplateID: #PC00239$22.00
(139)
Block Plate PowerPoint Charts: Versatile 11-Slide TemplateID: #PC00239$22.00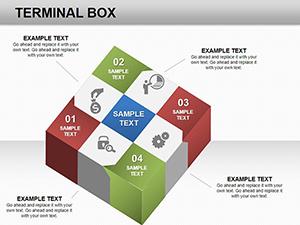 (370)
Terminal Box PowerPoint Charts Template: Revolutionize Your Data StorytellingID: #PC00215$18.00
(370)
Terminal Box PowerPoint Charts Template: Revolutionize Your Data StorytellingID: #PC00215$18.00 (1167)
Constructor Solutions PowerPoint Charts Template: Build Visually Stunning NarrativesID: #PC00212$20.00
(1167)
Constructor Solutions PowerPoint Charts Template: Build Visually Stunning NarrativesID: #PC00212$20.00 (896)
Cycle Diagram PowerPoint Template | Square Cycle Design - Fully Editable Instant DownloadID: #PC00172$8.00
(896)
Cycle Diagram PowerPoint Template | Square Cycle Design - Fully Editable Instant DownloadID: #PC00172$8.00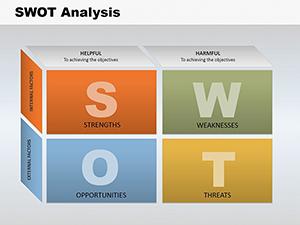 (615)
SWOT Analysis Cube PowerPoint Charts Template for PresentationID: #PC00123$24.00
(615)
SWOT Analysis Cube PowerPoint Charts Template for PresentationID: #PC00123$24.00 (489)
3D Blocks PowerPoint Chart Template DownloadID: #PC00072$19.00
(489)
3D Blocks PowerPoint Chart Template DownloadID: #PC00072$19.00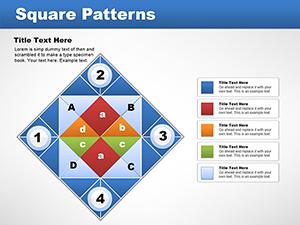 (565)
Matrix Square Patterns PowerPoint Charts TemplateID: #PC00043$15.00
(565)
Matrix Square Patterns PowerPoint Charts TemplateID: #PC00043$15.00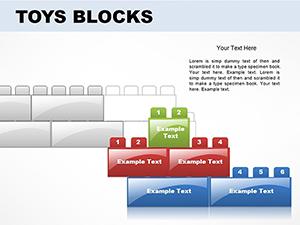 (131)
Editable Toys Blocks PowerPoint Charts - 14 Slides for Board Meetings ReportsID: #PC00037$15.00
(131)
Editable Toys Blocks PowerPoint Charts - 14 Slides for Board Meetings ReportsID: #PC00037$15.00 (144)
Career Personal Trainer PowerPoint Charts TemplateID: #PC00036$14.00
(144)
Career Personal Trainer PowerPoint Charts TemplateID: #PC00036$14.00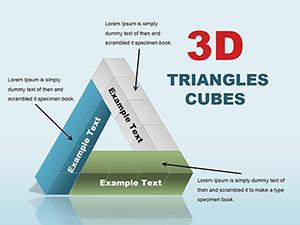 (53)
3D Triangles Cubes PowerPoint Charts Template for Immersive ArchitectureID: #PC00028$25.00
(53)
3D Triangles Cubes PowerPoint Charts Template for Immersive ArchitectureID: #PC00028$25.00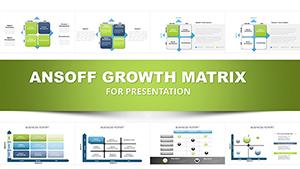 (1153)
Ansoff Growth Matrix PowerPoint Charts TemplateID: #PC00020$20.00
(1153)
Ansoff Growth Matrix PowerPoint Charts TemplateID: #PC00020$20.00 (399)
3D Cubes PowerPoint Charts: Add Dimension to Your Data NarrativesID: #PC00005$20.00
(399)
3D Cubes PowerPoint Charts: Add Dimension to Your Data NarrativesID: #PC00005$20.00
Visualizing Volume and Layers with 3D Cube Charts
A product manager compares feature usage across user segments. The multi-cube template stacks volumes side by side so leadership sees adoption gaps immediately. The realistic shadows guide the eye without extra explanation.
A finance team maps quarterly revenue by channel. The layered cube layout shows contribution levels with consistent lighting so trends pop during the CFO review.
A marketing lead tracks campaign ROI across channels. The segmented cube template updates values from the Excel link and the 3D rotation reveals performance from every angle.
An operations director visualizes inventory capacity. The process cube template illustrates flow stages with depth so bottlenecks stand out in the weekly stand-up.
Avoiding the Formatting Traps of Manual 3D Chart Construction
Building 3D cubes manually requires matching bevel angles, shadow offsets, and rotation across every element. One misalignment and the entire visualization loses credibility. These templates lock those settings so you only change data.
Reusing Cube Layouts in Monthly KPI Decks
The same master cube style carries forward each month. Update numbers and the lighting and perspective stay identical so trends are comparable slide after slide.
PowerPoint 3D Rotation and Lighting Controls That Matter
Select a cube and open the 3D format pane to adjust depth and rotation precisely. Use the same preset on every cube in the deck for visual consistency. Copy the format with the format painter to apply to new elements instantly.
Configuring 16:9 Aspect Ratio for Cube Charts
Start with widescreen slide size so cubes sit comfortably without cropping. When exporting to PDF select best for printing to keep bevel highlights sharp on board handouts.
What Sets These 3D Cube Charts Apart for Business Use
Everything is built from native PowerPoint shapes and 3D effects so no external images break on resize. Data-driven versions link to Excel where available and the focus stays on metric clarity rather than decorative flair.
If your next presentation needs structured data analysis instead, explore the analysis Keynote diagrams templates. When you require layered metric comparisons, the cubes PowerPoint chart templates provide depth. For presentations built in Keynote with three-dimensional impact, see the 3D Keynote diagrams templates.
Find the cube layout that matches your metrics and open the file.
Are these 3D cube charts compatible with older PowerPoint versions?
Templates open in PowerPoint 2016 and newer with full 3D effects. Earlier versions display flat shapes but retain all data and text. Use the included 2D fallback layouts if presenting on legacy machines to keep readability intact.
Can I link cube data directly to Excel?
Several templates include data-driven charts linked to embedded Excel sheets. Update the source numbers and the cube volumes refresh automatically. For others copy values manually into the text boxes while the 3D structure stays locked.
How do I keep lighting consistent across multiple cubes?
Apply the same 3D rotation and bevel preset to every cube using the format painter tool. Save the style as a custom theme element for reuse in future decks. One change updates the entire visualization set.
Will the 3D effects render correctly when exporting to PDF?
Choose high quality print and embed fonts in the export dialog. Bevels and shadows remain visible on printed and projected PDFs. Test on the target projector to confirm depth perception holds at distance.
Can team members edit the same cube file together?
The license allows internal sharing and simultaneous editing via OneDrive or shared folders. Multiple contributors can update different cubes in the deck without version conflicts. The native shapes ensure changes stay intact across platforms.