Cubes Keynote Diagrams
Formerly known as cubes keynote diagrams - this collection now includes dashboards, infographics, and modern presentation layouts.
Cube diagram templates offer a visual framework for representing three-dimensional relationships or layered information in Keynote.
Strategy consultants, project leads, and analysts use them when standard flat diagrams fall short in conveying complexity.
Apply them in quarterly business reviews or workshop sessions where showing interconnections between market factors, team roles, or project phases adds clarity.
They provide an advantage over basic rectangles or circles by adding depth that draws attention to priority areas or sequences.
Select and download the cube configurations that match your presentation goals.
 (1121)
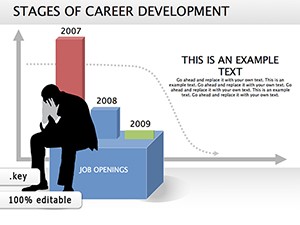
 Stages Career Development Diagrams: Chart Your Path to Professional PeaksID: #KD00178$20.00
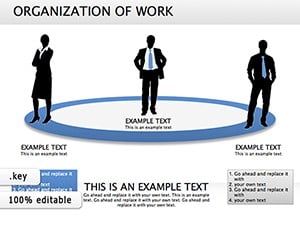 (100)
Organization of Work Keynote Diagrams: Structure Success EffortlesslyID: #KD00172$26.00
(100)
Organization of Work Keynote Diagrams: Structure Success EffortlesslyID: #KD00172$26.00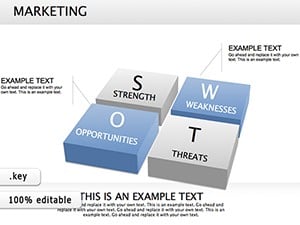 (1191)
 Marketing Keynote Diagrams- Download PresentationID: #KD00166$27.00
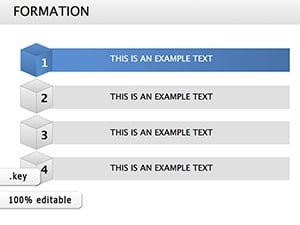 (845)
Statistical Analysis Keynote diagram templateID: #KD00165$22.00
(845)
Statistical Analysis Keynote diagram templateID: #KD00165$22.00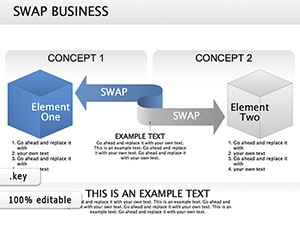 (1010)
 Swap Option Keynote diagram templateID: #KD00164$22.00
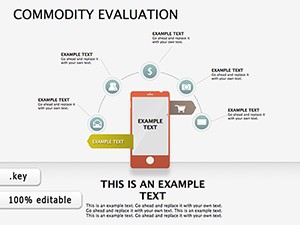 (249)
Commodity Evaluation Keynote DiagramsID: #KD00158$19.99
(249)
Commodity Evaluation Keynote DiagramsID: #KD00158$19.99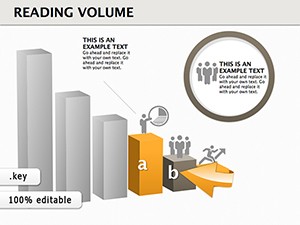 (17)
Reading Volume Keynote Diagrams: 19 Editable 3D Slides for Data MasteryID: #KD00136$22.00
(17)
Reading Volume Keynote Diagrams: 19 Editable 3D Slides for Data MasteryID: #KD00136$22.00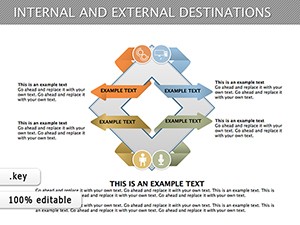 (1165)
Editable Internal & External Destinations Keynote DiagramsID: #KD00127$24.00
(1165)
Editable Internal & External Destinations Keynote DiagramsID: #KD00127$24.00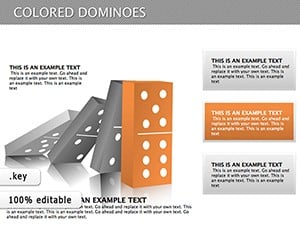 (1200)
Colored Domino Keynote Diagrams - Fully EditableID: #KD00118$22.00
(1200)
Colored Domino Keynote Diagrams - Fully EditableID: #KD00118$22.00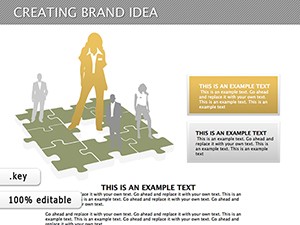 (230)
(230) Creating Brand Idea Keynote Diagrams TemplateID: #KD00117$23.00
 (702)
Block Keynote Diagrams: Stack 3D Visions in Architectural GloryID: #KD00090$20.00
(702)
Block Keynote Diagrams: Stack 3D Visions in Architectural GloryID: #KD00090$20.00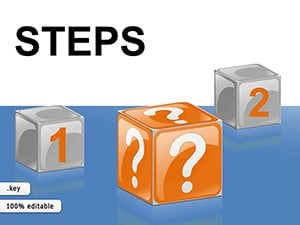 (1181)
Steps Keynote Diagram TemplateID: #KD00041$20.00
(1181)
Steps Keynote Diagram TemplateID: #KD00041$20.00 (822)
BCG Matrix Keynote diagram templateID: #KD00037$24.00
(822)
BCG Matrix Keynote diagram templateID: #KD00037$24.00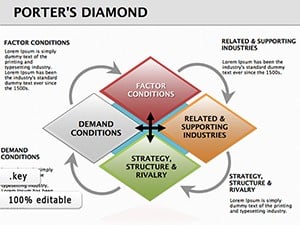 (125)
Porter's Diamond Keynote Diagrams: Forging Competitive InsightsID: #KD00035$26.00
(125)
Porter's Diamond Keynote Diagrams: Forging Competitive InsightsID: #KD00035$26.00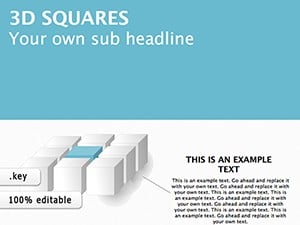 (772)
3D Squares Keynote Diagrams: Construct Depth in Every SlideID: #KD00031$25.00
(772)
3D Squares Keynote Diagrams: Construct Depth in Every SlideID: #KD00031$25.00 (395)
Business Process Keynote Diagrams: Visualize Workflows EffortlesslyID: #KD00024$18.00
(395)
Business Process Keynote Diagrams: Visualize Workflows EffortlesslyID: #KD00024$18.00 (319)
Manager Keynote Diagrams: Chart Leadership Paths with EaseID: #KD00023$24.00
(319)
Manager Keynote Diagrams: Chart Leadership Paths with EaseID: #KD00023$24.00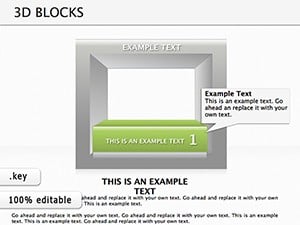 (545)
3D Blocks Keynote Diagrams TemplateID: #KD00014$20.00
(545)
3D Blocks Keynote Diagrams TemplateID: #KD00014$20.00
Business Applications of Cube Diagrams
Cube diagrams excel in scenarios requiring representation of volume, perspectives, or building blocks. The following examples illustrate typical situations in which they deliver value.
Consulting Frameworks
In management consulting, cubes illustrate the three pillars of a strategy or different views of customer experience. A client engagement might use one cube face for cost, another for time, and the third for quality to help decision makers see trade-offs at a glance.
Marketing Reporting
Marketing teams map campaign performance across channels, audience segments, and outcomes using cube faces. During quarterly business reviews this format allows stakeholders to quickly grasp how different levers contribute to overall results.
Training Workshops
Educators and trainers use them to break down technical concepts like system architecture or data flows. Participants retain the information better when each cube face represents a distinct layer or component.
Investor Pitches
Startups show product architecture or go-to-market model with cubes to make abstract ideas tangible. The 3D structure helps investors visualize how features interconnect and support business objectives.
Comparison with Default PowerPoint and Keynote Shapes
Default shapes like boxes or arrows create flat representations. Cube diagrams introduce isometric or 3D perspective that improves perceived value of the slide and helps audiences retain the relationships shown.
Building equivalent visuals from scratch takes considerable time to achieve consistent shading and angles. Pre-built templates eliminate this effort while ensuring every cube maintains the same visual language across the deck.
Best-Practice Advice for Cube Diagrams
- Assign distinct colors to each visible face of the cube for different data categories.
- Keep text concise and use labels or short phrases.
- Combine with arrows or connectors to indicate flow or influence between cubes.
- Limit to 3-5 cubes per slide to avoid visual clutter.
- Test the slide in presentation mode to confirm readability from the back of the room.
Technical Tips for Customization
In Keynote, select the cube group and use the arrange menu to adjust layering. Modify individual face colors via the style panel. Duplicate cubes and reposition for stacked or matrix layouts. Ensure the 3D effect is consistent by copying styles. If exporting to PDF, verify that shadows and gradients render as expected.
Why This Category Stands Apart
This group focuses on cube-based visuals as a strategic tool rather than decorative elements. It helps users decide when a 3D metaphor adds value over 2D charts or process flows. The category exists because many business scenarios involve information that benefits from volume and perspective cues that flat shapes cannot convey as effectively.
Download the cube diagram templates suited to your next strategy or review presentation.
Are cube diagram templates editable?
Yes, all shapes, colors, text, and sizes can be adjusted to fit your specific content.
Do they support Keynote specifically?
Yes, optimized for Keynote with compatible versions for PowerPoint.
How many variations of cube diagrams are available?
The collection includes stacked, interconnected, exploded view, and perspective variations.
Can I animate the cube diagrams?
Yes, basic entrance and emphasis animations work well to highlight different faces or cubes.