Central America PowerPoint Maps
Central America map templates for PowerPoint provide ready graphics with accurate boundaries for the region and its countries. The collection covers Belize, Guatemala, Honduras, El Salvador, Nicaragua, Costa Rica, Panama and related areas with political and physical details.
Analysts and teams in international operations rely on these when presenting geographic data in meetings or classes. This category addresses the need for focused visuals limited to Central America instead of broader collections.
Use the templates when default shapes do not deliver the required precision for country outlines and data overlays. A logistics manager can apply the regional map during a board meeting to illustrate supply routes across multiple nations with color coded performance indicators.
Downloading a complete template saves hours compared to manual creation from blank slides and ensures consistent proportions across all elements.
 (172)
(172) Panama PowerPoint Maps: Template for Professional PresentationsID: #PM00199$48.00
 (968)
(968) Nicaragua PowerPoint Maps Template: Customizable & Professional PPTID: #PM00198$45.00
 (1155)
Jamaica PowerPoint Maps: Editable Templates for Impactful PresentationsID: #PM00197$50.00
(1155)
Jamaica PowerPoint Maps: Editable Templates for Impactful PresentationsID: #PM00197$50.00 (802)
(802) Honduras Map PowerPoint Template | Fully Editable 36 Slides & Infographics - Instant DownloadID: #PM00196$36.00
 (750)
Guatemala PowerPoint Maps Template: Visualize Central American InsightsID: #PM00192$48.00
(750)
Guatemala PowerPoint Maps Template: Visualize Central American InsightsID: #PM00192$48.00 (991)
El Salvador PowerPoint Maps Template: Visualize Central American PotentialID: #PM00187$50.00
(991)
El Salvador PowerPoint Maps Template: Visualize Central American PotentialID: #PM00187$50.00 (546)
Editable Cuba PowerPoint Maps Template: Unlock Professional VisualsID: #PM00182$40.00
(546)
Editable Cuba PowerPoint Maps Template: Unlock Professional VisualsID: #PM00182$40.00 (364)
Dominican Republic PowerPoint Maps Template: Vivid and VersatileID: #PM00181$40.00
(364)
Dominican Republic PowerPoint Maps Template: Vivid and VersatileID: #PM00181$40.00 (851)
Belize PowerPoint Maps Template: Ignite Tropical TalesID: #PM00179$45.00
(851)
Belize PowerPoint Maps Template: Ignite Tropical TalesID: #PM00179$45.00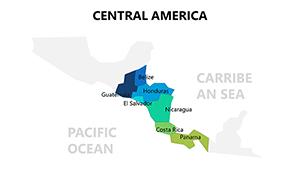 (577)
Central America PowerPoint Maps: Editable TemplateID: #PM00077$22.00
(577)
Central America PowerPoint Maps: Editable TemplateID: #PM00077$22.00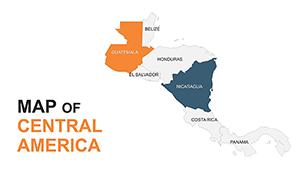 (228)
Central America Editable Maps: Tropical Visions UnleashedID: #PM00051$35.00
(228)
Central America Editable Maps: Tropical Visions UnleashedID: #PM00051$35.00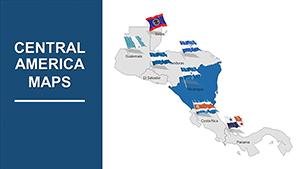 (217)
(217) Globalize Your Designs with Central America PowerPoint MapsID: #PM00011$44.00
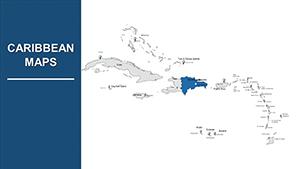 (19)
Editable Caribbean Islands PowerPoint Maps: Transform Your Presentations with Geographic PrecisionID: #PM00010$30.00
(19)
Editable Caribbean Islands PowerPoint Maps: Transform Your Presentations with Geographic PrecisionID: #PM00010$30.00
Use Cases
The templates support targeted scenarios across industries. A logistics manager at a multinational firm based in Mexico prepares a market entry strategy for the board. The regional map shows proposed distribution networks across Guatemala and Honduras with overlaid sales forecasts to guide investment decisions.
An educator at a university in Europe teaches a geography course on climate patterns. Country specific maps of Costa Rica and Panama allow students to mark rainfall data and discuss environmental trends in group discussions.
A marketing lead for a tourism operator in the United States creates an investor pitch. The Panama map highlights key visitor sites and infrastructure with data labels to demonstrate growth potential over the past year.
A development officer at a regional agency in El Salvador conducts a quarterly review for government stakeholders. The Honduras map displays project locations and impact zones with color variations to communicate progress on infrastructure initiatives.
Comparison vs. default PowerPoint shapes or blank slides
Default PowerPoint shapes rarely match the exact geographic borders of Central American countries. Users spend extra time adjusting curves and proportions to achieve realism. Templates provide pre drawn vectors that maintain accuracy at any scale.
Blank slides require manual addition of labels and cities which can lead to inconsistencies across slides. The provided templates include ready elements for quick data insertion. Editing default shapes often results in distortion when resized while vector maps stay clean.
Data visualization on blank slides demands separate chart creation and alignment. Templates allow direct overlay of charts or numbers onto country shapes with group functions. Time spent on basic drawing reduces focus on content development and analysis.
Color coding for metrics becomes inconsistent without preset layers. Templates offer editable fill options that support uniform application across the set. The result is cleaner slides that communicate information more effectively to audiences.
Overall the templates deliver a structured starting point that blank slides lack leading to faster preparation and higher quality output in time sensitive projects.
Best-practice advice for using the templates in this category
Select the map scale that matches the presentation focus. Regional overviews work for broad discussions while individual country slides suit detailed analysis. Maintain a single color palette across all slides to reinforce brand identity during board meetings.
Add data labels only where necessary to avoid clutter. Use the selection pane to organize layers and ensure text remains readable at presentation size. Test the slide in slideshow mode to confirm that overlays remain aligned after any edits.
Group related elements before copying to other slides. This preserves positioning and allows uniform updates across multiple country maps in a single report. Combine with company charts for hybrid slides that show both geography and metrics in context.
Save a master version with all maps before final edits. This practice supports version control when multiple team members contribute to the same quarterly review deck.
Technical tip specific to this category type
To apply data driven fills use the shape format options to change country fill colors individually. Select each country shape then access the fill menu and assign hues based on performance values. The selection pane helps isolate specific countries without affecting labels or borders.
Group the map elements after coloring to treat the entire graphic as one object. This step prevents accidental movement of individual pieces during slide transitions. For Google Slides import the file then use the arrange menu to manage layers in the same way.
Why ImagineLayout versions differ from competitors
ImagineLayout organizes maps into dedicated regional collections such as Central America. This structure allows users to locate exactly the required visuals without browsing mixed global packs. The templates maintain compatibility with both PowerPoint and Google Slides for flexible team sharing.
Competitors often bundle maps from many regions in one package which complicates selection for focused work. The separate category format here supports quicker decisions during preparation for investor pitches or training workshops.
Editable vector quality ensures clean scaling for printed handouts or large screen displays. The approach positions the site as a resource for targeted presentation needs rather than a general catalog.
FAQ
How do I download these map templates?
Navigate to the chosen product page and complete the purchase or free selection process. The file arrives in .pptx format ready for immediate use in PowerPoint. Open the file and begin editing colors or adding text. For Google Slides upload the file through the import option to convert and start working. This process takes only a few minutes and works on both desktop and cloud versions.
Are the templates compatible with Google Slides?
Yes all files open directly in Google Slides after upload. The vector elements remain fully editable including borders colors and text. Layouts and groupings transfer without loss allowing the same customization options available in PowerPoint. Teams can collaborate in real time on a shared map slide. Test the file after import to confirm all countries display correctly before final use in client sessions.
Can I change colors and labels on the maps?
The shapes support full color changes through standard fill tools in PowerPoint or Google Slides. Labels can be added deleted or repositioned as text boxes. Country outlines stay intact during edits. This flexibility supports custom data representation such as sales by country or project status. Save custom versions separately to reuse in future quarterly reports without starting over.
What licensing applies to these templates?
Purchased templates allow personal and commercial use in presentations for clients or internal meetings. Redistribution of the original files is not permitted. Modified versions can appear in reports or pitches as long as the source is not resold. Check the license note on each product page for any additional restrictions. This arrangement supports consultants and companies that need reliable visuals for ongoing work.
Do the maps cover all Central American countries?
The collection includes dedicated templates for Belize Guatemala Honduras El Salvador Nicaragua Costa Rica and Panama plus regional views. Additional Caribbean islands appear in some options for extended coverage. Users can combine slides for complete presentations covering the full area. Missing specific islands can be requested through support for future updates. The range ensures most regional projects find suitable starting maps.