Agriculture & Animals Keynote Themes
Formerly known as agriculture_animals - this collection now covers agriculture and animal presentations. These templates provide ready layouts for any deck about crops, livestock, or environmental initiatives. A farm manager preparing the annual sustainability report skips the hours spent aligning harvest charts and animal icons.
The file opens with sections for yield timelines and health indicators already balanced. The collection serves farmers, veterinarians, and agribusiness analysts who must communicate technical data to investors or regulators.
Emphasis stays on clear data flow so audiences follow from current state to recommended actions. Pick the template for your next update and open the file.
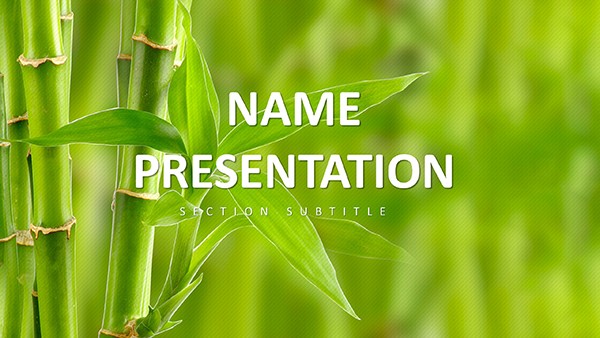 (51)
(51) Eco Bamboo Keynote Template: Green Designs for Inspired PresentationsID: #KT03888free
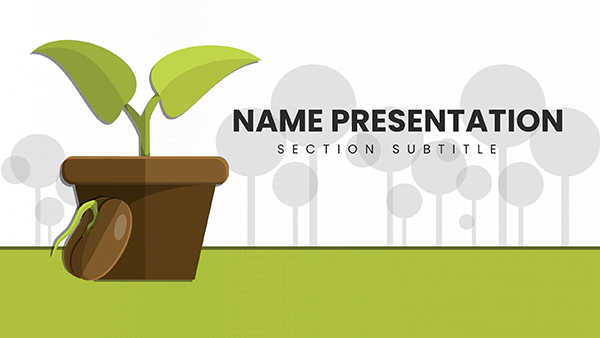 (931)
(931) Eco-Friendly Growth Keynote Template for SustainabilityID: #KT03697$12.00
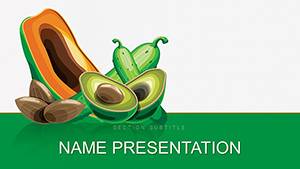 (288)
Vitamin E Foods Keynote Template: Nourish Your PresentationsID: #KT03685$12.00
(288)
Vitamin E Foods Keynote Template: Nourish Your PresentationsID: #KT03685$12.00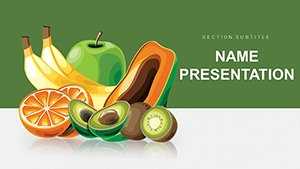 (624)
(624) Vibrant Fruits Keynote Template: Juice Up Your PresentationsID: #KT03675$10.00
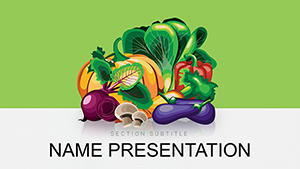 (157)
Vegetables and Greengrocery Keynote Template: Harvest Engaging ContentID: #KT03674$12.00
(157)
Vegetables and Greengrocery Keynote Template: Harvest Engaging ContentID: #KT03674$12.00 (1188)
 Bamboo Grove Keynote Template for Tranquil PresentationsID: #KT03636$12.00
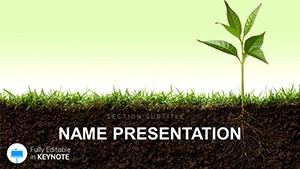 (1131)
Growth and Development Keynote Template for BusinessesID: #KT03541$10.00
(1131)
Growth and Development Keynote Template for BusinessesID: #KT03541$10.00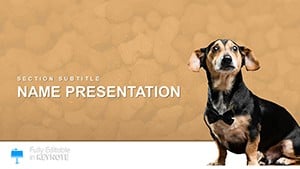 (1177)
Pet Dog Keynote Template: Bringing Canine Stories to Vibrant LifeID: #KT03384$12.00
(1177)
Pet Dog Keynote Template: Bringing Canine Stories to Vibrant LifeID: #KT03384$12.00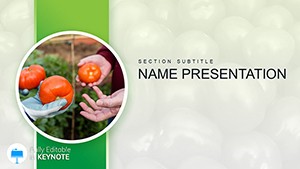 (1071)
Growing Tomatoes Keynote Template: From Seed to Slide SuccessID: #KT03332$12.00
(1071)
Growing Tomatoes Keynote Template: From Seed to Slide SuccessID: #KT03332$12.00 (990)
Complete Guide to Caring for Dogs Keynote TemplateID: #KT03317$12.00
(990)
Complete Guide to Caring for Dogs Keynote TemplateID: #KT03317$12.00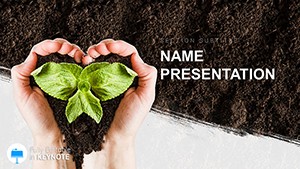 (922)
Gardening for Beginners Keynote Themes - TemplateID: #KT03309$12.00
(922)
Gardening for Beginners Keynote Themes - TemplateID: #KT03309$12.00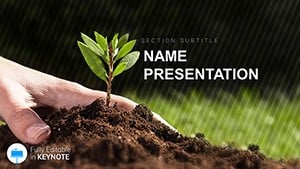 (281)
Botany Plant Science Keynote Template - Ecology Presentation | Fully Editable | Instant Download | ImagineLayoutID: #KT03308$10.00
(281)
Botany Plant Science Keynote Template - Ecology Presentation | Fully Editable | Instant Download | ImagineLayoutID: #KT03308$10.00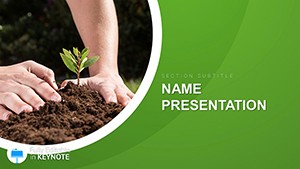 (615)
Ecobiology Plants Keynote templateID: #KT03297$12.00
(615)
Ecobiology Plants Keynote templateID: #KT03297$12.00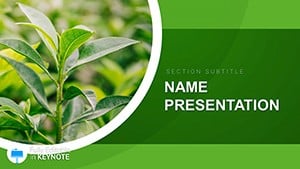 (705)
Ecology Biology Keynote templateID: #KT03296$12.00
(705)
Ecology Biology Keynote templateID: #KT03296$12.00 (1113)
Flora Sprout Plants Keynote templateID: #KT03294$12.00
(1113)
Flora Sprout Plants Keynote templateID: #KT03294$12.00 (111)
Veterinary Emergency Clinic Keynote TemplatesID: #KT03273$12.00
(111)
Veterinary Emergency Clinic Keynote TemplatesID: #KT03273$12.00 (670)
Pet Vet Doctor Keynote Template - ThemesID: #KT03272$10.00
(670)
Pet Vet Doctor Keynote Template - ThemesID: #KT03272$10.00 (278)
Animal Disease and Services Veterinary Clinics Keynote TemplateID: #KT03271$12.00
(278)
Animal Disease and Services Veterinary Clinics Keynote TemplateID: #KT03271$12.00 (240)
Dog Disease and Veterinarian Keynote Template for PresentationID: #KT03270$12.00
(240)
Dog Disease and Veterinarian Keynote Template for PresentationID: #KT03270$12.00 (307)
Treatment Of Animals In Veterinary Clinic Keynote TemplateID: #KT03269$12.00
(307)
Treatment Of Animals In Veterinary Clinic Keynote TemplateID: #KT03269$12.00 (831)
Plant Ecology Keynote TemplateID: #KT03268$12.00
(831)
Plant Ecology Keynote TemplateID: #KT03268$12.00 (1067)
Download Agriculture Keynote Template - Design PresentationID: #KT03232$10.00
(1067)
Download Agriculture Keynote Template - Design PresentationID: #KT03232$10.00 (620)
Eco Soil Resources Keynote templateID: #KT03231$12.00
(620)
Eco Soil Resources Keynote templateID: #KT03231$12.00 (958)
Sea Fish Keynote Template: Immerse in Oceanic NarrativesID: #KT02776$12.00
(958)
Sea Fish Keynote Template: Immerse in Oceanic NarrativesID: #KT02776$12.00 (389)
Shark Conservation Keynote TemplateID: #KT02775$12.00
(389)
Shark Conservation Keynote TemplateID: #KT02775$12.00 (286)
Vegetables Keynote Template Agriculture - Instant DownloadID: #KT02771$10.00
(286)
Vegetables Keynote Template Agriculture - Instant DownloadID: #KT02771$10.00 (800)
Vector Vegetables Keynote Template for Presentation | DownloadID: #KT02770$12.00
(800)
Vector Vegetables Keynote Template for Presentation | DownloadID: #KT02770$12.00 (775)
Ripe Apple Keynote Themes - Presentation TemplateID: #KT02751$12.00
(775)
Ripe Apple Keynote Themes - Presentation TemplateID: #KT02751$12.00 (312)
Crop Yield Keynote Templates - ThemesID: #KT02733$12.00
(312)
Crop Yield Keynote Templates - ThemesID: #KT02733$12.00 (739)
Agriculture Conference Keynote templates - ThemesID: #KT02692$12.00
(739)
Agriculture Conference Keynote templates - ThemesID: #KT02692$12.00 (351)
Orchard and Garden: Useful Advice Keynote template for PresentationID: #KT02595$12.00
(351)
Orchard and Garden: Useful Advice Keynote template for PresentationID: #KT02595$12.00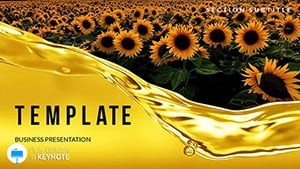 (242)
Sunflower Oil Production Keynote templatesID: #KT02591$12.00
(242)
Sunflower Oil Production Keynote templatesID: #KT02591$12.00 (976)
Vegetables Keynote Template - Fully Editable | ImagineLayoutID: #KT02553$10.00
(976)
Vegetables Keynote Template - Fully Editable | ImagineLayoutID: #KT02553$10.00
Presenting Agriculture and Animal Data With Impact
A sustainable farming coordinator pitches a new irrigation system to the co-op board. The meeting is tomorrow and the yield projections must show water savings clearly. The eco-friendly growth layout places timelines and savings cubes side by side so the numbers stand out first.
A veterinarian prepares clinical findings for a livestock conference. The audience expects visuals of health trends across 300 animals. The vitamin E foods template keeps comparison tables aligned so the audience sees improvement patterns without extra explanation.
An agribusiness analyst compiles quarterly crop reports for investors. The deliverable includes geographic maps and growth pyramids. The vegetables and greengrocery layout already stores the map scale so every region appears consistent.
A pet rescue organization shows adoption statistics at a community event. The data spans six months of dog and cat placements. The pet dog layout uses the same icon set across slides so the story flows without re-creating graphics.
What You Lose When Building Farm Presentation Slides Manually
You lose the morning choosing consistent crop icons and color codes for soil types. You lose alignment time when updating growth timelines across fifteen slides. The chart palette drifts from the brand green used in last quarter`s report.
Workflow for Recurring Agriculture Reports
Store reusable growth dashboards on the slide master so quarterly updates require only data swaps. Keep livestock icons grouped so one edit refreshes every instance in the deck. The structure carries forward to the next fiscal year without rebuilding.
Non-Obvious Editing Advice for Agriculture Visuals
Lock the background soil texture layer before editing foreground data bars. This prevents accidental shifts when swapping harvest numbers. The locked layer also survives PDF export for printed field handouts.
Keynote Technical Notes for These Files
Use 16:9 aspect ratio for wide geographic maps common in agriculture decks. Embedded fonts ensure the same type appears when the file travels to Windows viewers. Export to PDF with vector graphics checked so crop icons stay sharp at any zoom.
Why This Collection Works for Agribusiness
Layouts focus on functional data hierarchy rather than decorative farm illustrations. Every template allows instant number updates without breaking the visual balance. The files stay compact for sharing with remote field teams.
Selecting Companion Templates
When your deck also tracks logistics from field to market, add our cars keynote templates for delivery visuals. For training new farm staff, the education and training brochures templates give matching print materials. If metrics dominate, combine with cubes Keynote charts templates for yield comparisons.
Open the agriculture template that matches your next presentation.
Are these templates compatible with current Keynote?
Yes, built in native .key format and tested on Keynote 13 through the 2026 release. Older versions may need one click to refresh map overlays. The slide master stays open for quick color changes and PDF exports keep vector crop icons crisp.
Can multiple team members edit the same file?
One license covers one user account. For shared farm office use, each editor needs their own copy. The files contain fully editable shapes so changes to livestock icons or yield tables stay consistent when merged later.
Do the files export well to PDF for field use?
PDF export retains embedded fonts and vector graphics so maps and animal icons stay sharp when printed on site. Turn off animations before export to keep file size small for tablet viewing in the field.
How do I update growth timeline data?
Open the linked table on any timeline slide and paste new harvest numbers directly. The bars and pyramid heights adjust automatically while keeping the agriculture color theme. Save the source spreadsheet with the .key file for next season`s update.