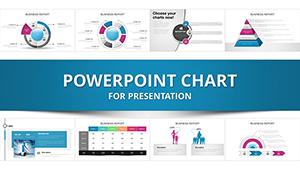
Navigating risks and gambles in business or gaming requires precise visualization, and our PowerPoint chart templates for risk and gamble themes make it straightforward. These specialized designs focus on charts that decode probabilities, impacts, and mitigation paths, ideal for strategists, project managers, and gaming enthusiasts crafting data-driven narratives.
Whether analyzing market volatilities or betting odds, these templates offer a suite of matrices, radars, and heat maps that transform raw data into actionable intelligence. Built for PowerPoint`s robust charting engine, they ensure seamless updates and professional renders, saving you from tedious manual alignments.
Empower your presentations with clarity that cuts through complexity. From corporate boardrooms to casino strategy sessions, these charts elevate discussions and decisions. Scroll through our selection to pinpoint the visual tool that sharpens your risk perspective.


In high-stakes environments, where every decision teeters on uncertainty, effective charting is your edge. Our risk and gamble PowerPoint chart templates distill multifaceted data into intuitive visuals, from probability distributions to reward matrices. Tailored for scenarios like portfolio hedging or poker probability models, they facilitate deeper analysis without sacrificing accessibility.
Imagine plotting a venture`s downside risks against upside potentials in a single quadrant chart - our templates automate this, with color-coded zones signaling alert levels. This not only streamlines preparation but also amplifies audience comprehension during reviews, turning potential skeptics into advocates.
Such capabilities make these charts indispensable for iterative planning, where agility meets accuracy.
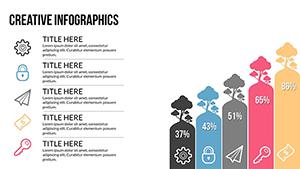
Financial traders deploy these for volatility heat maps, overlaying historical trades with forecast bands to gauge entry points. In project management, Gantt-derived risk timelines highlight bottleneck gambles, like supplier delays. Gaming developers visualize player retention risks through funnel charts, identifying drop-off triggers in bet mechanics.
Insurance firms model claim probabilities with bell curve overlays, while sports bettors craft odds comparison radars. Educational workshops use simplified versions for teaching decision theory, pairing charts with case studies. This breadth demonstrates the templates` adaptability across professional and recreational domains.
A hedge fund analyst at RiskVentures used our "Gamble Gauge" chart set to map forex pair risks, incorporating Monte Carlo simulations visualized in scatter plots. The result? A 25% reduction in drawdowns post-implementation. This case illustrates how targeted charting uncovers hidden patterns in gamble-laden datasets.
Default PowerPoint charts handle basics like pie slices but stumble on layered risk depictions, often requiring clunky workarounds for multi-axis views. Our pre-configured variants include conditional formatting for threshold breaches - red flagging high-impact gambles automatically - sparing hours of conditional logic setup.
Additionally, they support thematic styling, such as casino-inspired motifs for gamble themes, infusing personality without compromising professionalism. The outcome: visuals that engage and inform, far beyond vanilla outputs.
Prioritize data hygiene: validate inputs before charting to avoid garbage-in-garbage-out pitfalls. Layer insights progressively - start with overviews, drill into details via hyperlinks. For gamble elements, incorporate sensitivity analyses, showing how variable tweaks alter trajectories.
Enhance with annotations: callouts on peak risks foster dialogue. Export to interactive PDFs for stakeholder self-exploration. These tactics, embedded in our designs, forge charts that not only depict but dictate strategic directions.
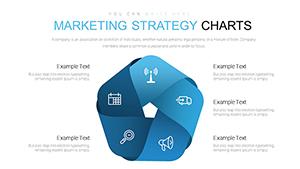
A mix of matrices, radars, heat maps, and flowcharts optimized for risk probability and impact assessment.
Yes, seamless links to Excel, CSV, or SQL exports for dynamic, real-time updates.
Definitely - adapt for sports betting, game design, or project uncertainties with ease.
Apply theme colors globally via the design tab, with auto-matching for data series.
Yes, built-in entrance effects for elements like risk bars to build narrative tension.
Chart your path through uncertainties - select and download a risk gamble chart template today. Illuminate decisions with visuals that reveal opportunities amid the odds.
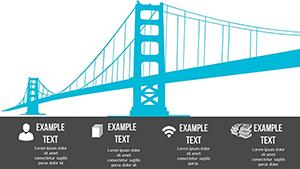
Expand your toolkit with complementary infographics from our library, and explore user stories showcasing transformative applications in volatile markets.
Copyright © 2009-2026 ImagineLayout All rights reserved.