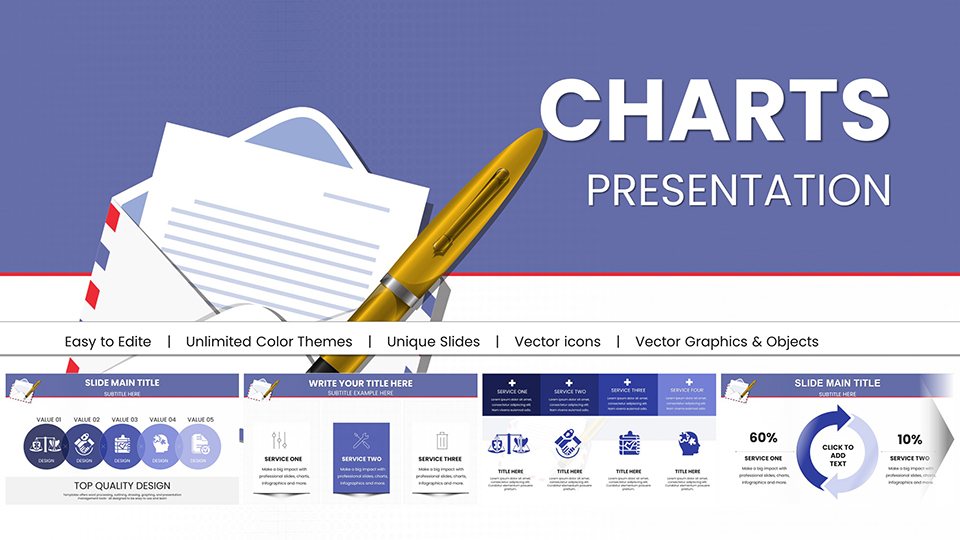
Sustainable Development PowerPoint Charts: Inspire Eco-Innovation


Picture a presentation where your commitment to the planet shines through every slide, fostering a sense of calm confidence among your audience. Our Sustainable Development PowerPoint Charts template does just that, with 37 editable slides tailored for those championing green initiatives. From environmental consultants to corporate sustainability officers, this tool turns data on renewable energy or conservation efforts into compelling stories.
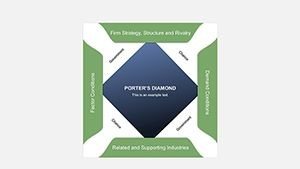
Available in .pptx for effortless PowerPoint integration, it's priced at $25 - a small step toward big environmental impacts. Drawing on frameworks like the UN Sustainable Development Goals (SDGs), these charts help you align visuals with global standards, making your pitches not just informative but authoritative. Forget chaotic slides; here, serene colors and animations guide viewers through complex topics like carbon footprints or biodiversity metrics.
Embracing Green Design Principles
Sustainability isn't just a theme - it's woven into the fabric of this template. Charts evoke nature's balance, using earthy palettes that promote focus without overwhelming. For green architecture firms, illustrate building efficiency ratings or lifecycle assessments, complying with LEED certifications for credible presentations.
Animations add subtle energy, revealing data points like growing trees in a timeline, symbolizing progress. This approach, inspired by eco-design experts like William McDonough, ensures your message resonates long after the meeting ends.
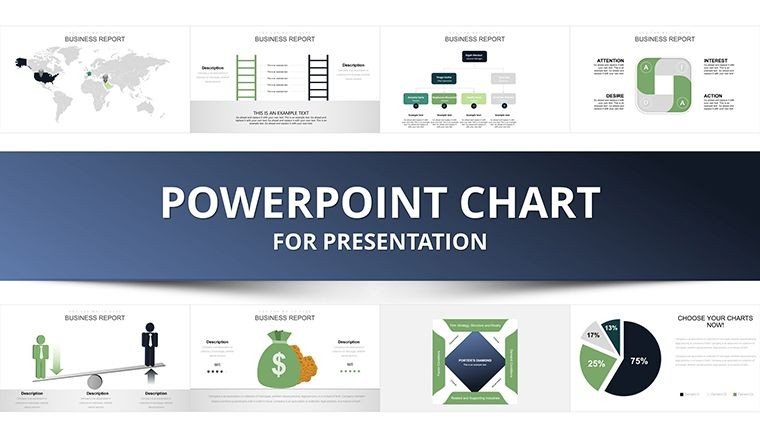
Standout Features for Eco-Focused Presentations
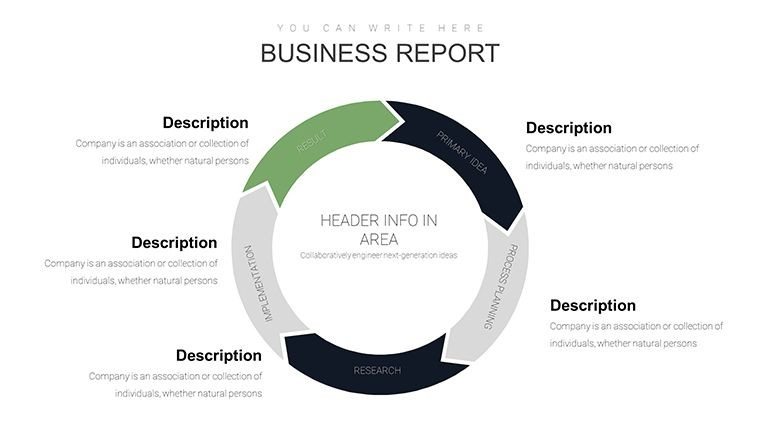
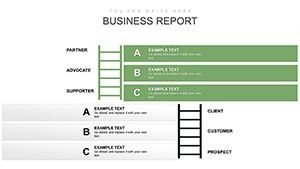
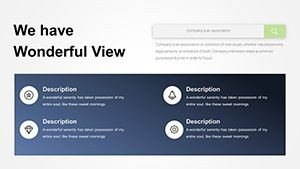
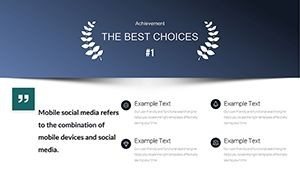
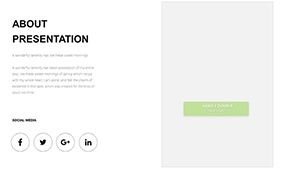
- Calm Color Schemes: Soft greens and blues create a trusting atmosphere, ideal for sensitive topics like climate action.
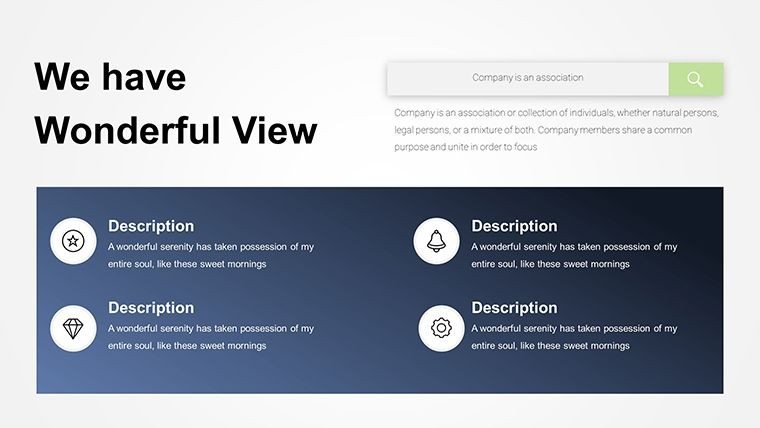
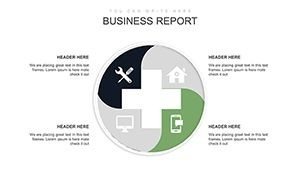
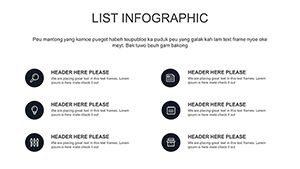
- Animated Graphs: Dynamic reveals keep energy high without excess - think fading in SDG icons for emphasis.
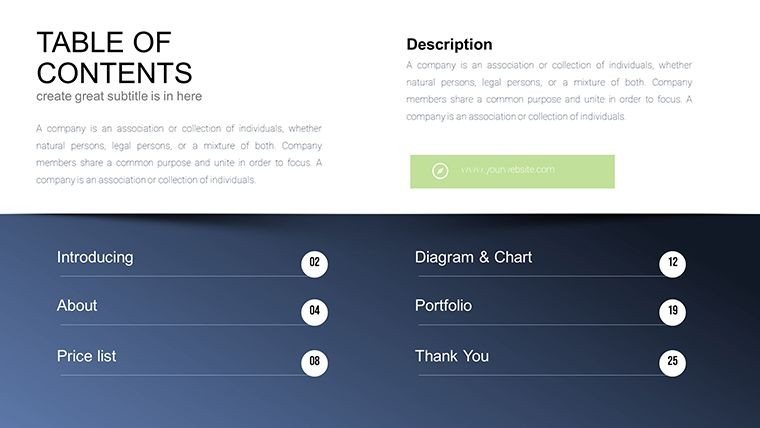
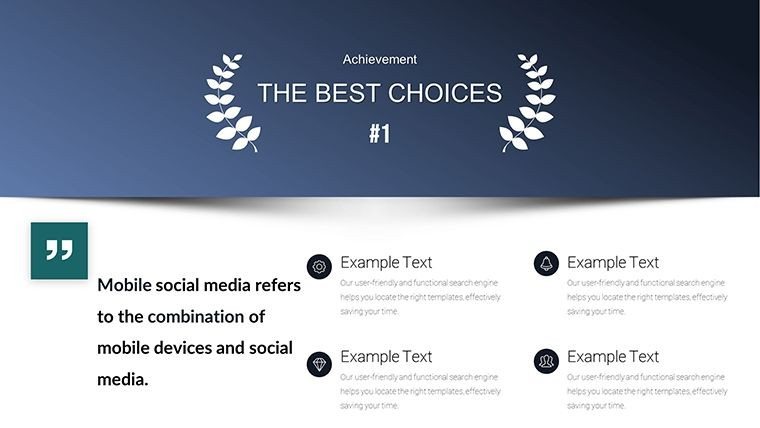
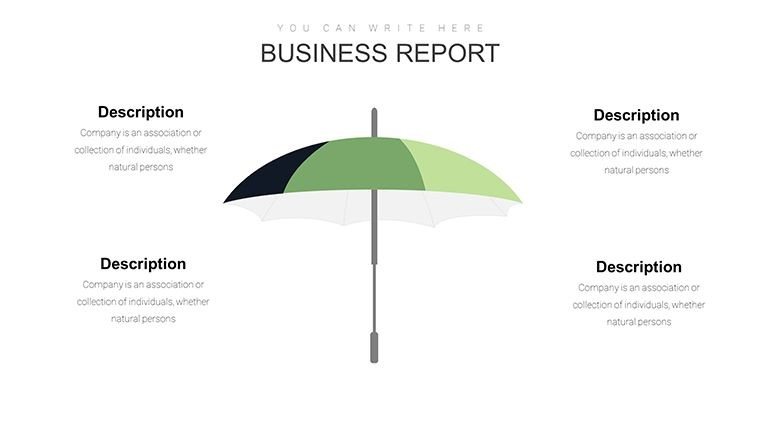
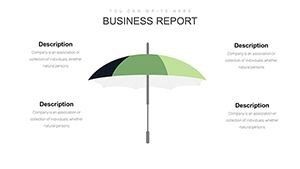
- Customizable Backgrounds: Switch from minimalist to detailed eco-patterns to match your narrative's tone.
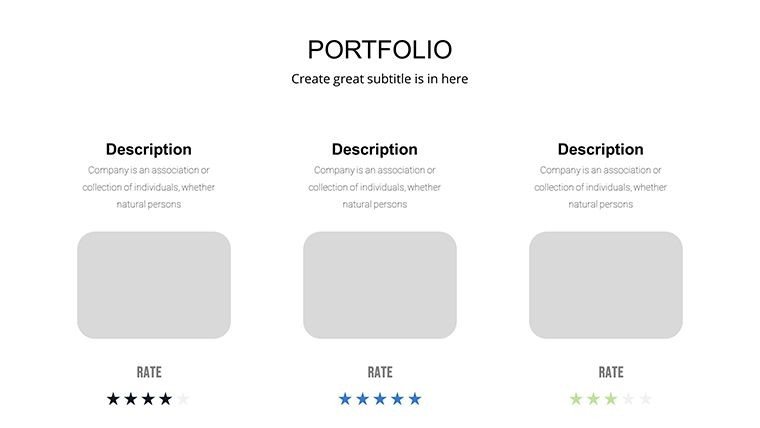
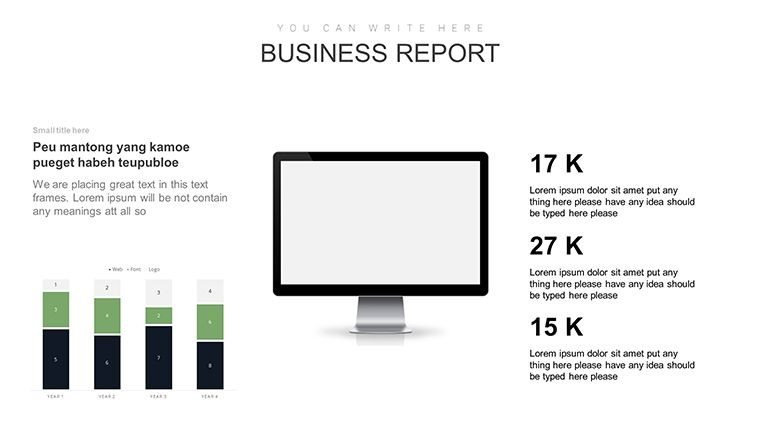
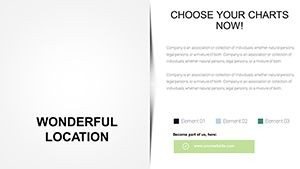
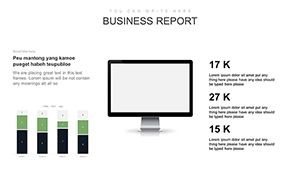
- Large Font Headings: Bold, wide text draws eyes to key metrics, enhancing readability in large rooms.
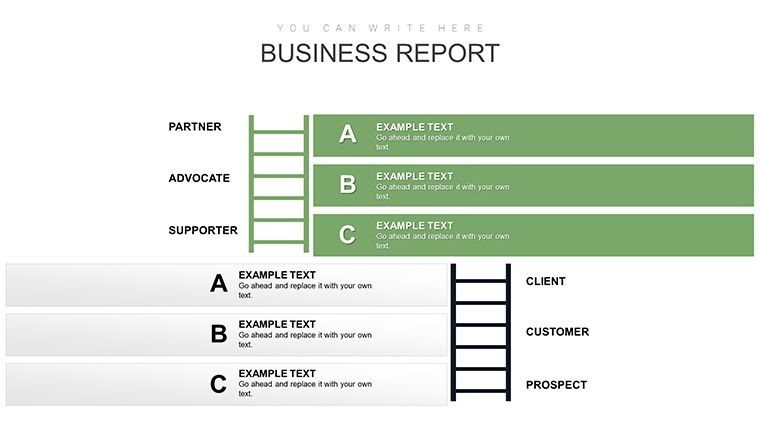
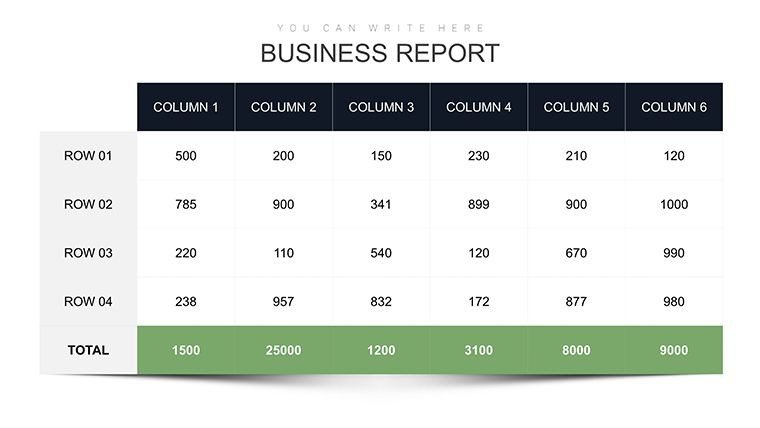
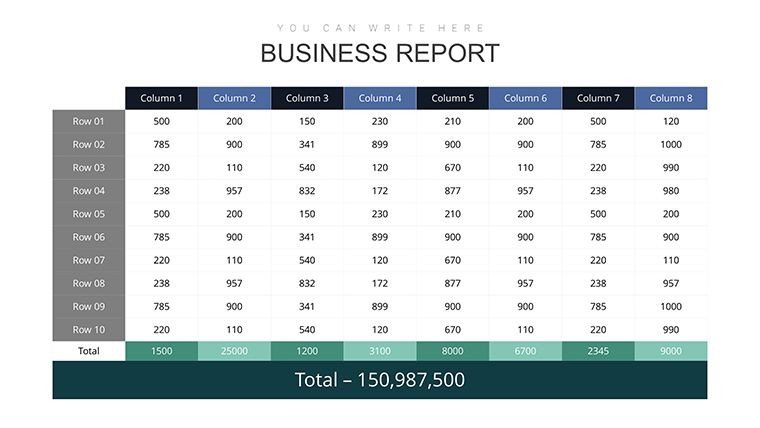
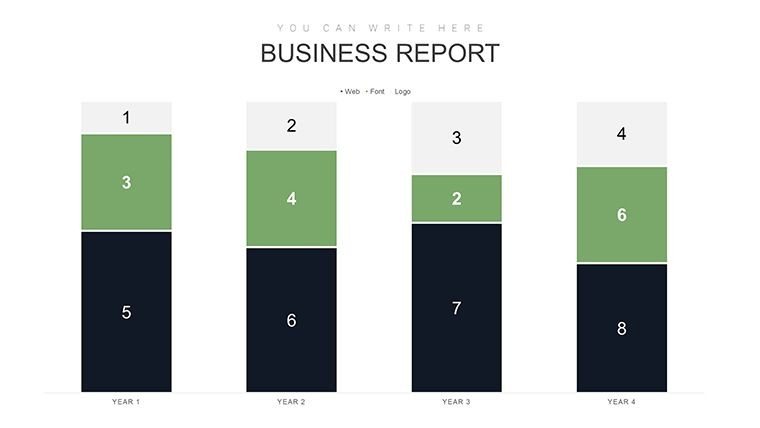
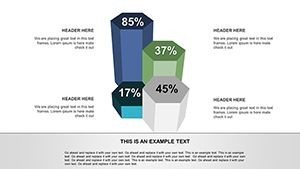
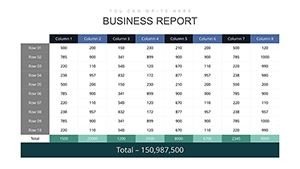
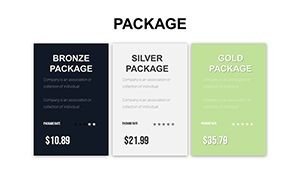
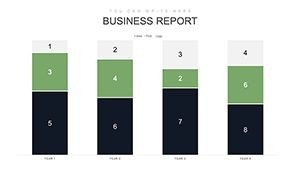
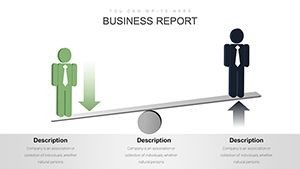
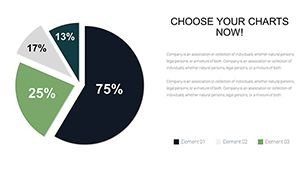
- Data Tables: Built-in for analysis, supporting comparisons like pre- and post-sustainability implementations.
A real example: An NGO used similar charts to present reforestation data, securing funding by clearly showing impact metrics aligned with SDG 15 (Life on Land).
Applications in Sustainable Sectors
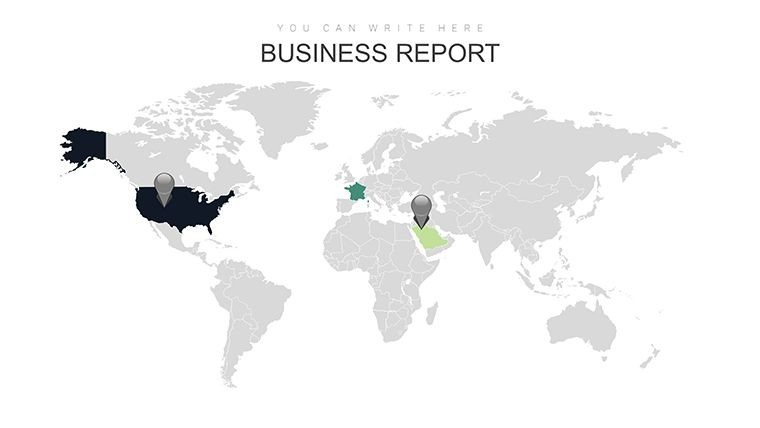
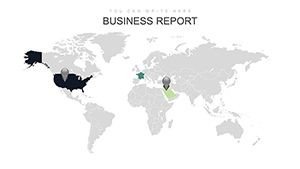
This template thrives in fields pushing for change. In urban planning, map out sustainable city models - charts for waste reduction or green space allocation. Educators can break down SDGs for students, using visuals to spark discussions on global challenges.
Corporate teams? Track ESG (Environmental, Social, Governance) progress with line graphs showing emission reductions over time. A case from a renewable energy company: Their investor pitch, enhanced by these calm visuals, led to a 20% increase in partnerships, as the professional yet approachable design built trust.
Workflow: Building Your Sustainable Narrative
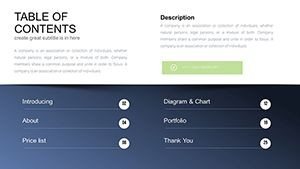
- Choose Your Focus: Select slides aligned with specific SDGs - e.g., water conservation charts.
- Integrate Data: Import figures from Excel; the template auto-adjusts scales for accuracy.
- Tailor Visuals: Adjust animations for pace - slow reveals for thoughtful topics like biodiversity loss.
- Enhance with Fonts: Use wide headings for impact; pair with sans-serif for modern eco-vibes.
- Test Accessibility: Ensure color contrasts meet standards, broadening your reach.
- Deliver and Inspire: Present knowing your visuals support a greener future.
Versus standard PowerPoint, this offers themed coherence, saving design time while amplifying eco-messages.
The Authority Behind Sustainable Visuals
Rooted in expertise from sustainability reports like those from the IPCC, this template provides trustworthy tools. No fluff - just functional beauty that aids decision-making. For instance, incorporate real-time data visualizations for live demos, impressing stakeholders with relevance.
Trust comes from seamless downloads and compatibility, including Google Slides for collaborative green teams. Ready to lead the charge? Grab this template and turn your vision into actionable insights.
In policy advocacy, use for impact assessments; in business, for CSR reports. The user focus: Empowering you to communicate urgency without alarm, fostering positive change.
Expert Tips for Green Presentations
Layer data ethically - avoid greenwashing by citing sources like UN reports. Use animations sparingly to maintain calm; test on eco-audiences for feedback. For architecture, blend with BIM data for holistic views.
Integration tip: Link slides to external tools like Tableau for advanced analytics, enhancing depth without complexity.
This template bridges data and action, helping you craft presentations that not only inform but motivate toward sustainability. Step up your eco-game today.
Frequently Asked Questions
How do I customize the backgrounds?
Easily swap images or colors via PowerPoint's design tools; options include eco-textures for thematic depth.
Are the animations resource-intensive?
No, they're lightweight, ensuring smooth playback even on standard laptops.
Can this align with specific SDGs?
Yes, slides are flexible for any of the 17 goals, with icons to match.
Is it suitable for virtual presentations?
Absolutely - high-res visuals shine in Zoom or Teams.
What data formats are supported?
Excel, CSV, or manual input; integrates seamlessly.