Mastering Technical Analysis: PowerPoint Charts for Informed Trading Decisions


Type: PowerPoint Charts template
Category: Analysis
Sources Available: .pptx
Product ID: PC00924
Template incl.: 41 editable slides
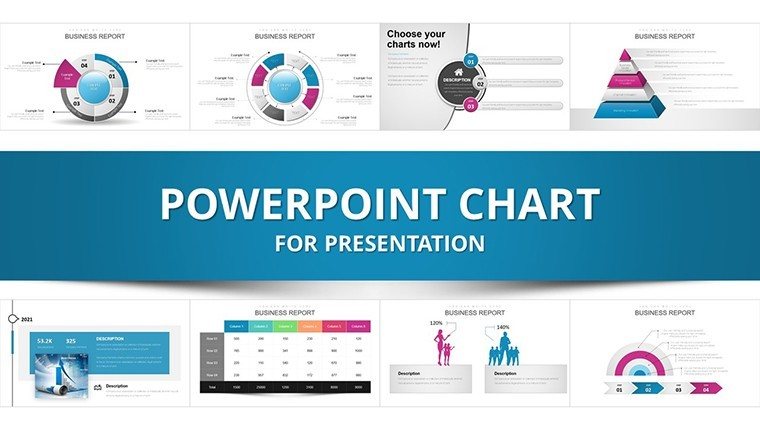
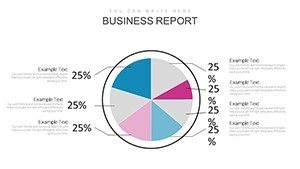
In the volatile realm of finance, where split-second decisions can yield fortunes or losses, having robust tools to decode market behaviors is indispensable. Our Mastering Technical Analysis PowerPoint Charts Template equips investors, traders, and analysts with 41 editable slides dedicated to graphical financial data representation. From line charts tracking price trajectories to candlestick patterns revealing sentiment shifts, this .pptx resource simplifies the art of forecasting, drawing on time-tested indicators to turn data chaos into strategic clarity.
Grounded in principles from pioneers like John Murphy's technical analysis classics, this template helps identify trends that predict movements, as evidenced in real trades where RSI divergences signaled reversals. Whether analyzing stocks, forex, or commodities, it addresses pain points like data overload by providing clean, insightful visuals that facilitate profitable strategies.
Essential Features for Precision Analysis
Crafted for accuracy and ease, the template's features empower users to customize deeply:
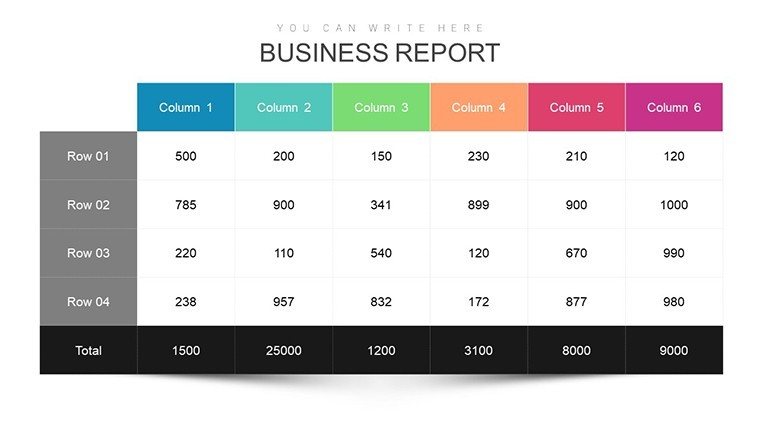
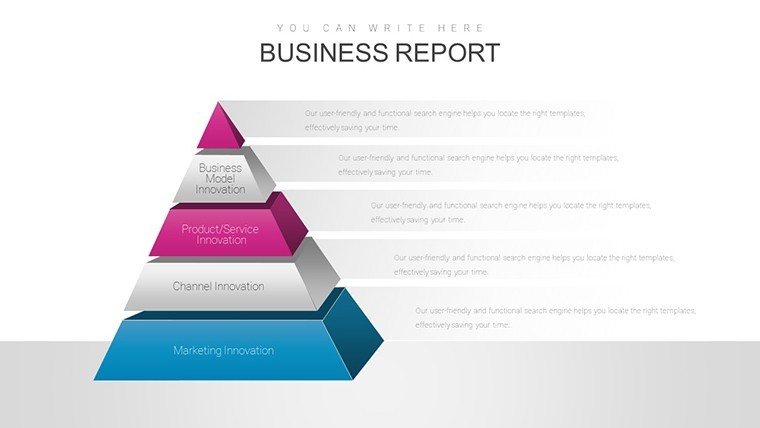
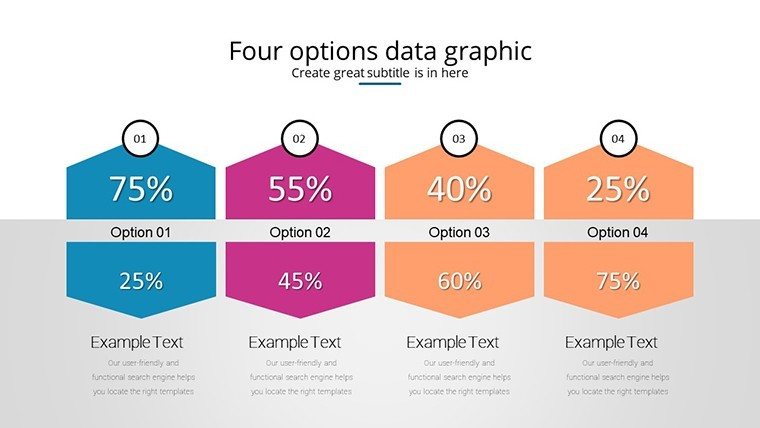
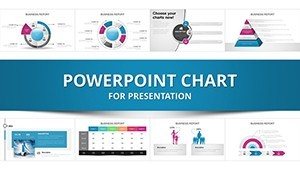
- Chart Types Galore: Line, bar, and candlestick charts, each with layers for volume overlays.
- Indicator Integration: Built-in moving averages, Bollinger Bands, and RSI for comprehensive scans.
- Editable Elements: Adjust scales, colors, and annotations to highlight key patterns like head-and-shoulders.
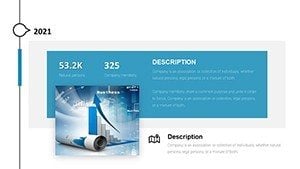
- Data Compatibility: Import from CSV or Excel for real-time historical analysis.
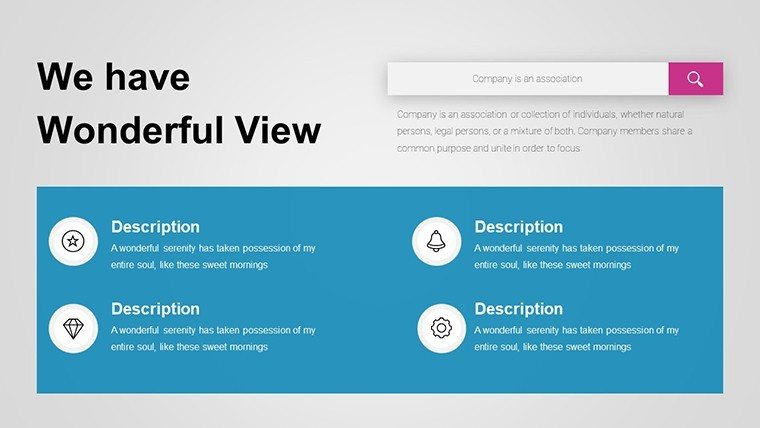
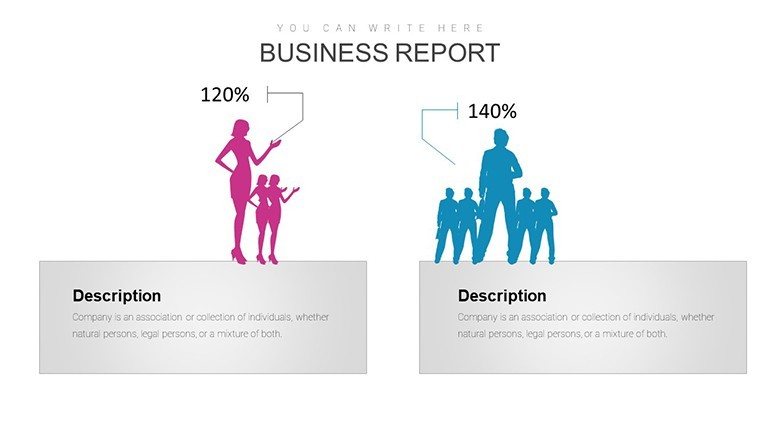
- Professional Layouts: High-res designs suitable for reports or live trading sessions.
These align with CFA standards for financial visualization, ensuring authoritative outputs that build credibility in presentations.
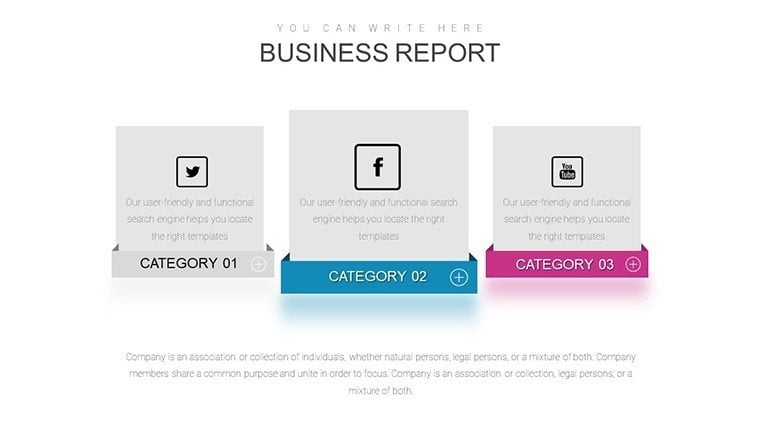
Practical Use Cases in Financial Arenas
For day traders, deploy candlestick charts to spot doji patterns indicating indecision, as in a recent crypto rally where such signals preceded 20% gains. Analysts in investment firms can use bar charts with volume to validate breakouts, mirroring strategies from successful hedge funds like Renaissance Technologies.
In educational settings, instructors break down moving average crossovers for students, fostering skills that lead to certified trading expertise. A case from Investopedia highlights how Bollinger Band squeezes predicted volatility spikes in equities - apply this directly with our slides to simulate scenarios.
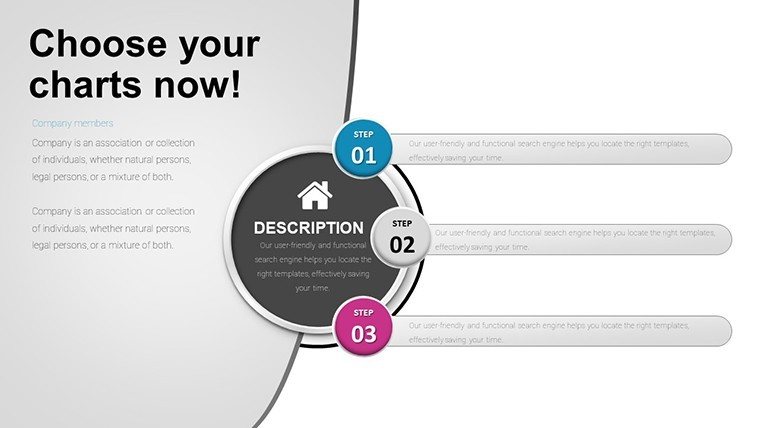
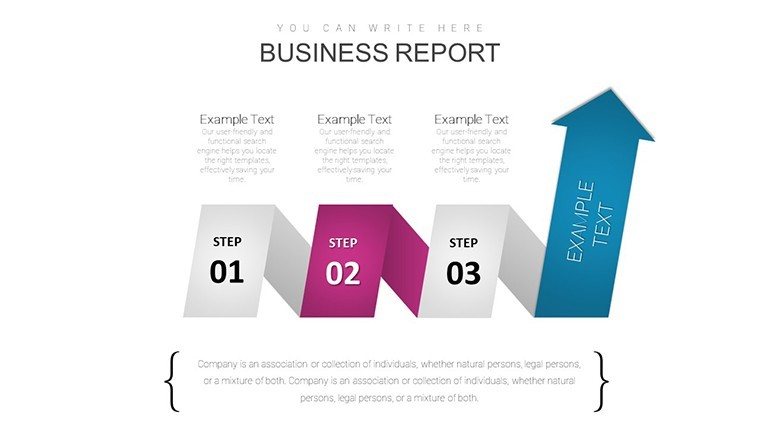
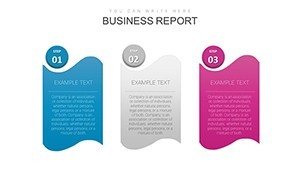
Workflow for Effective Chart Deployment
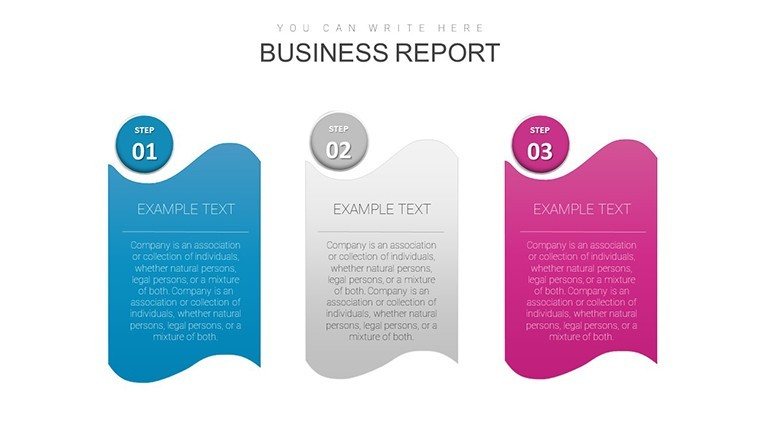
- Gather Data: Compile historical prices and volumes from reliable sources.
- Select Chart: Choose based on focus - lines for trends, bars for details.
- Apply Indicators: Overlay RSI or bands to uncover hidden insights.
- Annotate Patterns: Mark trends and predictions for clear narratives.
- Simulate and Test: Use slides to backtest strategies against past data.
- Present Findings: Share in meetings with confidence in your analysis.
This process outpaces generic tools by offering specialized financial depth, reducing misinterpretation risks.
Superiority to Basic Charting Software
Unlike PowerPoint's default options, which lack indicator depth, this template provides ready-made sophistication, saving analysis time. Inspired by TradingView's usability, it enhances with precise, trustworthy visuals. In portfolio reviews, such charts have aided decisions leading to optimized returns, per Morningstar studies.
Weave LSI like 'market sentiment indicators' organically, and suggest alts like "Candlestick chart with RSI overlay." Internal links to analysis templates boost navigation, while CTAs like "Analyze trends now" spur action.
Seize Market Opportunities Today
Arm yourself with this template to navigate financial waters adeptly. Customize for your trading style and unlock predictive power. Don't miss the edge - start mastering technical analysis now.
Frequently Asked Questions
- How editable are the indicators?
- Fully adjustable - tweak parameters like RSI periods or band deviations.
- Suitable for beginners?
- Yes, with intuitive setups, though some trading knowledge helps.
- Can I use for crypto analysis?
- Absolutely, adaptable to any asset class with volatile data.
- Compatible with Mac PowerPoint?
- Yes, seamless on both Windows and macOS.
- What data sources work best?
- Excel, Yahoo Finance exports, or direct CSV imports.
- Difference from stock software?
- Focused on presentation-ready visuals for sharing insights.