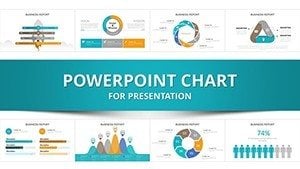
Create Stunning Success Charts for PowerPoint Presentations


Type: PowerPoint Charts template
Category: Analysis
Sources Available: .pptx
Product ID: PC00927
Template incl.: 38 editable slides
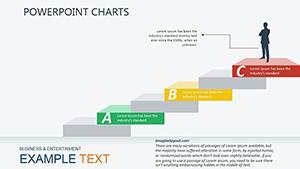
Success in business often boils down to how well you communicate achievements. Whether you're showcasing quarterly wins or long-term milestones, the right visuals can turn numbers into narratives that inspire action. Our Success Charts PowerPoint template is your gateway to that power. Boasting 38 editable slides, it's engineered for professionals who need to simplify complex data into digestible, visually striking formats. Ideal for analysts, executives, and educators, this template transforms raw stats into stories of triumph.
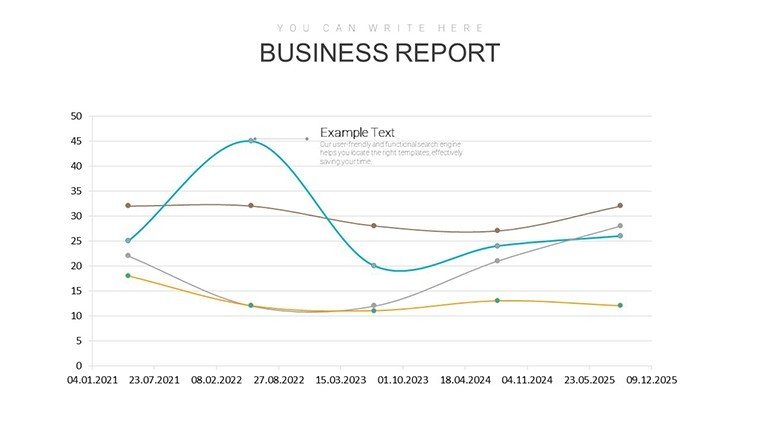
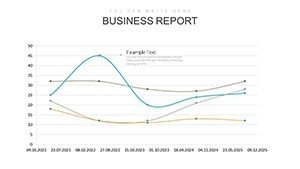
Rooted in data visualization expertise - echoing principles from experts like Stephen Few - this template prioritizes clarity over clutter. Envision presenting a project milestone: A vibrant line chart traces progress, flanked by icons representing key successes. The audience nods in understanding, energized by the clear path forward. That's the magic here, making it indispensable for high-stakes environments where every slide counts.
Essential Features for Data-Driven Success
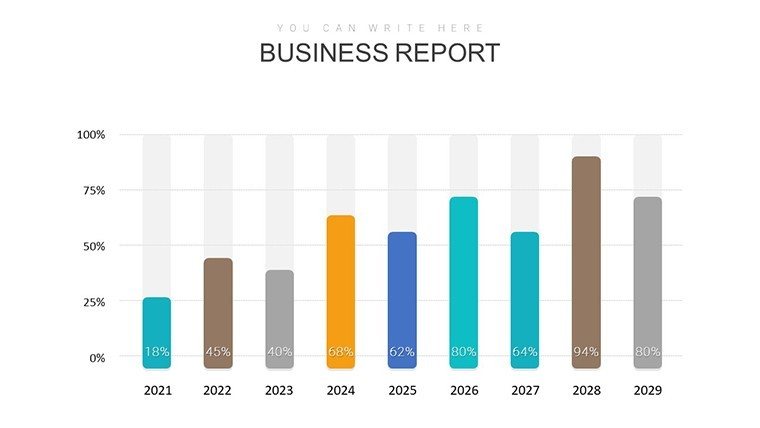
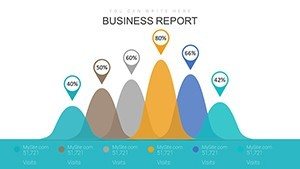
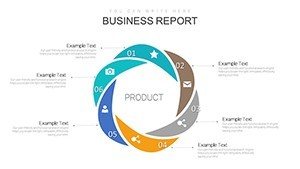
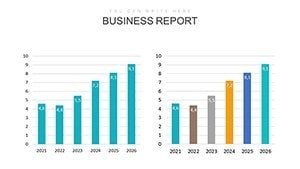
What elevates this template? It's the thoughtful integration of features that cater to real analytical needs. With 38 slides, you get a comprehensive toolkit: from basic bar charts for quick comparisons to advanced area graphs for trend analysis. Everything is fully customizable - tweak hues to evoke positivity, like greens for growth, or add animations for dynamic reveals.
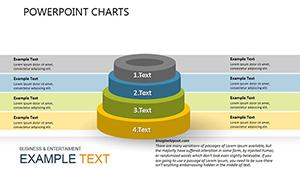
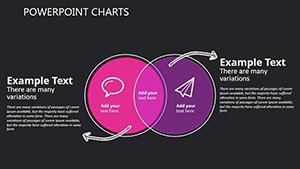
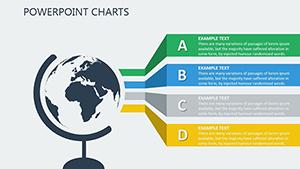
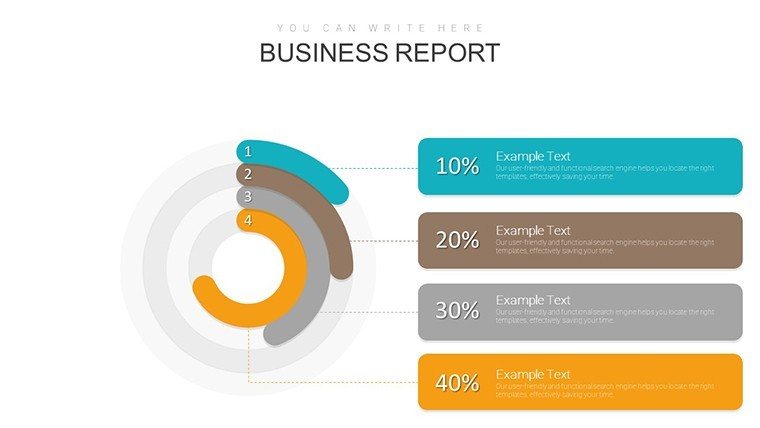
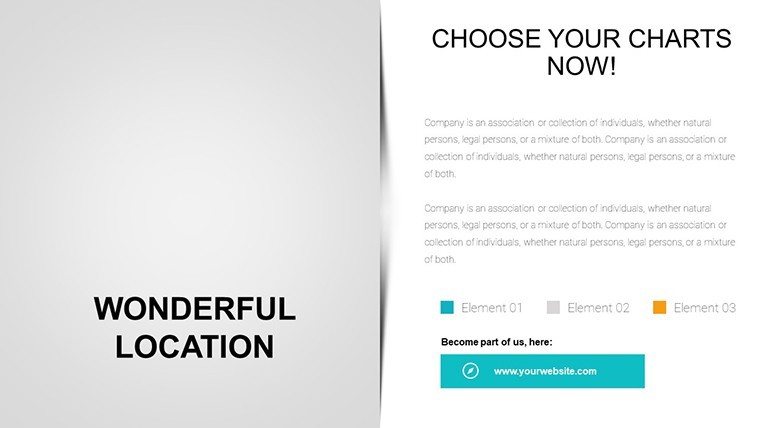
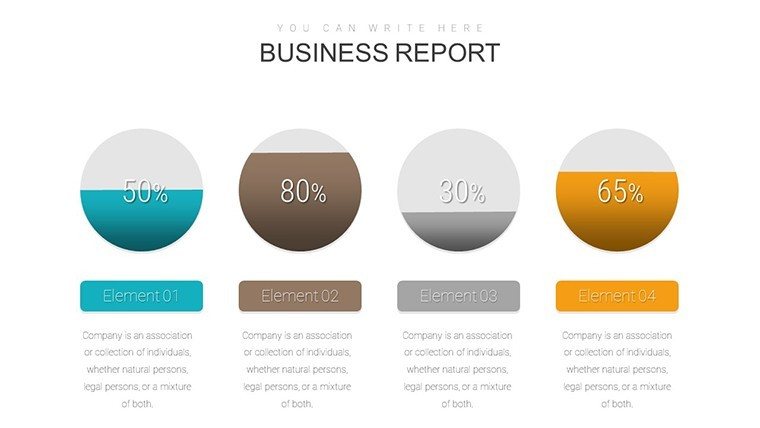
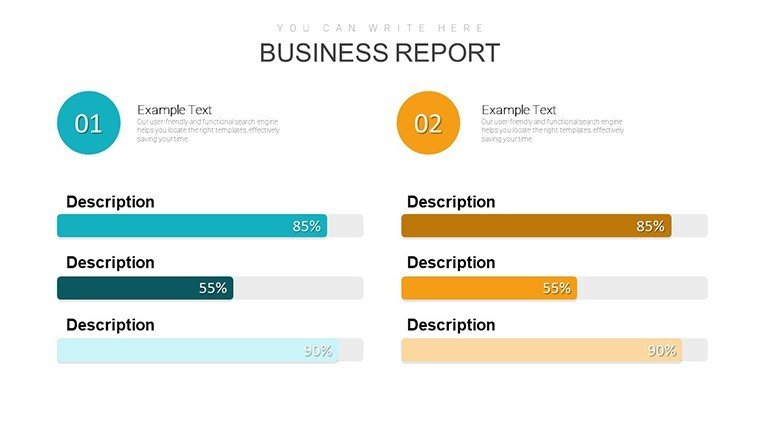
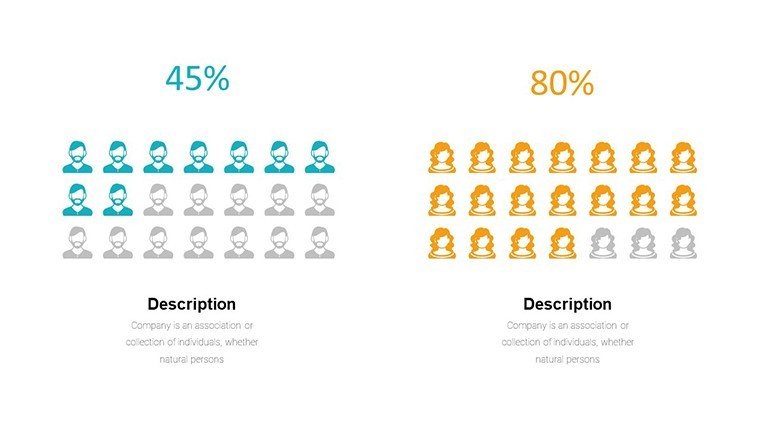
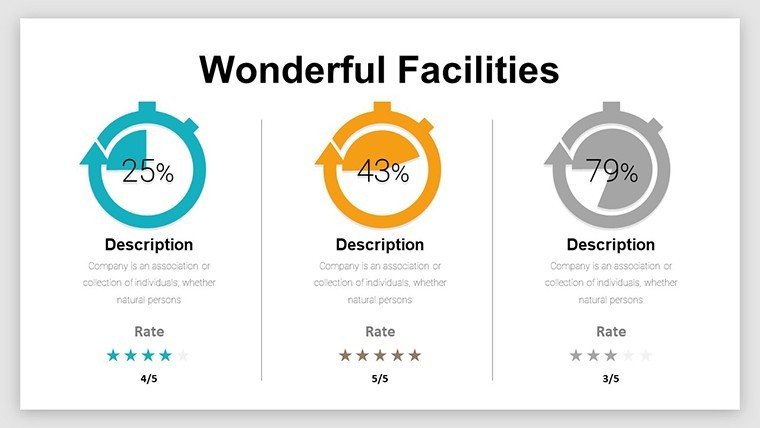
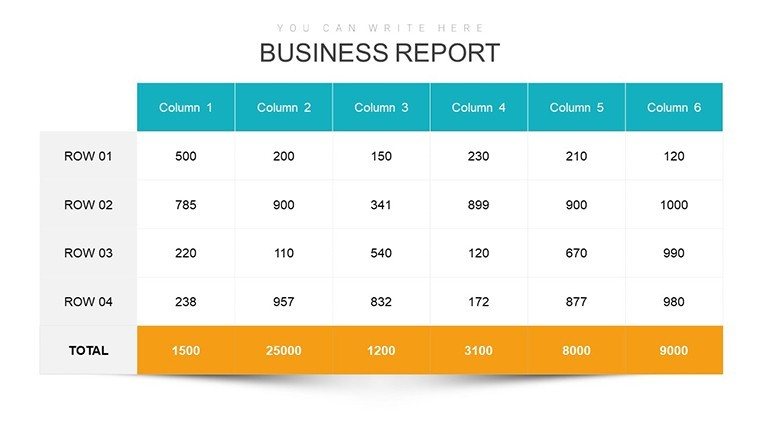
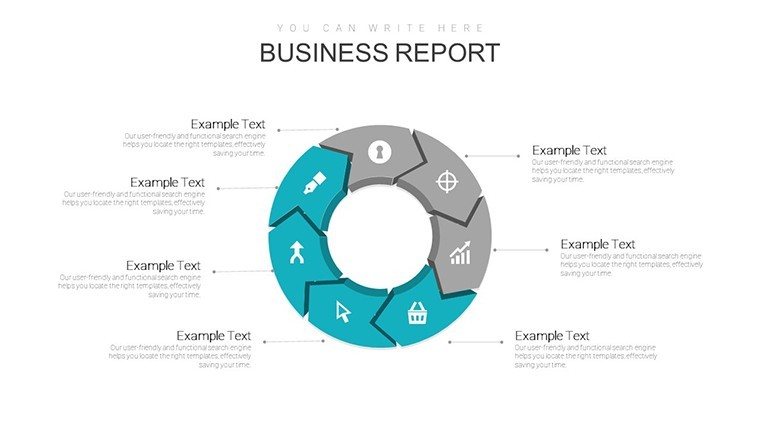
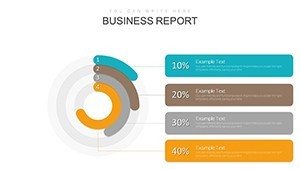
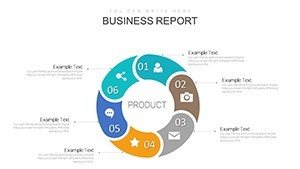
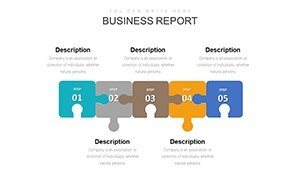
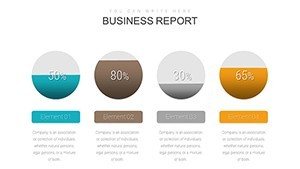
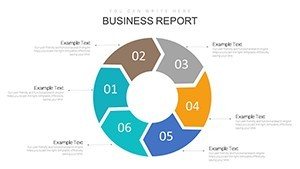
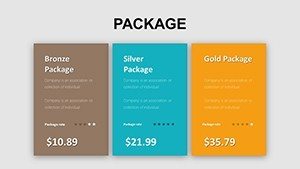
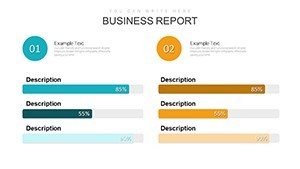
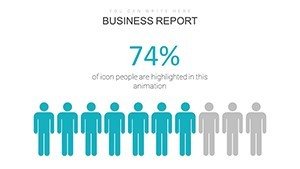
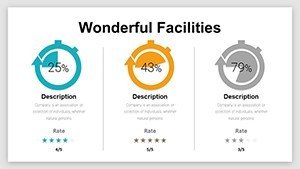
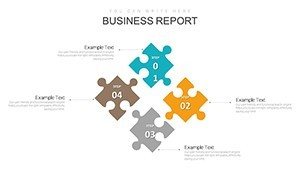
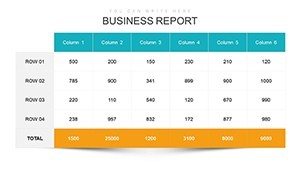
- Diverse Chart Options: Pie charts for percentage breakdowns, scatter plots for correlations, and more.
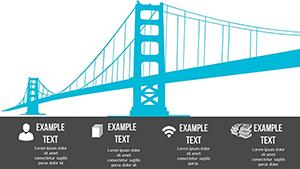
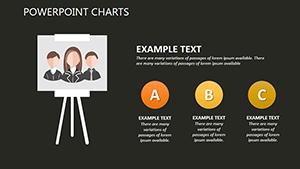
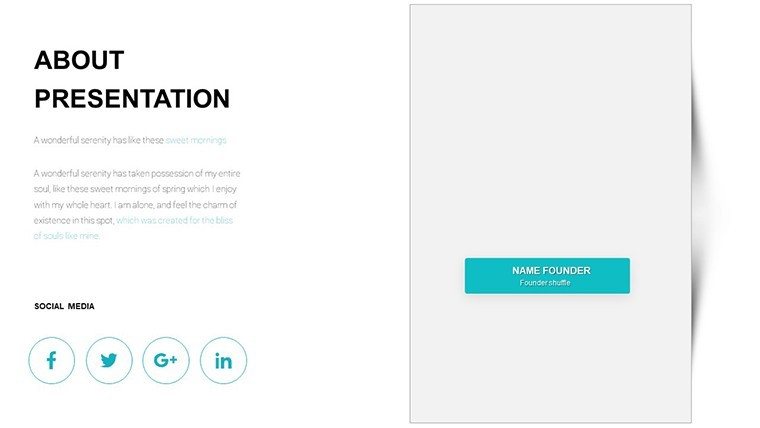
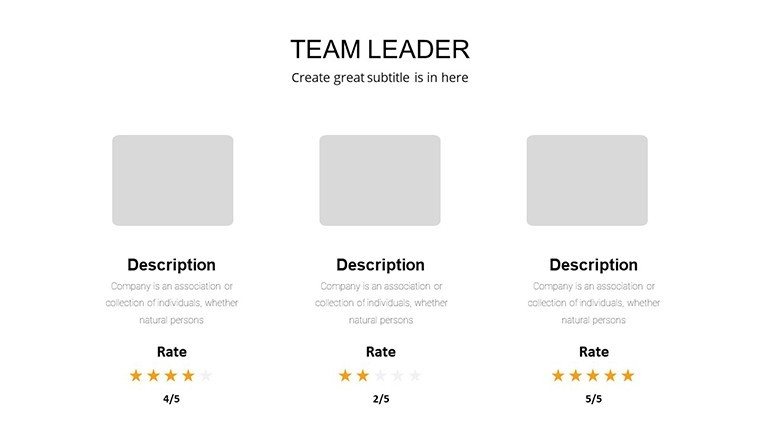
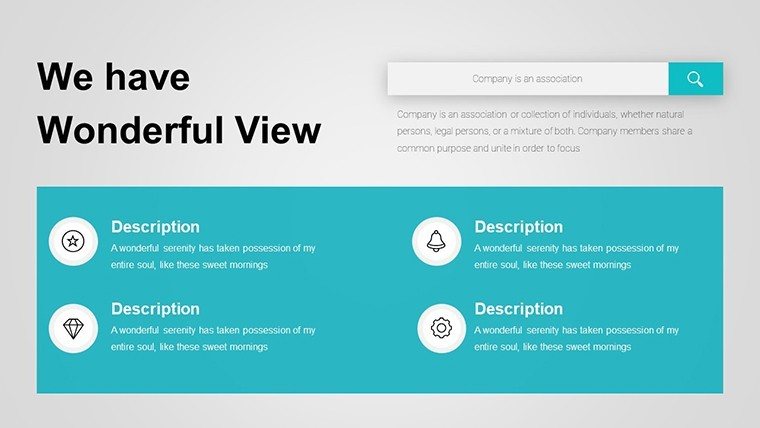
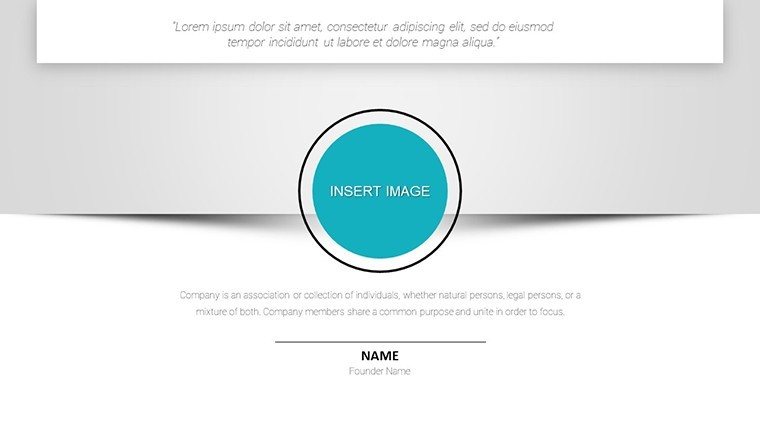
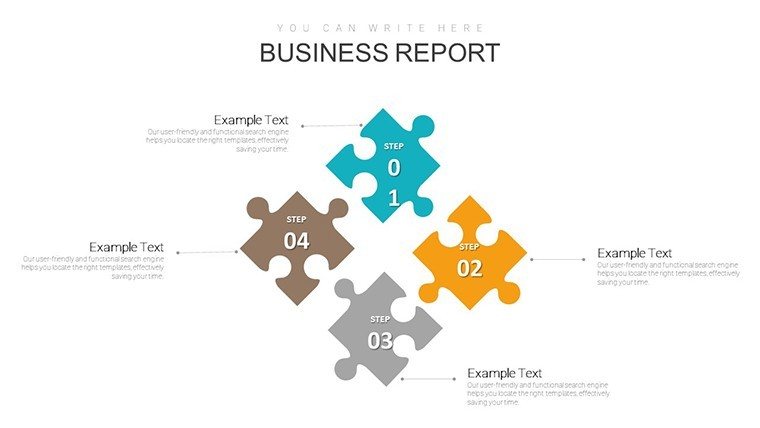
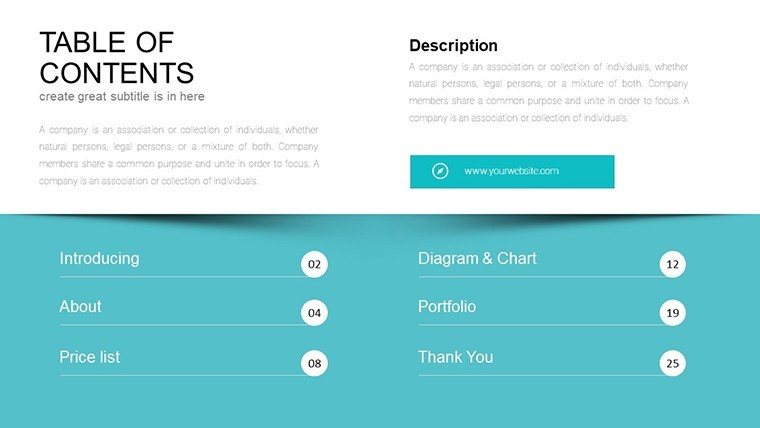
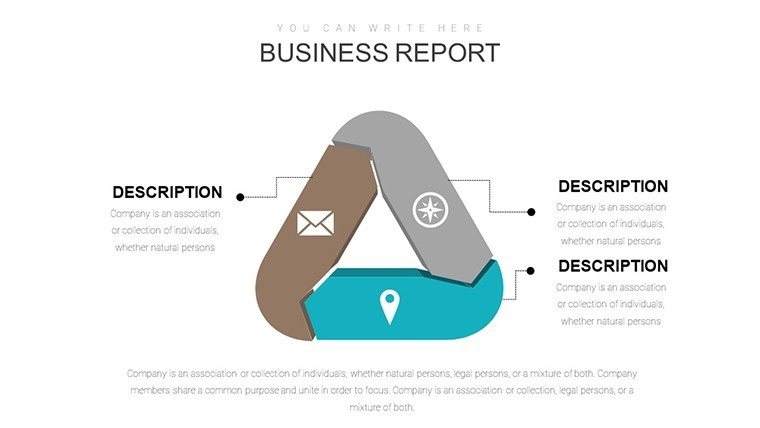
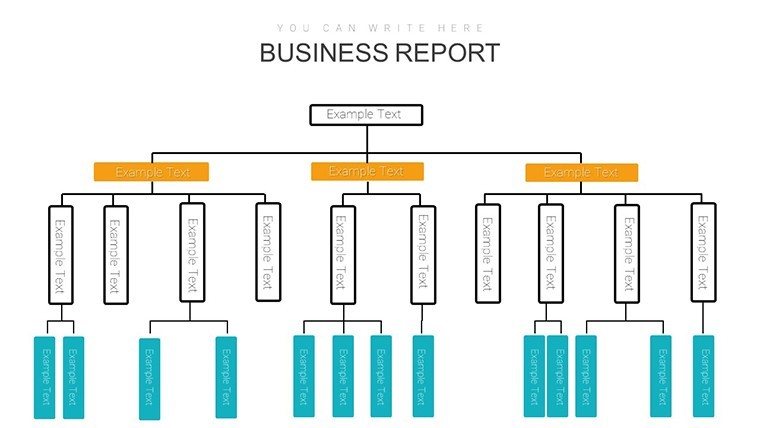
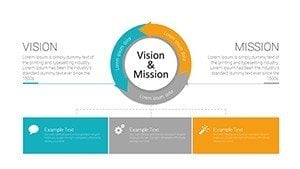
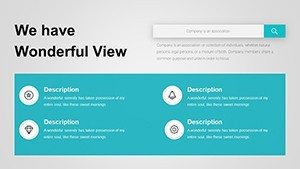
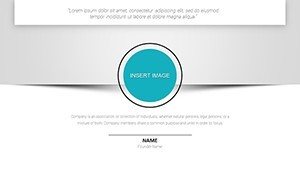
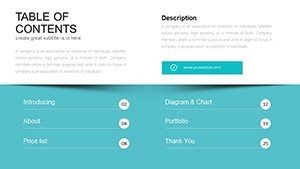
- Storytelling Elements: Integrated text boxes and callouts to weave narratives around your data.
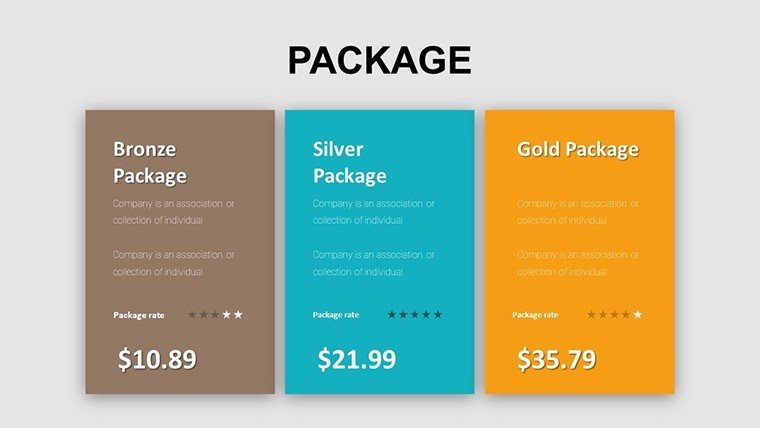
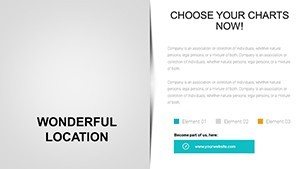
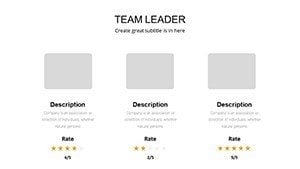
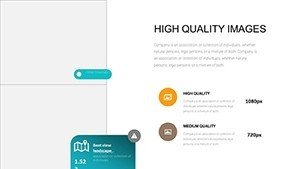
- Brand Alignment: Easy insertion of logos and color schemes for a polished, consistent look.
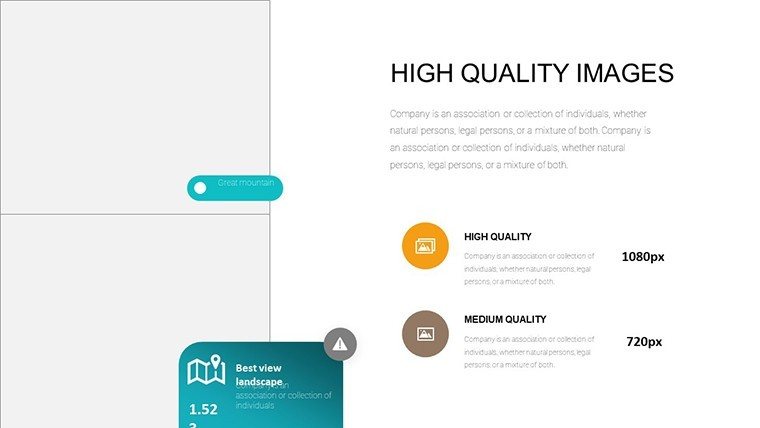
- Resolution-Ready: High-quality vectors ensure crisp displays on any device.
User-friendliness is key; no design degree required. Drop in your data, and the charts auto-adjust, saving precious time amid tight deadlines. This efficiency is a game-changer for busy professionals juggling multiple reports.
Practical Use Cases and Tangible Benefits
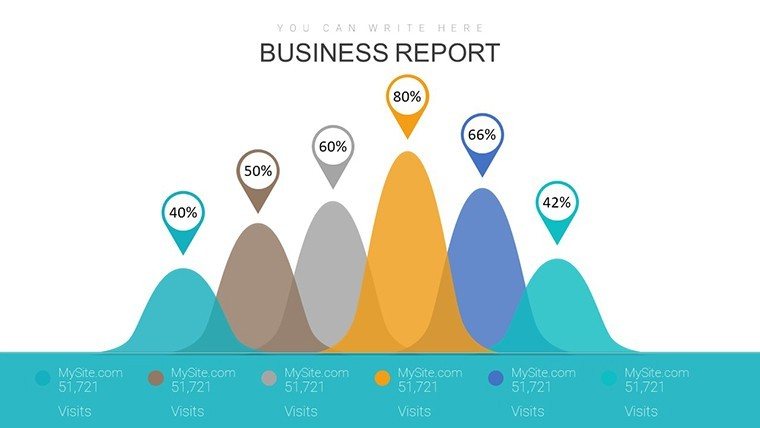
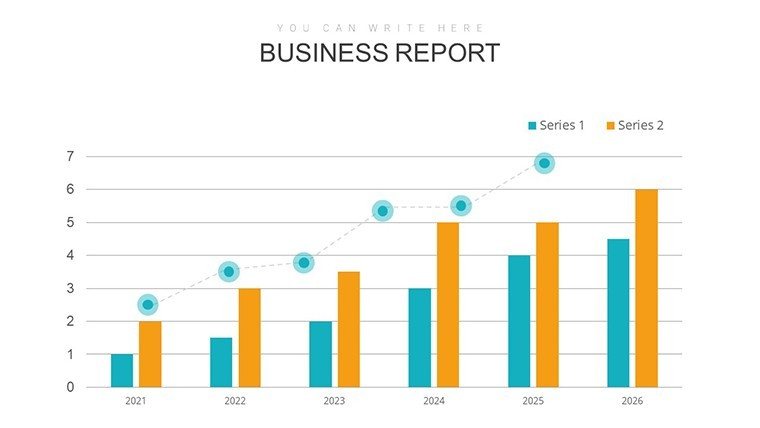
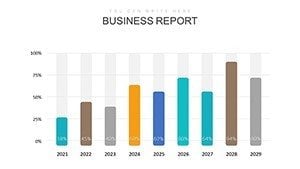
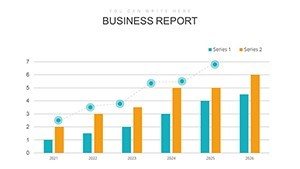
Apply this template across scenarios. In a business review, use success charts to highlight revenue spikes with bar graphs, drawing parallels to industry benchmarks. For educational settings, illustrate student progress with line charts, fostering motivation. Benefits abound: Enhanced retention, as visuals aid memory by up to 65% per cognitive studies, and stronger persuasion in pitches.
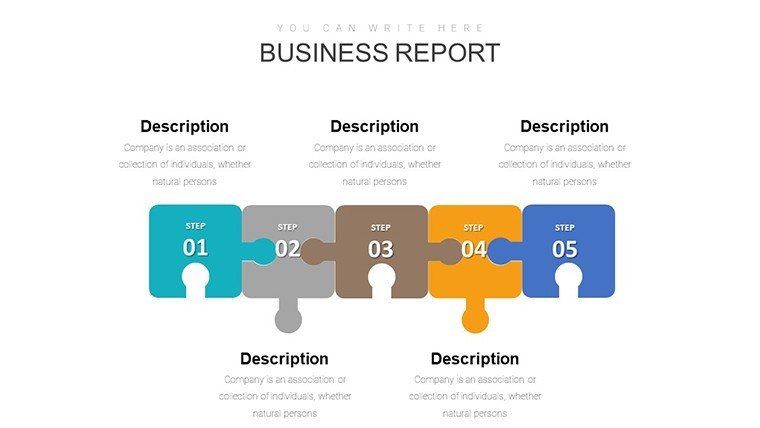
Step-by-step: Start with a blank success slide, input metrics via the intuitive interface. Customize axes for precision, add legends for context. Sequence slides to build momentum - from baseline data to peak achievements. Present with confidence, knowing your visuals underscore your expertise.
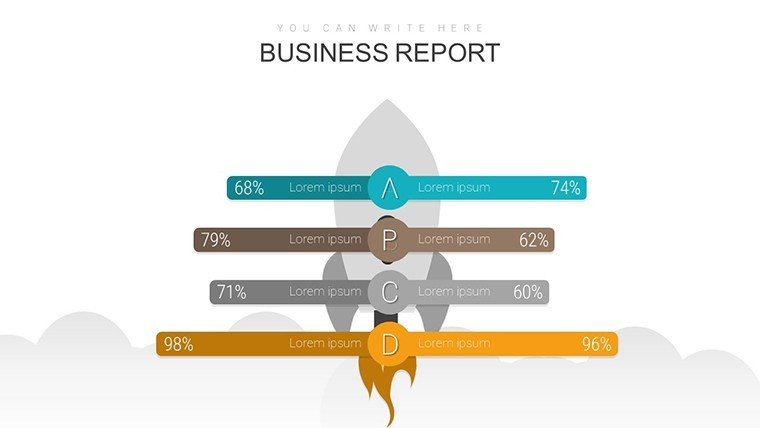
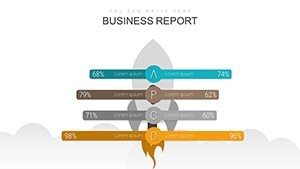
Versus standard PowerPoint, this offers themed success icons - like trophies or upward arrows - that infuse energy. It's not just data; it's a celebration of accomplishments. For analysis-heavy fields, integrate with tools like Excel for live updates, streamlining workflows.
Expert Tips to Amplify Your Presentations
Maximize impact by tailoring to your audience: Use bold visuals for executives, detailed breakdowns for teams. Incorporate humor lightly, like a chart titled 'Our Rocket Ship Growth' for levity. Workflow-wise, export to PDFs for handouts or embed in dashboards for ongoing tracking.
Stand Out with Proven Value
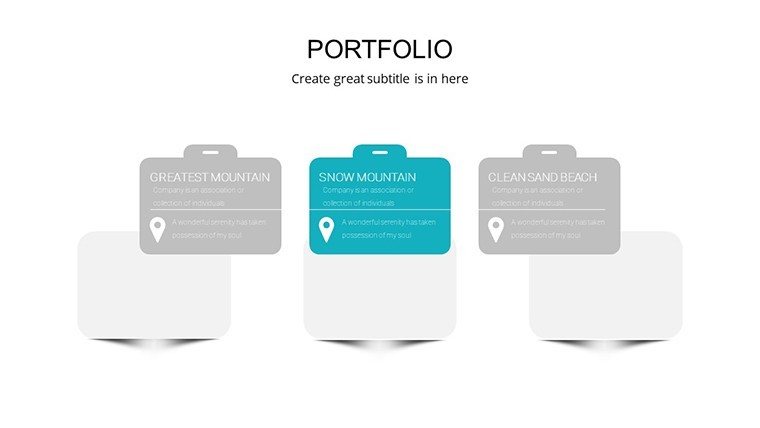
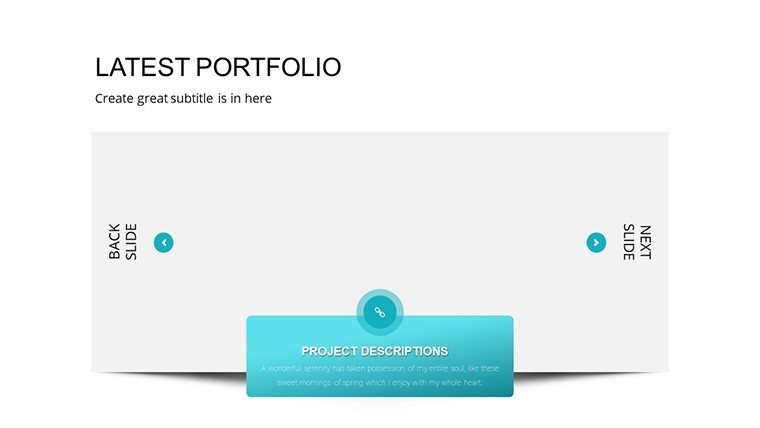
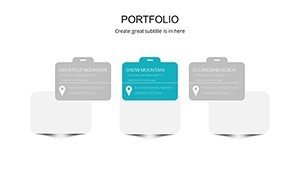
Why this over others? Its focus on success narratives sets it apart, with premium designs at $24. Backed by user acclaim, it's a smart investment for lasting impressions. In creative industries, adapt for portfolio reviews, aligning with design standards for compelling showcases.
Seize the moment - download this Success Charts template and chart your path to presentation excellence.
Frequently Asked Questions
- What types of success charts are included?
- The template features bar, line, pie, and area charts, all editable for your specific data.
- Can I customize the colors and fonts?
- Absolutely, full customization ensures it matches your branding seamlessly.
- Is it suitable for Google Slides?
- Yes, upload the .pptx to Google Slides for compatible use.
- How many slides are there?
- 38 fully editable slides focused on success visualization.
- Does it include data import features?
- Yes, easily import from Excel or enter manually for quick updates.
- What's the license for usage?
- Commercial and personal use allowed, with no restrictions on modifications.