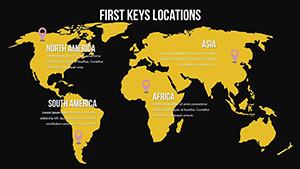
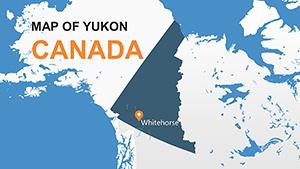
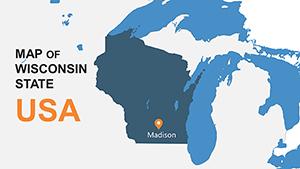
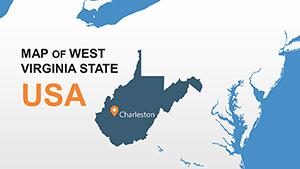
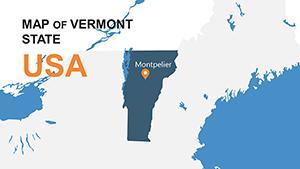
Capture the expanse of North America in your slides with our editable map templates tailored for PowerPoint. These designs cover Canada, the USA, Mexico, and beyond, with flexible elements to highlight countries, add location markers, and adjust styles.
Suited for international business reviews, educational geography sessions, or regional trade analyses, they offer clear visuals that enhance understanding.
Mark key areas from bustling cities to natural landmarks, creating presentations that connect ideas across borders.
Review the collection to find templates that bring continental insights to your audience effectively.


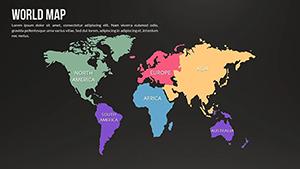


These templates feature separate shapes for countries and regions, enabling targeted customization like color differentiation or data highlighting for seamless storytelling.
Business professionals can outline trade routes or market presence across the continent, while teachers explore cultural diversity or physical features.
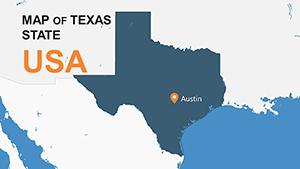
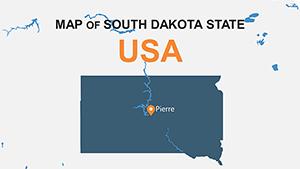
Vector-based for sharp scaling, with options for pins on capitals like Washington D.C., Ottawa, or Mexico City, and animation-ready elements.
They provide enhanced functionality over basic maps for professional results.
Illustrate economic integrations like NAFTA impacts, migration patterns, or environmental zones. Logistics teams map supply chains, and planners highlight tourism routes.
Compare urban development in megacities or resource distribution across diverse landscapes.
Efficiently convey complex continental data with these adaptable designs.
Focus on relevant countries first, using bold colors for emphasis. Animate country appearances for progression and add icons representing themes like industry or nature.
Balance detail with simplicity for audience clarity.
Strengthen your continental narratives - select from our editable North America map templates now.
Encompassing diverse nations and terrains, these templates support broad or focused views, ideal for strategic or informative purposes.
Choose designs that align with your vision for memorable delivery.
Primarily Canada, USA, Mexico, with options for Central America and Caribbean extensions.
Shapes are individually editable for color fills, outlines, or grouping to emphasize specific areas.
Yes, ideal for showing cross-border flows, markets, or partnerships with clear visuals.
Compatible with PowerPoint effects for revealing countries or regions dynamically.
Offer detailed editability, modern styling, and integration features for superior presentation quality.
Copyright © 2009-2026 ImagineLayout All rights reserved.