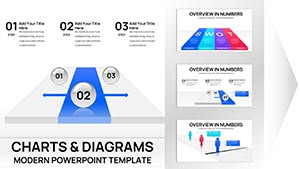
Standard PowerPoint line charts work but lack visual impact. Our templates offer clean modern aesthetics dynamic animations and smart data placeholders that save hours of work.
They ensure your slides look polished and professional every time.
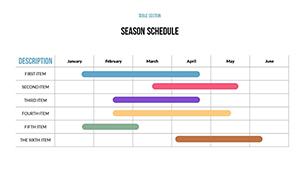
Real-World Use Cases
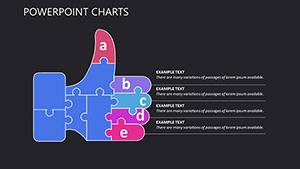
Business Performance Tracking
Show monthly sales growth year-over-year comparisons or market share evolution.
Financial Reporting
Present revenue forecasts stock performance or expense trends clearly.
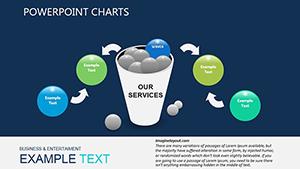
Marketing Analytics
Track campaign results website traffic or customer acquisition over time.
Education and Research
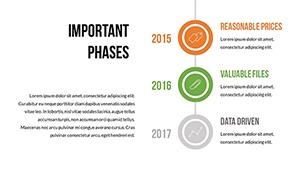
Illustrate historical timelines climate data or experiment results.
Key Benefits Over Default Charts
Time-saving ready layouts
Designer-quality visuals
Full customization options
Built-in animations for engagement
Modern color schemes and fonts
Best Practices and Creative Tips
Keep designs clean. Limit to 4-5 lines maximum. Use contrasting colors for clarity.
Add markers on key data points. Reveal lines progressively with animation. Label axes clearly.
Ready to upgrade your data stories? Browse the full collection and download your favorite line chart templates now.
Frequently Asked Questions
Are these line chart templates free to download?
Yes. We offer many free templates alongside premium options with advanced features.
Can I add multiple data series easily?
Absolutely. All templates support multiple lines and make adding new data simple.
Do the templates include animations?
Most include smooth built-in animations to reveal data step by step.
How do I edit colors and fonts?
Just select elements and use PowerPoint tools. Everything is fully customizable.