Targeting Market PowerPoint Charts Template - Download Presentation


Type: PowerPoint Charts template
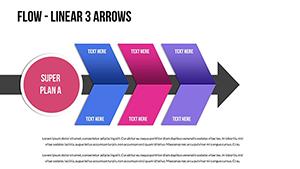
Category: Arrows
Sources Available: .pptx
Product ID: PC00784
Template incl.: 36 editable slides
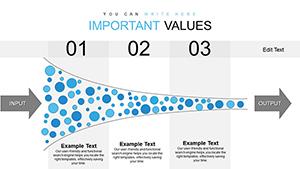
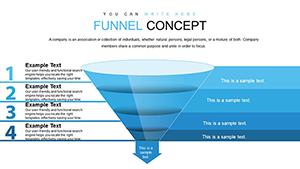
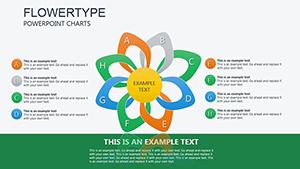
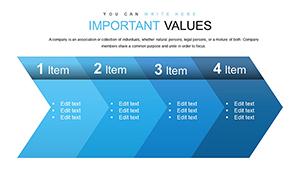
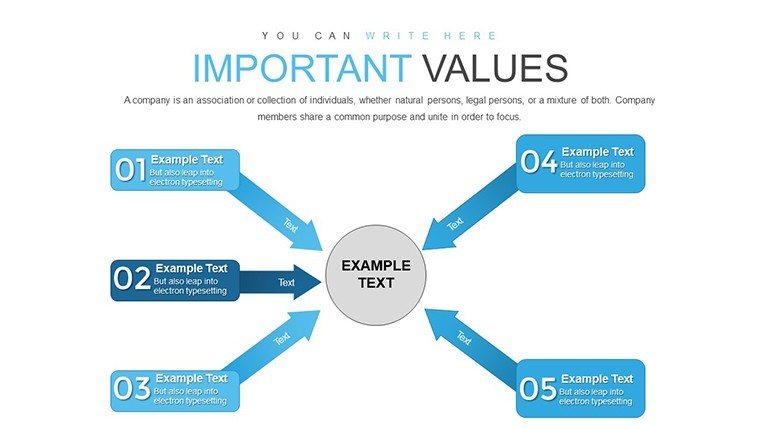
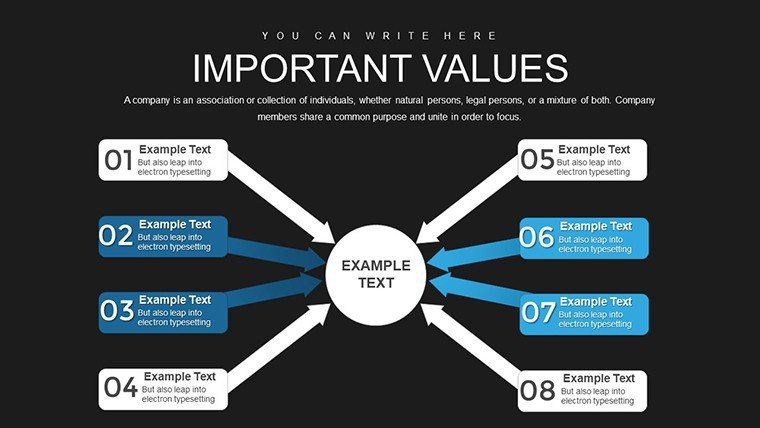
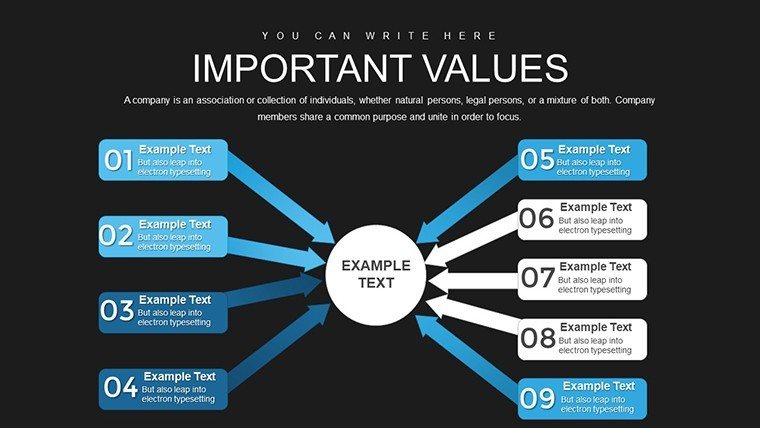
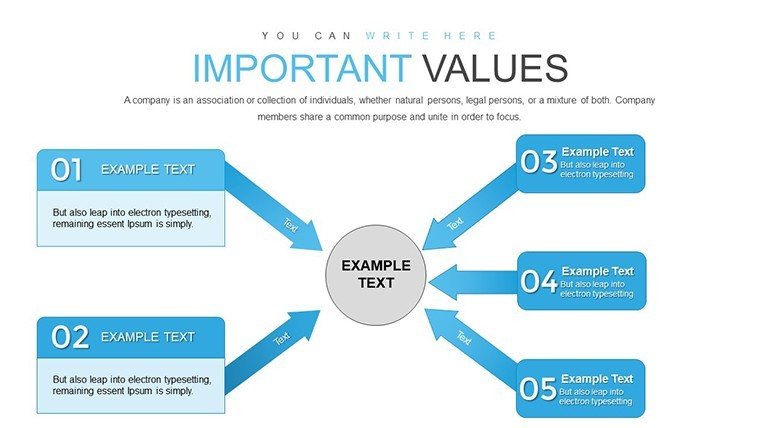
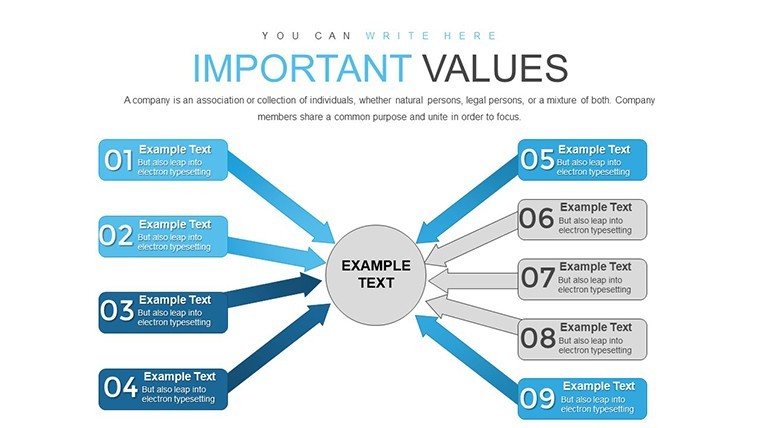
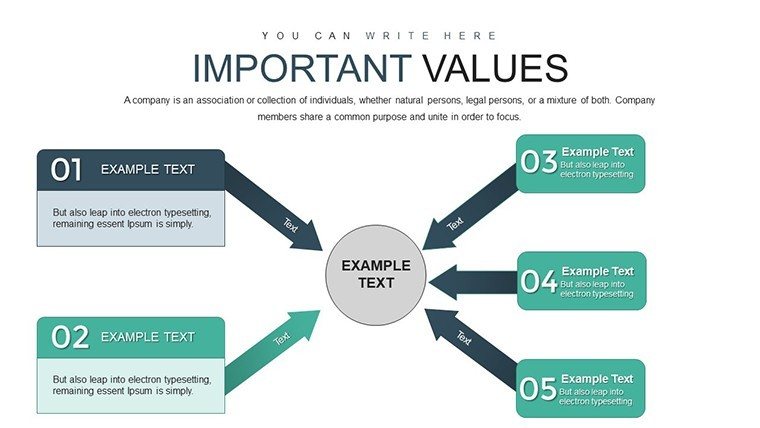
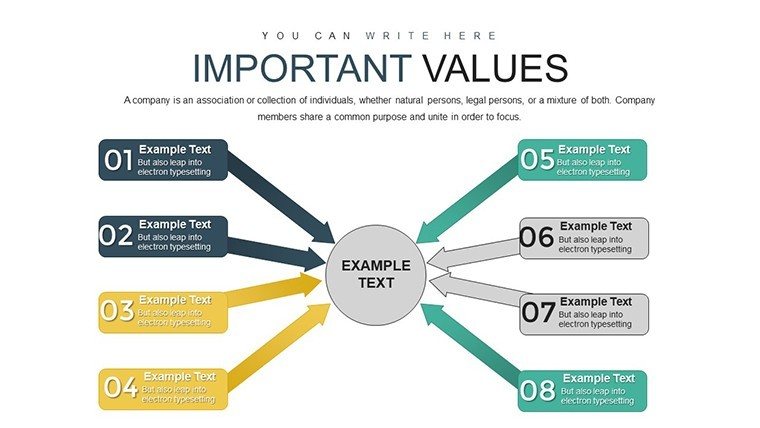
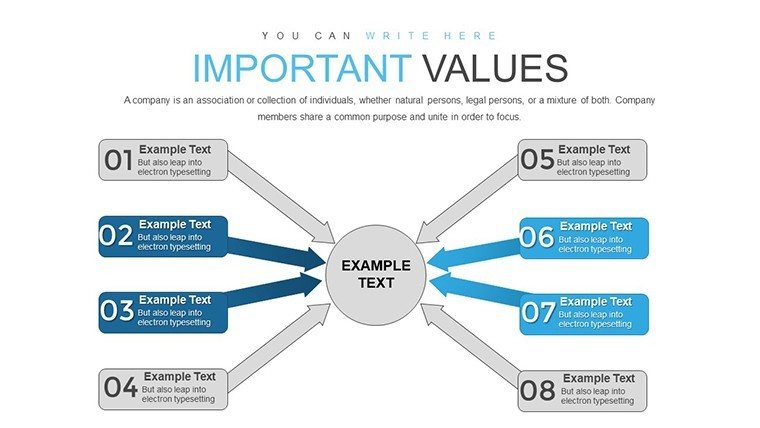
The Targeting Market PowerPoint Charts Template is designed to convert your data into visually beautiful and understandable charts. This template was created to assist you in successfully explaining your market plans and insights. Continue reading to see how this powerful tool may improve your presentations and highlight your facts.
What is the Targeting Markets PowerPoint Charts Template?
The Targeting Market PowerPoint Charts Template is a complete collection of pre-designed slides geared at market targeting and analysis. It offers several customizable charts, graphs, and diagrams to show market data. This template can help you exhibit consumer segmentation, market trends, or competition analysis.
Key Features:
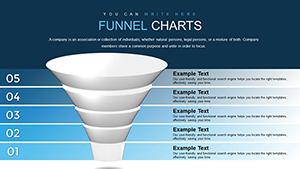
- Choose from a variety of charts, including pie charts, bar graphs, and line charts, to properly depict your data.
- Customizable Elements: Easily change colors, fonts, and sizes to meet your brand's aesthetics.
- Professional Design: High-quality visuals and a clear style make your presentation appear polished and professional.
- User-Friendly: Easy to use, especially for people with little PowerPoint expertise.
Benefits
- Enhanced Clarity: Visual aids make difficult facts more understandable.
- Time-Saving: Ready-made templates can save you hours of design labor.
- Engaging Presentations: Visually pleasing presentations will keep your audience engaged and attentive.
- Versatile: Suitable for a variety of industries and presenting needs.
Who can benefit?
The Targeting Market PowerPoint Charts Template is ideal for:
- Marketing professionals: Showcase market information, consumer insights, and strategic strategies.
- Business Analysts: Present data results in a clear and straightforward manner.
- Sales teams: Highlight market opportunities and customer categories.
- Educators and students: Use this as a teaching tool or for academic presentations.
What the Template Contains:
- Market Segmentation Slides: Present various consumer categories with clarity.
- Trend Analysis Charts: Present market patterns across time.
- Competitive Analysis Diagrams: Compare your position to that of your competition.
- SWOT Analysis Slides: Highlight strengths, weaknesses, opportunities, and threats.
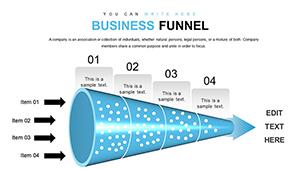
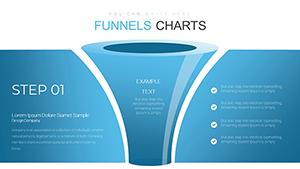
- Customer Journey Maps: Show the stages customers take from awareness to purchasing.
Why do you need it?
Effective communication of market data is critical for making sound business decisions. The Targeting Market PowerPoint Charts Template will assist you:
- Communicate Insights: Clearly communicate your study results and strategies.
- Impress Stakeholders: Give excellent presentations that will amaze clients and executives.
- Drive Decisions: Provide the required evidence to support your suggestions.
How Can It Help?
With the Targeting Market PowerPoint Charts Template, you can:
- Simplify Complex Data: Break down complex market data into understandable visualizations.
- Increase Efficiency: Focus on data analysis rather than design.
- Increase Credibility: Present facts in a professional manner that enhances your reputation.
Examples of Use
- Marketing Reports: Use this template to deliver monthly or quarterly market reports.
- Strategic Planning: Create and present your market strategies.
- Sales Pitches: Enhance your sales pitch with clear and appealing market data.
- Educational Workshops: Teach market analysis skills to students or coworkers.
The Targeting Market PowerPoint Charts Template is an indispensable tool for everyone who needs to show market data efficiently. Its flexible and professional style guarantees that your presentations are clear, engaging, and compelling. Don't pass up the opportunity to improve your presentations and amaze your audience.
Are you ready to revolutionize your presentations? Immediately download the Targeting Market PowerPoint Charts Template and create visually appealing, data-driven slides that engage and instruct. Visit our website to find out more and get started!