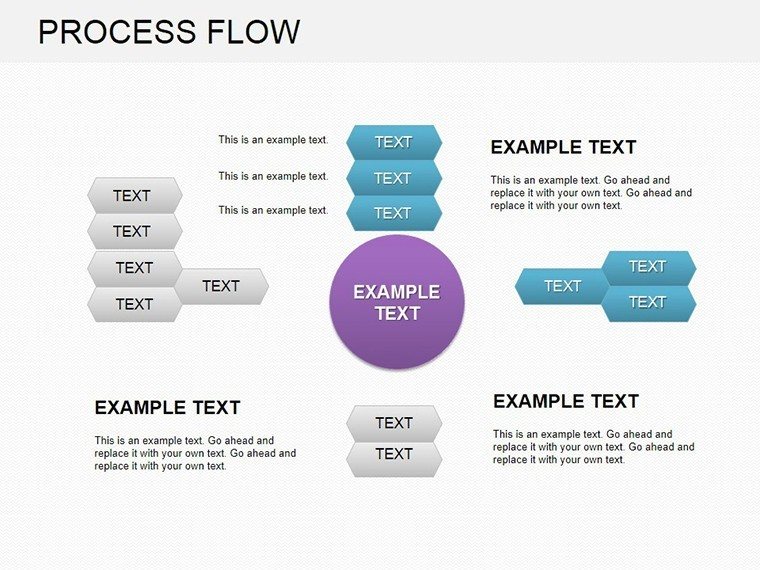
Business Process Flow PowerPoint Charts Template: Visualize Success


Navigating the intricacies of business processes requires more than words - it demands clear, visual representations that everyone can follow. Our Business Process Flow PowerPoint Charts Template, with its 16 meticulously designed editable slides, is tailored for business professionals, project managers, and marketing teams who aim to demystify workflows and foster understanding. Picture transforming a convoluted supply chain into a straightforward flowchart that highlights efficiencies, or presenting a sales pipeline that pinpoints conversion opportunities. This template does just that, blending functionality with aesthetic appeal to make your presentations not only informative but unforgettable.
Drawing from real-world applications, such as those in lean management practices endorsed by the International Organization for Standardization (ISO), this tool helps reduce process ambiguities. For students or entry-level analysts, it's an educational powerhouse, simplifying concepts like BPMN (Business Process Model and Notation) standards. As a marketing analyst, I've witnessed how such visuals can increase stakeholder buy-in by clarifying complex strategies, leading to faster decision-making and improved outcomes.
Essential Features for Professional Polish
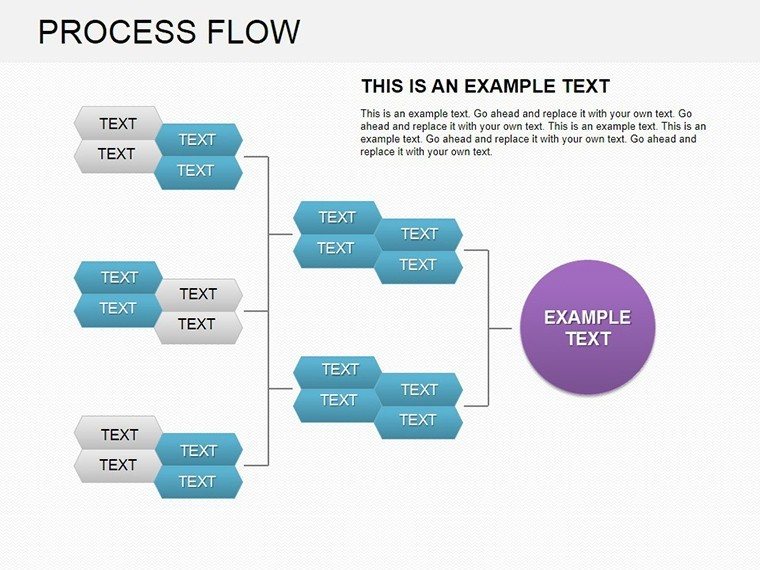
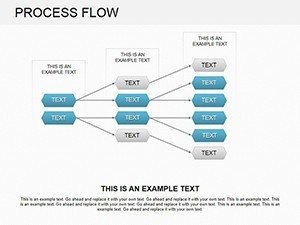
What makes this template indispensable? Its features are engineered for efficiency, ensuring you spend less time designing and more on content. Each slide supports high-customization, from altering swimlane diagrams to integrating decision trees, all while maintaining a cohesive look.
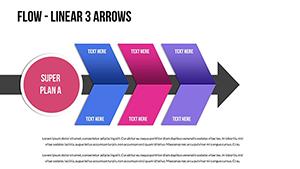
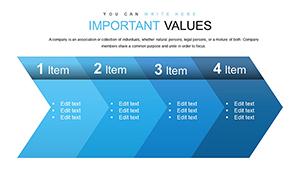
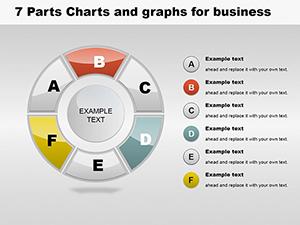
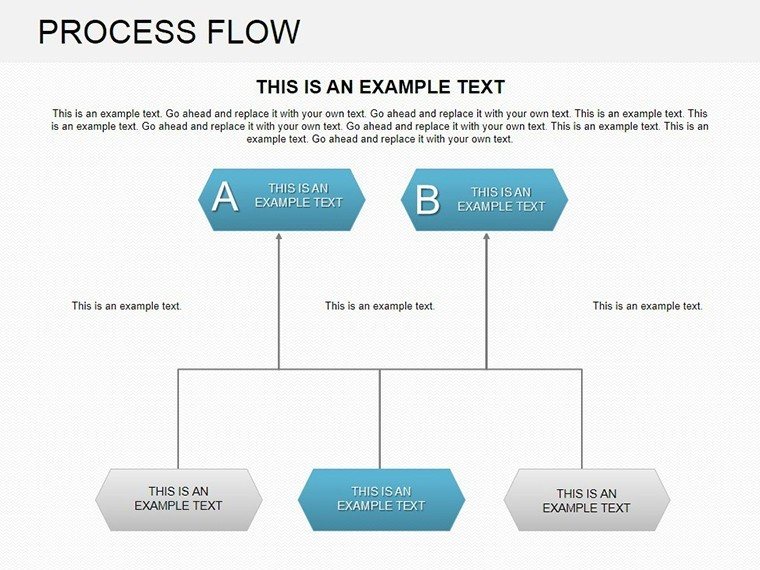
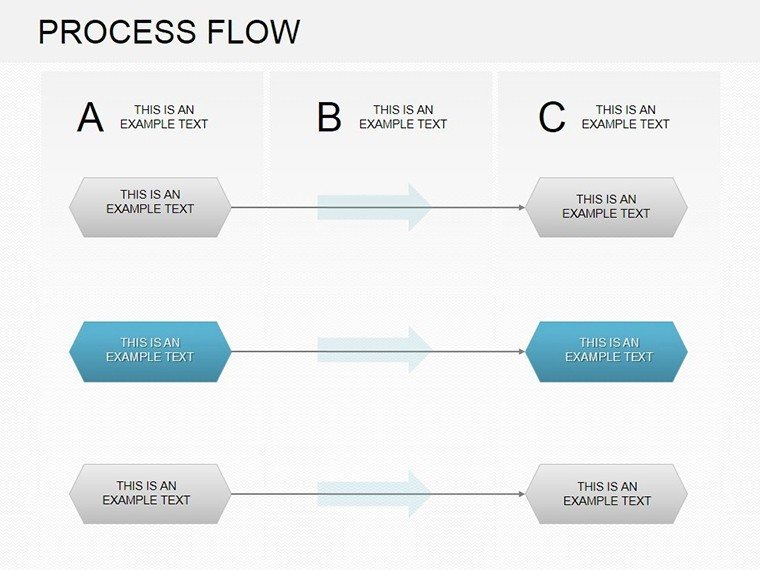
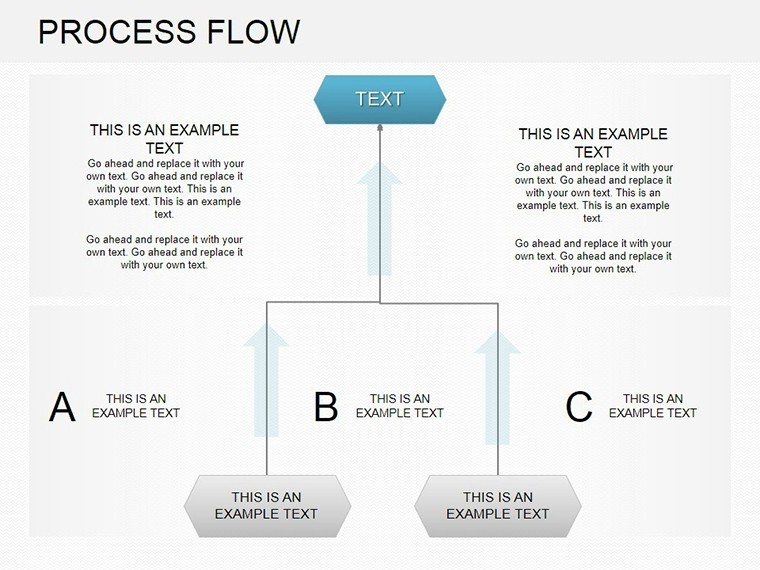
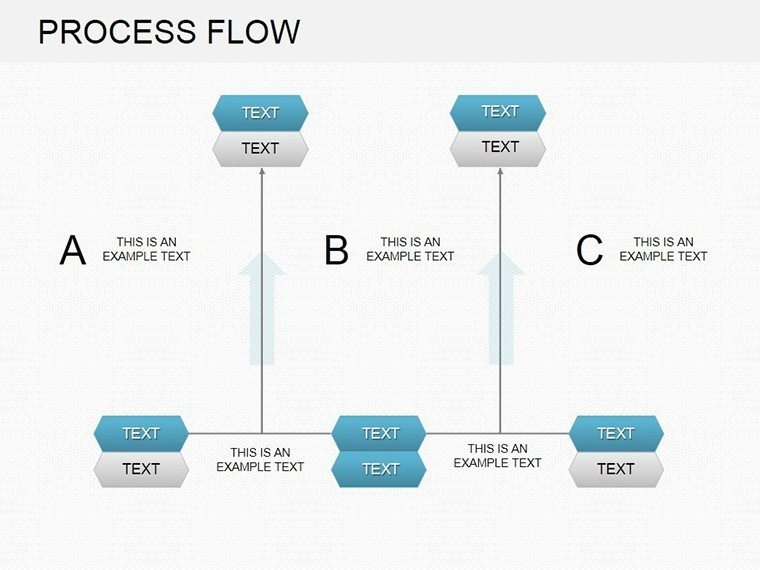
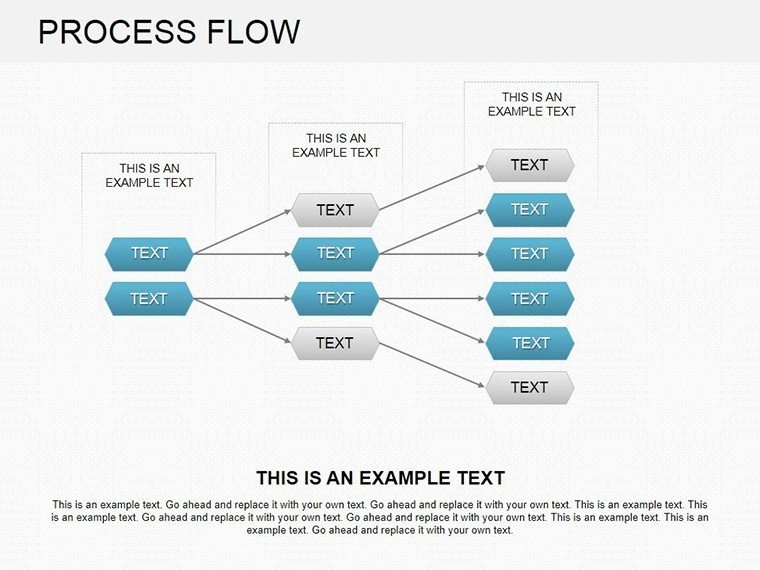
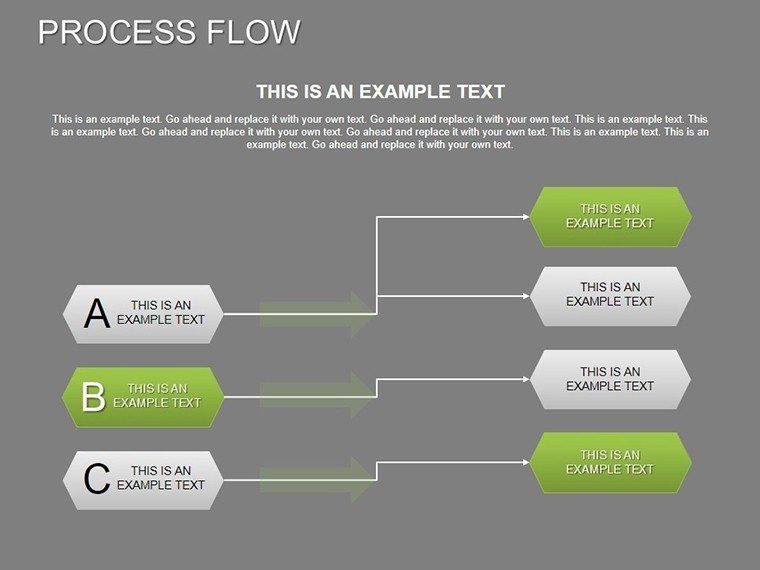
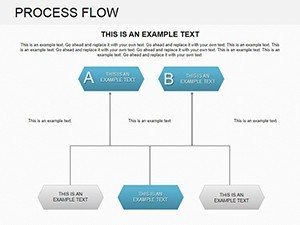
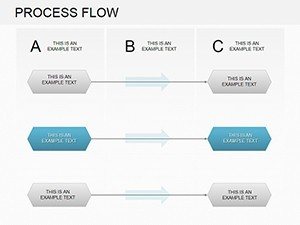
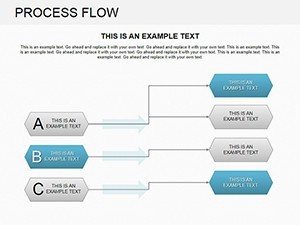
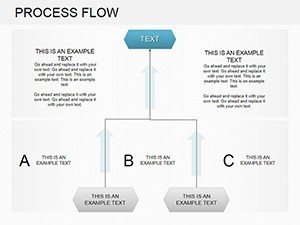
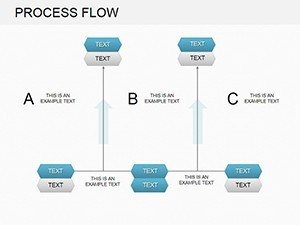
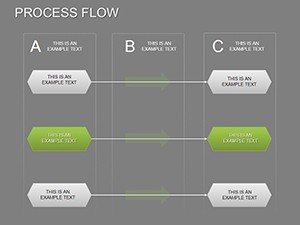
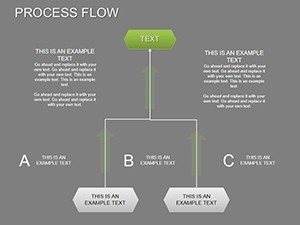
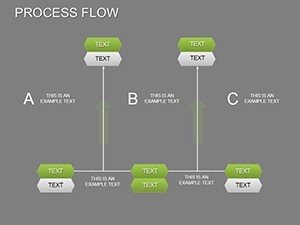
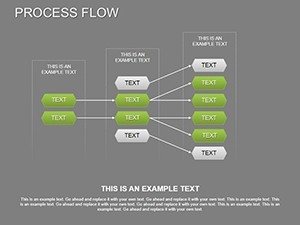
- Comprehensive Flow Charts: Build end-to-end process maps, ideal for auditing operations or training new hires on procedural steps.
- Personalization Tools: Effortlessly tweak hues, typography, and structures to align with corporate branding guidelines.
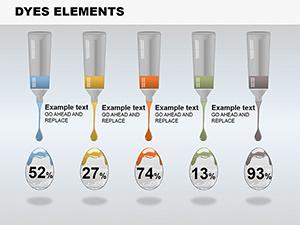
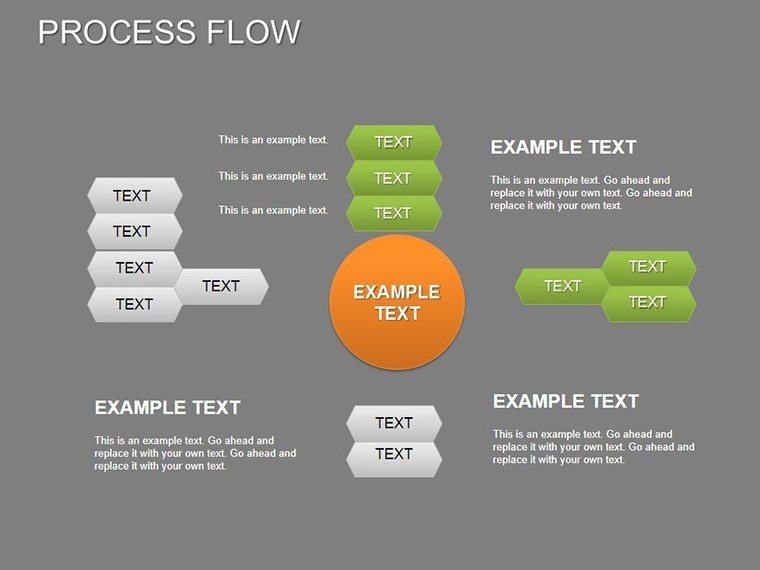
- Dynamic Graphics: Incorporate icons for actions, decisions, and terminations, enhancing visual storytelling without overwhelming the viewer.
- Broad Applicability: Suited for strategy decks, project status updates, or compliance reports, with seamless .pptx integration.
In a case from a Fortune 500 company, using process flow visuals similar to these streamlined their inventory management, cutting waste by 30%, as detailed in Supply Chain Management Review. This template empowers you to achieve comparable results.
Diverse Use Cases Across Industries
Apply this Business Process Flow PowerPoint Charts Template in myriad ways to address specific challenges. For project managers, map out critical paths in construction timelines, incorporating buffers for risks as per PMI methodologies. Marketing teams can diagram campaign workflows, from ideation to execution, ensuring all touchpoints are covered.
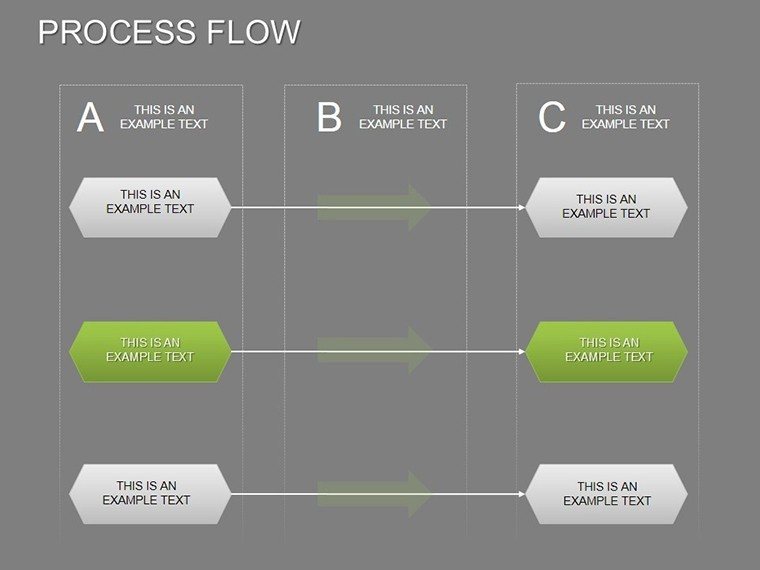
- Operational Strategy: Illustrate manufacturing processes, identifying bottlenecks for Six Sigma improvements.
- Sales Reporting: Depict customer journeys, analyzing drop-off points to optimize conversions.
- Educational Settings: Teach business administration students about process reengineering with real examples from companies like Amazon.
- Consulting Presentations: Showcase advisory services through before-and-after flowcharts, demonstrating value added.
A tech startup used analogous tools to refine their agile sprints, resulting in a 20% faster time-to-market, inspired by Agile Alliance best practices. Customize for healthcare workflows or financial audits, making it a versatile asset.
Pro Tips to Enhance Your Flows
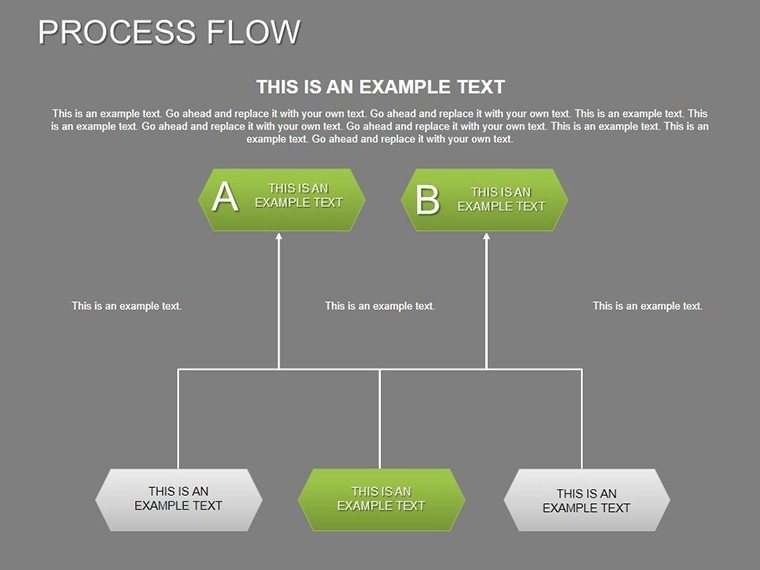
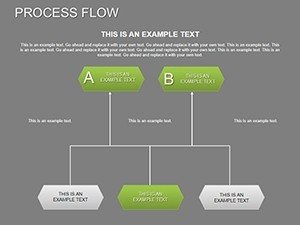
Elevate your usage with these insider strategies. Begin by outlining your process on paper before digitizing, ensuring logical sequencing. Use color coding - greens for starts, yellows for decisions - to intuitively guide viewers. For complex flows, layer information with hyperlinks to detailed sub-slides.
Versus standard PowerPoint shapes, this template's pre-aligned elements prevent misalignment issues, saving frustration. Test for clarity by sharing drafts with colleagues, incorporating feedback to refine. In virtual settings, animate flows step-by-step to build suspense and understanding.
The Value of Streamlined Communication
Choosing this template means investing in clarity that pays dividends in productivity and comprehension. Its design adheres to user experience principles, making information accessible and actionable. Join countless professionals who've transformed their process discussions into strategic advantages.
Frequently Asked Questions
- How customizable are the process flows?
- Every element is editable, from shapes to text, allowing full adaptation to your data.
- Does it support Google Slides?
- Yes, upload the .pptx file directly for compatible editing.
- Is it suitable for beginners?
- Absolutely, with intuitive drag-and-drop features and no advanced skills required.
- Can I add my own icons?
- Yes, integrate custom graphics seamlessly into the flows.
- What file formats are available?
- Primarily .pptx, ensuring wide compatibility.
- Are updates provided?
- Check our site for version updates to keep your template current.