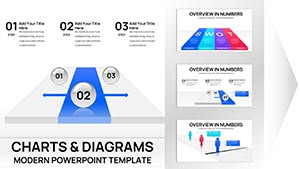
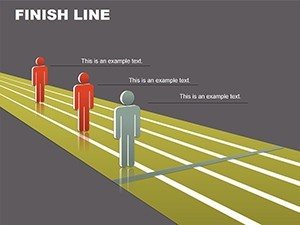
Finish Line PowerPoint Charts Template | 24 Editable Milestone Tracking Slides for Board Meetings


Type: PowerPoint Charts template
Category: Relationship, 3D
Sources Available: .ppt, .pptx
Product ID: PC00075
Template incl.: 24 editable slides
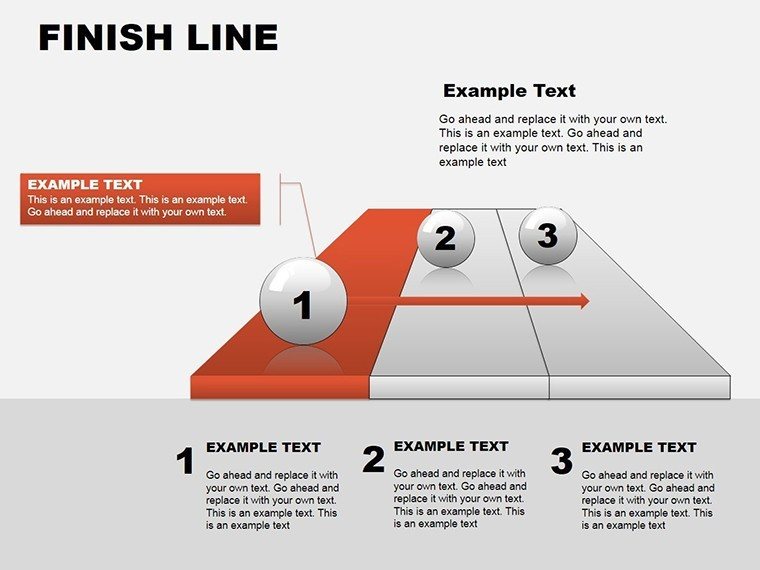
Project managers presenting quarterly progress to executives face a recurring challenge: how do you show the journey from project kickoff to completion without drowning stakeholders in Gantt chart details? This finish line PowerPoint chart template provides 24 editable slides designed specifically for milestone tracking, deadline visualization, and goal achievement reporting in board meetings, investor presentations, and team reviews.
When to Use This Finish Line Chart Template
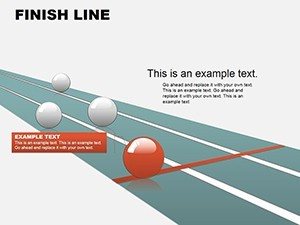
Use these charts when you need to demonstrate project momentum toward a defined endpoint. I reach for finish line visuals during quarterly business reviews when the board wants to see how close we are to product launch, during sprint retrospectives to show development teams their cumulative progress, and in annual planning sessions to map out multi-phase initiatives. The finish line metaphor works because stakeholders immediately understand the concept: you're moving toward a clear goal, and these charts show exactly how far you've traveled.
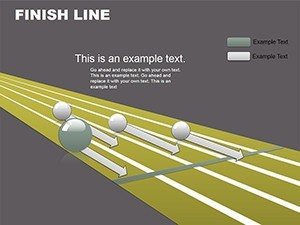
These slides work particularly well for: project portfolio updates where you're tracking 3-5 concurrent initiatives, fundraising presentations showing runway and milestone achievement, change management communications illustrating transformation progress, and sales team reviews displaying quota attainment across quarters. The template includes timeline charts, progress bars, milestone markers, and relationship diagrams that connect phases to outcomes.
24-Slide Breakdown: From Overview to Detail
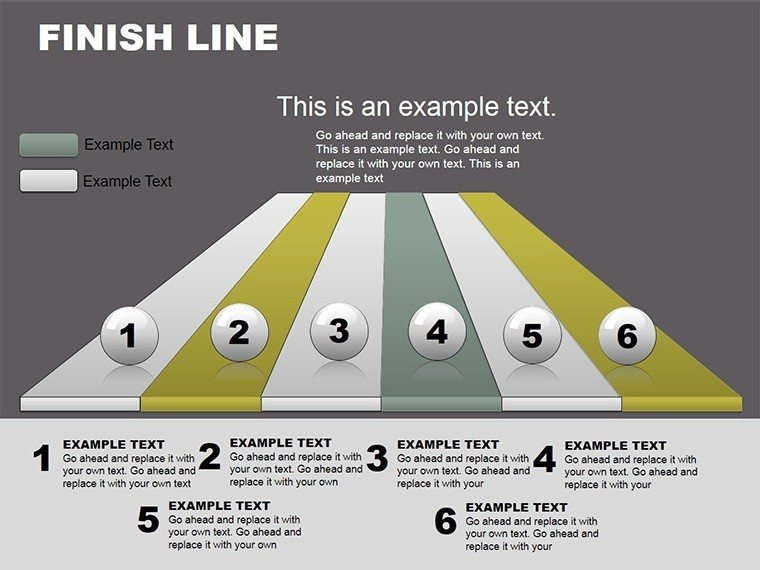
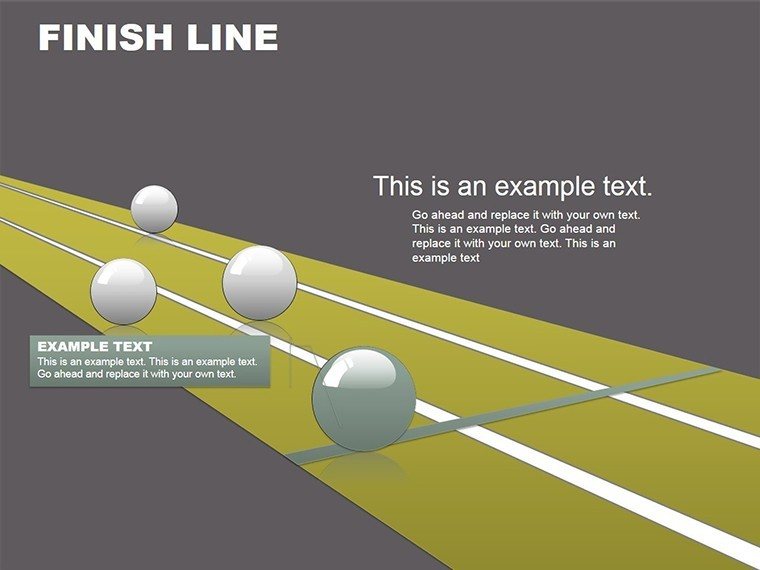
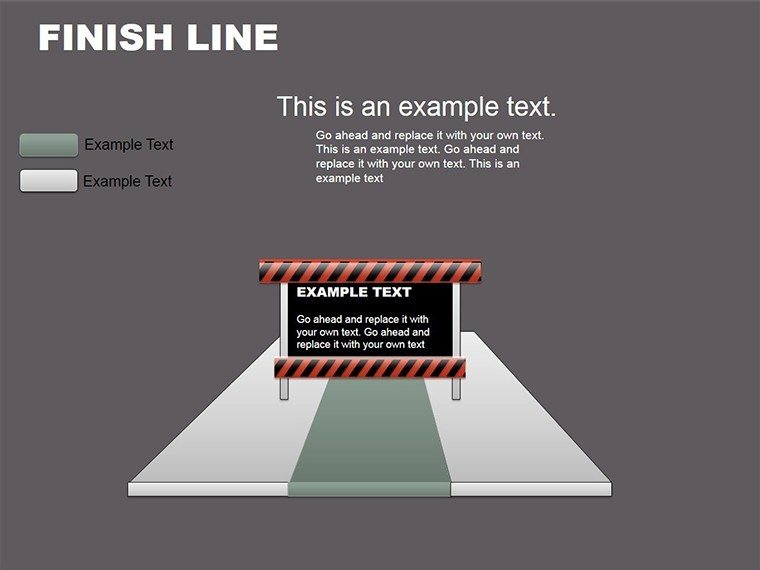
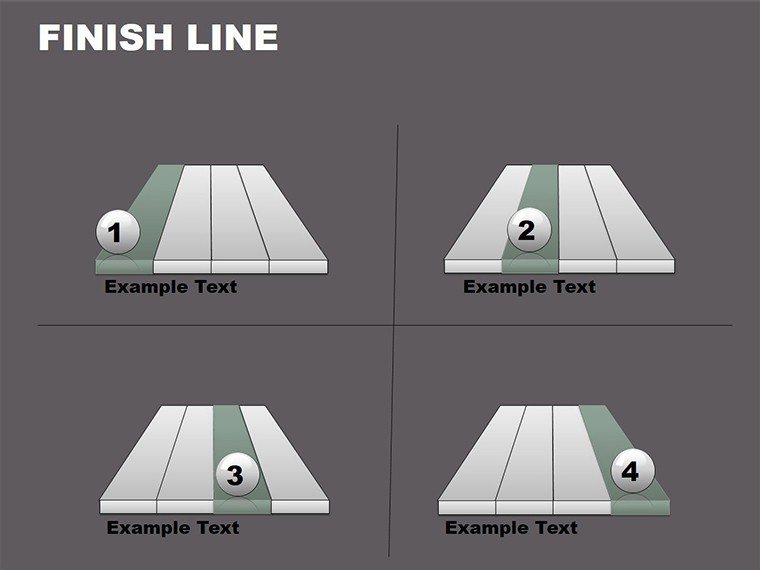
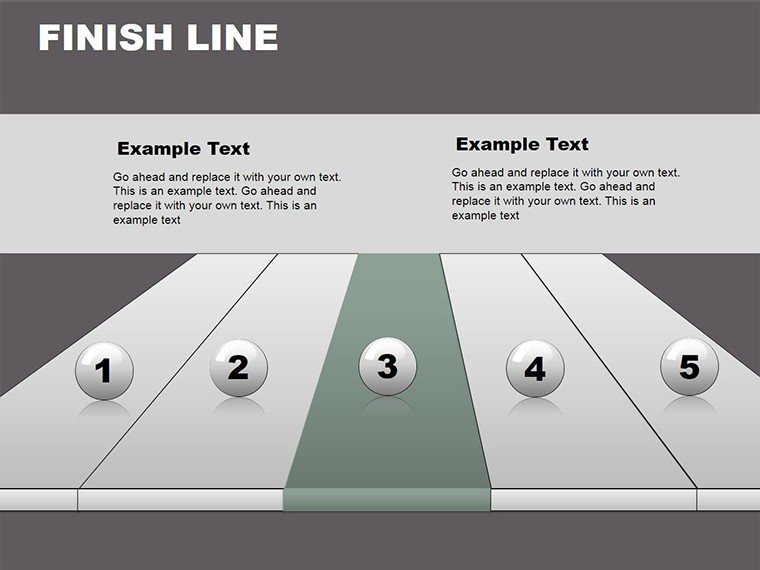
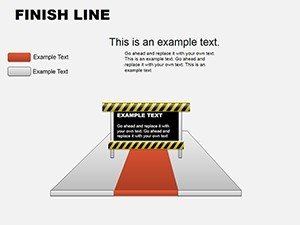
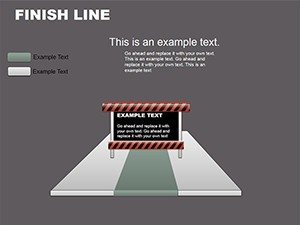
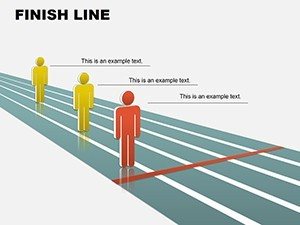
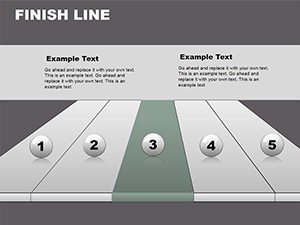
Opening Slides (1-6): Title layouts with finish line graphics, executive summary charts showing overall completion percentage, and high-level timeline overviews. I use slide 3 for board meeting openers - it displays a horizontal progress bar with key milestone dates marked along the track.
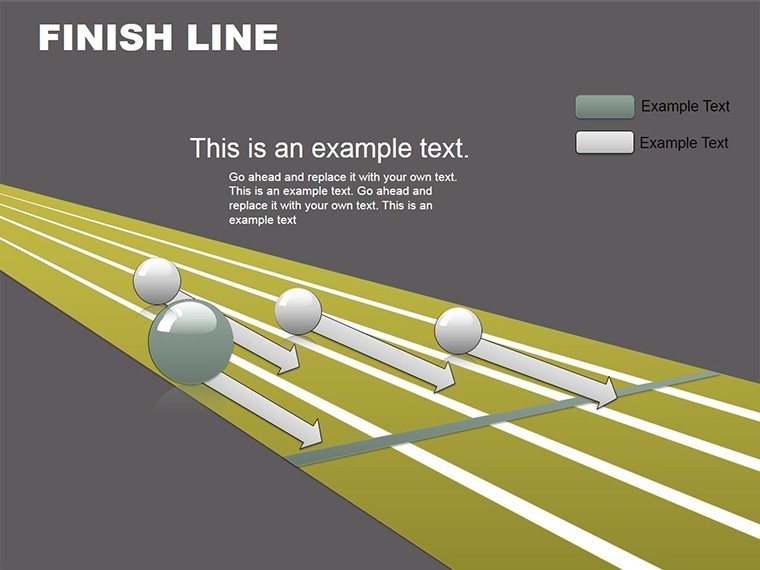
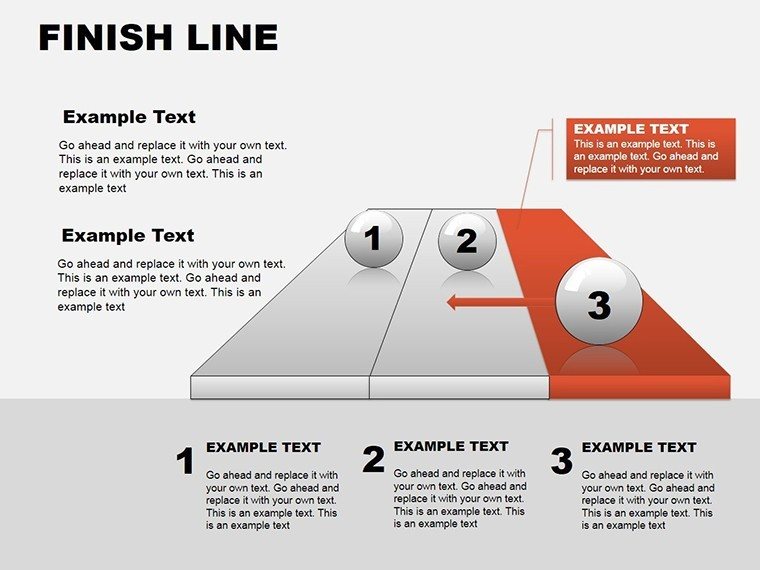
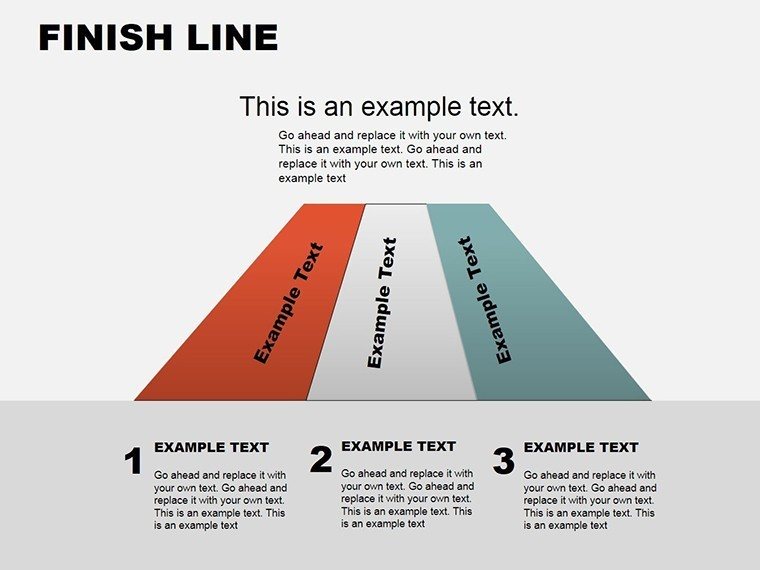
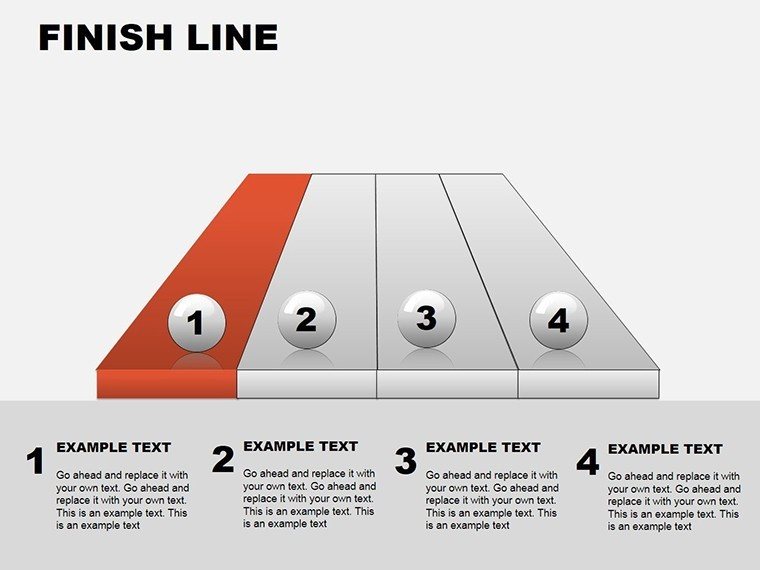
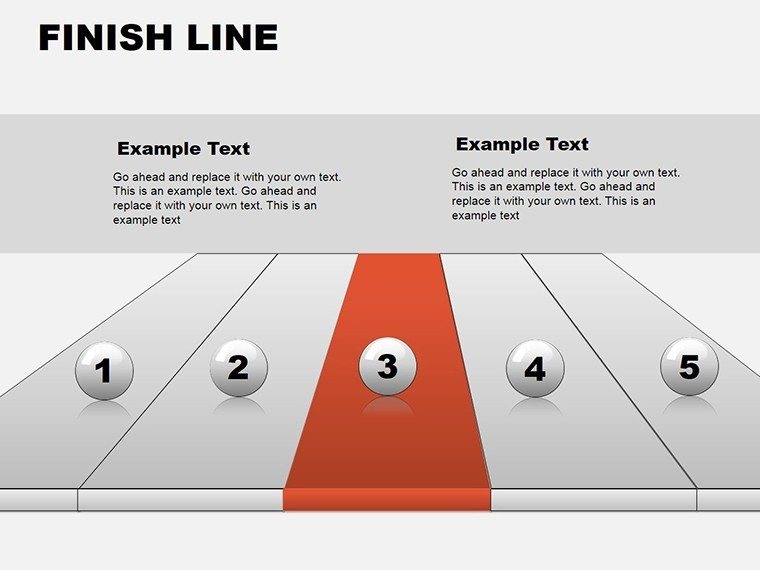
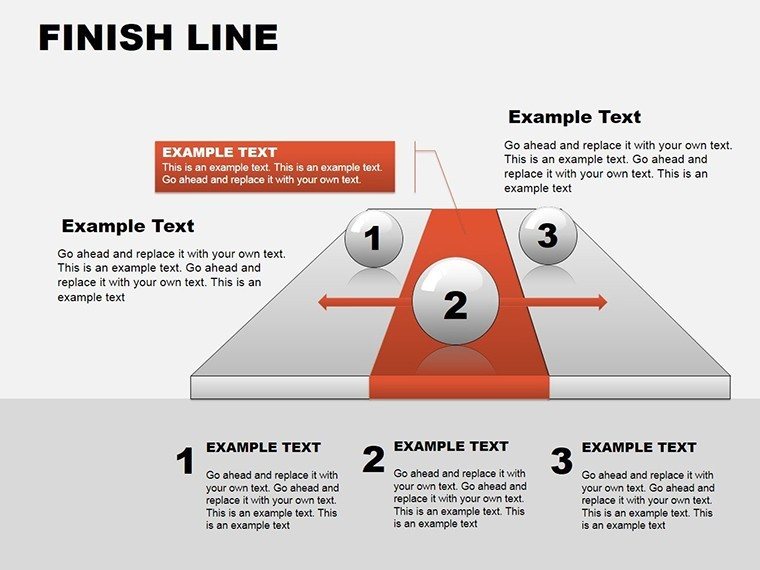
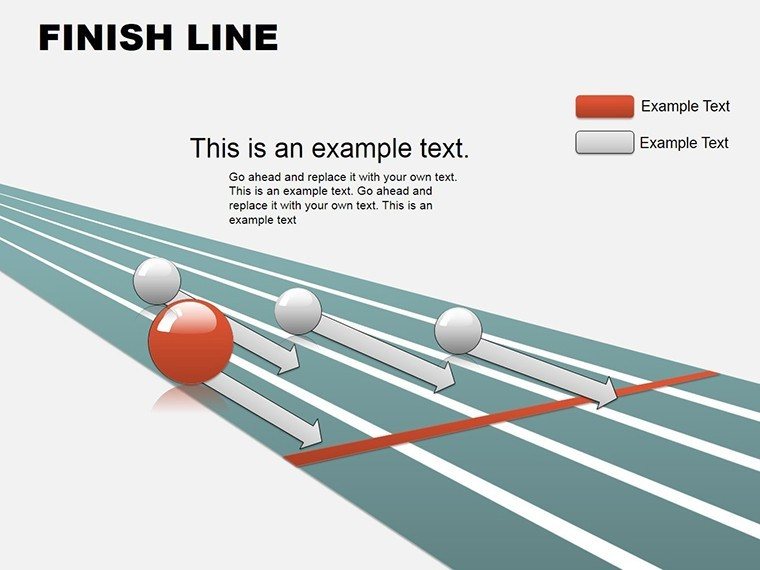
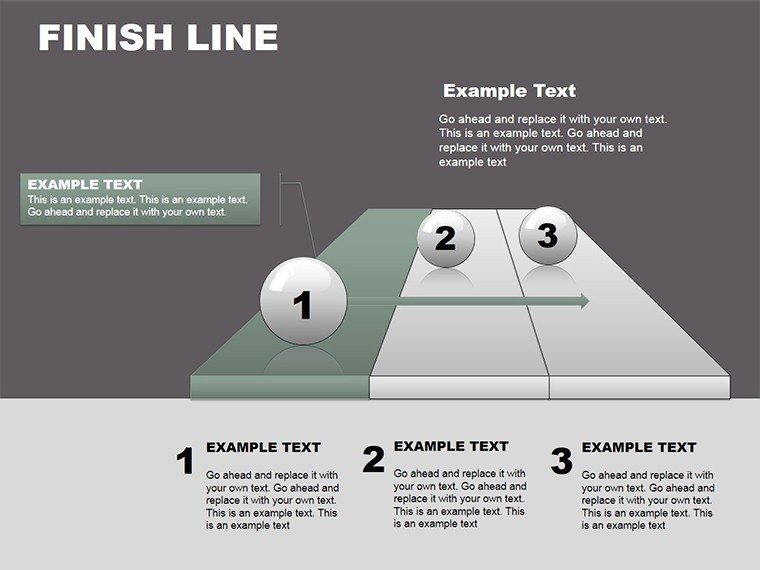
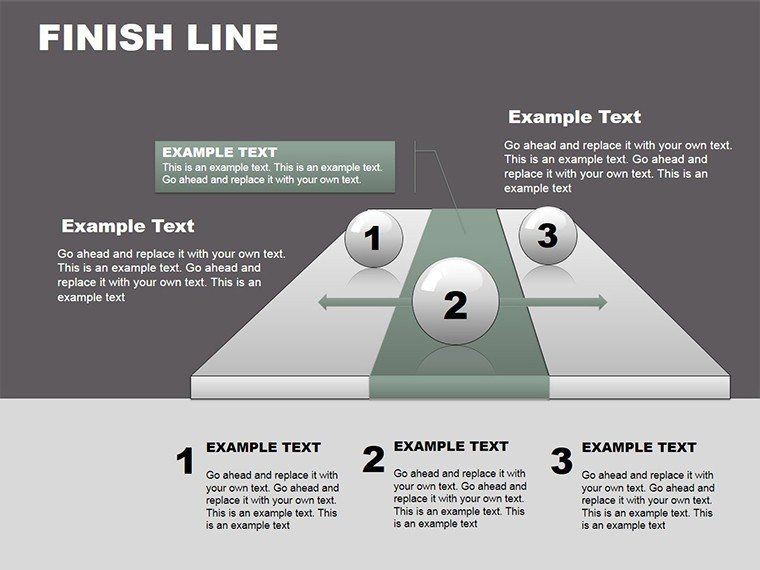
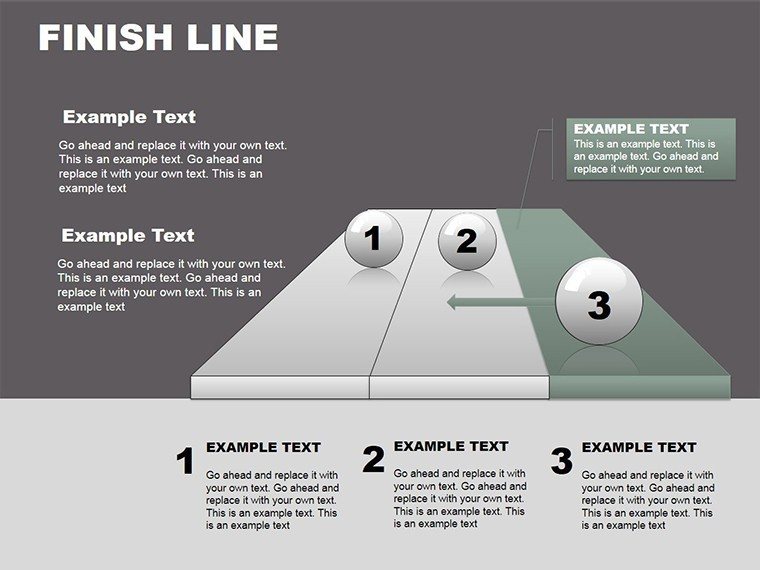
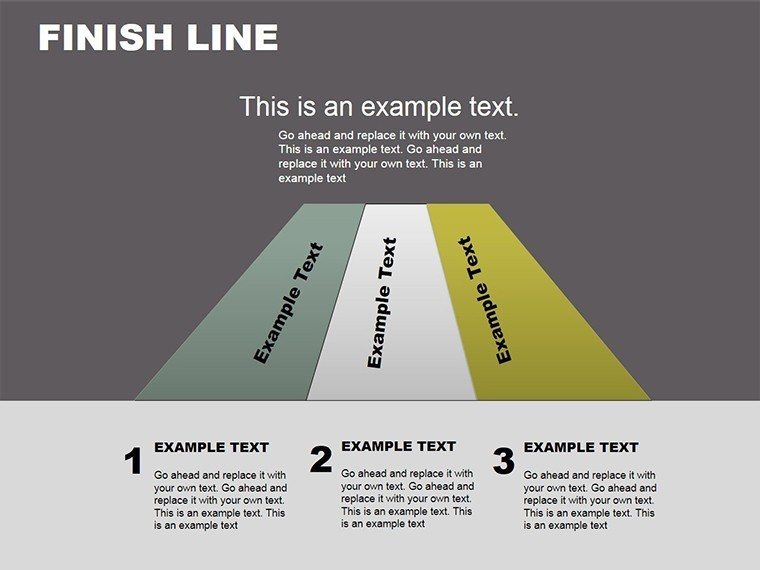
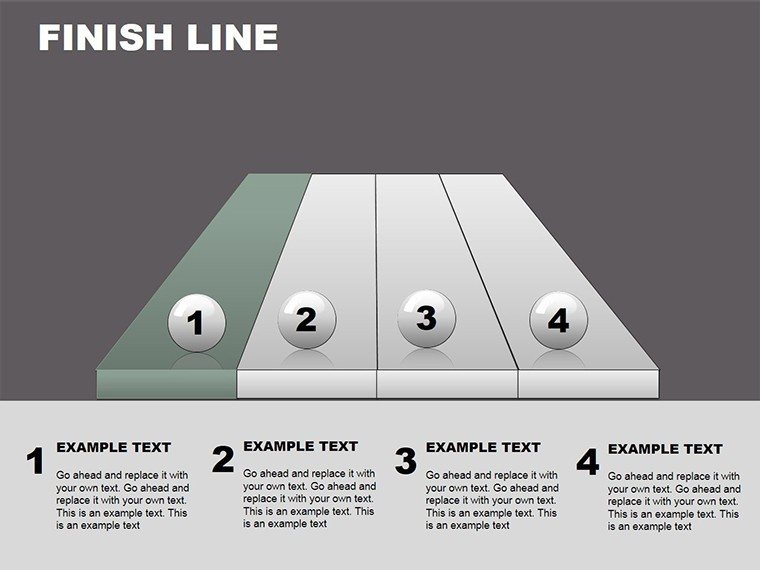
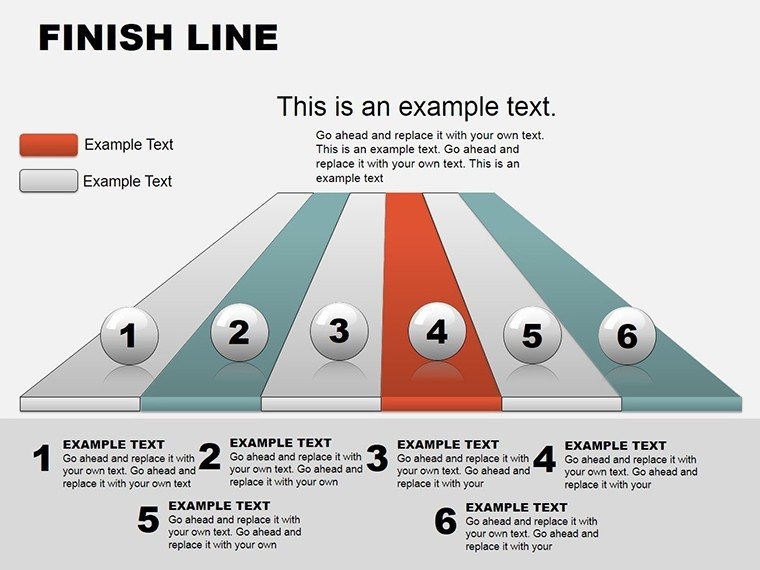
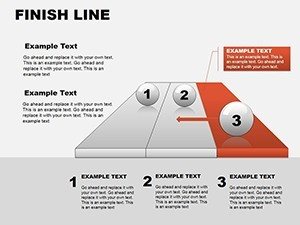
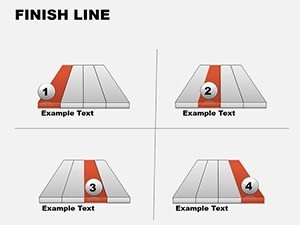
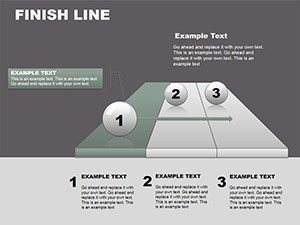
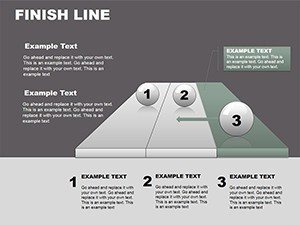
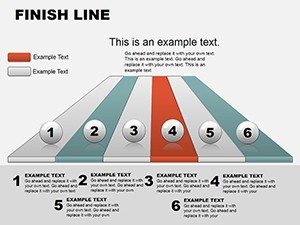
Milestone Tracking Charts (7-15): Detailed timeline visualizations showing phase completion, dependency chains, and critical path elements. Slide 10 offers a multi-track layout perfect for showing parallel workstreams (development, marketing, operations) all racing toward the same launch date. Slide 13 includes 3D cylindrical markers I customize with actual completion percentages.
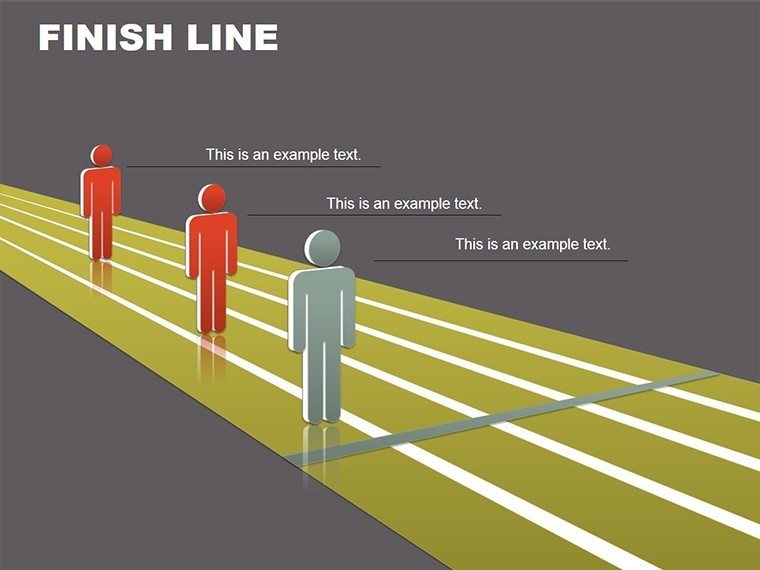
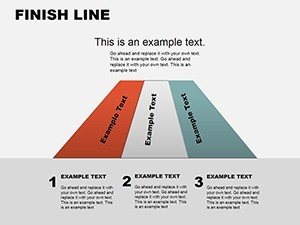
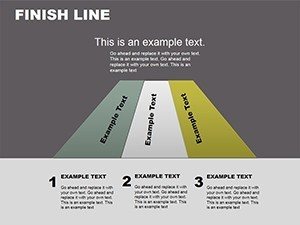
Goal Achievement Visuals (16-24): Comparative charts displaying target vs. actual performance, team contribution breakdowns, and outcome summaries. Slide 19 features a radial diagram showing how different departments contribute to the finish line - useful when presenting cross-functional initiatives to senior leadership.
Real-World Editing Workflow
Download the .pptx file and open it in PowerPoint, Keynote (via import), or Google Slides (via upload to Drive). Start with slide 1 for your cover, then jump to slide 10 if you need multi-phase tracking. Click any text box to replace placeholder content with your actual project names, dates, and milestones. To update progress bars: select the bar shape, right-click, choose "Edit Points," and drag the right edge to reflect current completion. For color changes, select all slides (Ctrl+A in Slide Sorter), then use Format Painter to apply your brand palette across the deck.
Common customization: replace generic milestone labels with your specific deliverables. Instead of "Phase 1," I type "MVP Development Complete" or "Series A Funding Secured." This specificity makes executive audiences lean in because they see their priorities reflected in the visual. Animation tip: use "Wipe" entrance effects set to "From Left" on progress bars to simulate forward momentum during the presentation.
Professional Presentation Scenarios
Board Meeting - Quarterly Product Roadmap Update: You're presenting to the board and need to show that the Q2 product launch is on track despite a two-week engineering delay. Use slide 7 to display the original timeline, then slide 12 to show adjusted milestones with recovery plans. The finish line visual reinforces that despite setbacks, the team is still driving toward launch.
Investor Pitch - Milestone Achievement Tracking: During Series A fundraising, investors want proof you can execute. Pull up slide 18 showing completed milestones (beta launch, first 100 customers, breakeven month) alongside upcoming finish lines (1,000 customers, expansion to second market). The visual progression demonstrates operational discipline.
Team Retrospective - Sprint Progress Review: At the end of a 12-week development cycle, use slide 22 to show the team how their cumulative sprints moved the project from 0% to 87% complete. The finish line chart helps developers see their incremental work as part of a larger achievement trajectory, boosting morale before the final push.
Template Comparison: Slide Types and Applications
| Slide Range | Chart Type | Best For | Audience |
|---|---|---|---|
| Slides 1-6 | Overview timelines, progress bars | Executive summaries, cover slides | Board members, C-suite |
| Slides 7-15 | Multi-phase trackers, milestone charts | Detailed project reviews, dependency mapping | Project teams, middle management |
| Slides 16-24 | Achievement comparisons, team contributions | Performance reviews, success celebration | All-hands meetings, retrospectives |
Industry Applications
Software Development: Product managers track feature releases across quarterly sprints, using finish line charts to show engineering teams their progress toward GA (general availability) launch dates.
Construction & Real Estate: Project managers display building phase completion, from foundation to occupancy, helping investors understand timeline adherence and budget allocation across construction milestones.
Healthcare & Clinical Trials: Research coordinators visualize patient enrollment progress, trial phase completion, and regulatory submission timelines when presenting to hospital boards or pharmaceutical sponsors.
Marketing Campaigns: Campaign managers show initiative progress from strategy development through execution to performance analysis, giving CMOs visibility into concurrent campaign timelines.
Nonprofit Fundraising: Development directors track capital campaigns from goal announcement to target achievement, using finish line visuals during donor presentations to create urgency and demonstrate momentum.
Download this template when you need to transform abstract project data into concrete progress visualization. Start editing your milestone presentation instantly.
Frequently Asked Questions
When should I use finish line charts instead of traditional Gantt charts?
Choose finish line charts for executive presentations where stakeholders need to grasp overall progress quickly, not task-level dependencies. Use traditional Gantt charts when project managers need to analyze critical paths and resource allocation. In board meetings, I've found finish line visuals communicate status in 30 seconds, while Gantt charts require 5 minutes of explanation. If your audience asks "are we on track to launch?" - not "what's blocking task 47?" - use the finish line template.
Can I animate these charts to show progress building over time?
Yes, the charts support PowerPoint animations. Select progress bar shapes and apply "Wipe" or "Grow/Shrink" effects. I typically set animations to "On Click" so I can control pacing during presentations. For quarterly reviews, I animate bars from 0% to current completion - this builds dramatic tension when showing teams how close they are to finish lines. Set animation duration to 2-3 seconds for professional pacing that doesn't feel rushed.
How do executives typically react to finish line visualizations versus data tables?
Executives engage with finish line charts because the metaphor is instantly recognizable - everyone understands racing toward a goal. In my experience presenting to boards, finish line visuals generate forward-looking questions: "What do you need to cross the finish line faster?" Data tables generate backward-looking questions: "Why was Q2 performance weak?" The visual shifts conversation from blame to solution-finding. CFOs particularly appreciate these charts because they can correlate milestone completion to budget burn rate at a glance.
Does this template work for Agile sprints or only waterfall projects?
It works for both methodologies. For Agile, use the template to show cumulative sprint progress toward release goals - each sprint becomes a mini-milestone on the track to product launch. For waterfall, map traditional phases (requirements, design, development, testing, deployment) as sequential milestones. I've used this template with Scrum teams to visualize velocity trends across sprints and with construction teams to show waterfall phase gates. The finish line concept transcends methodology because it focuses on "where are we relative to done?"
What's the fastest way to customize colors to match corporate branding?
Open the template, go to Design tab, click Colors dropdown, select "Customize Colors," then input your brand hex codes for accent colors. This updates all chart elements simultaneously. Alternatively, select slide 1, press Ctrl+A to select all shapes, then use Format > Shape Fill to apply your primary brand color. Use Format Painter to copy this styling to remaining slides. The entire customization takes under 5 minutes. I keep a branded version saved as my master template so I'm always 30 seconds away from starting a new milestone presentation.
Can I combine multiple finish lines in one presentation for portfolio tracking?
Absolutely - this is one of the template's strengths. Use slide 10 (the multi-track layout) to show 3-5 concurrent projects all progressing toward their respective finish lines. I do this in portfolio review meetings where the VP needs to see how Product A, Product B, and Service C are all tracking simultaneously. Color-code each track (Product A in blue, Product B in green) so stakeholders can quickly scan progress across initiatives. This approach works particularly well for PMO directors managing 10+ active projects.