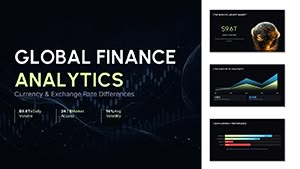
Financial Analysis PowerPoint Charts Template


Elevate your financial presentations with our editable PowerPoint charts template. Download for impactful, customizable infographics for effective financial analysis presentations.
In today's dynamic business landscape, presenting financial data compellingly and insightfully is paramount. Our meticulously crafted PowerPoint charts template is designed to empower your financial reports, offering a seamless blend of versatility and visual appeal.
Why Choose Our Financial Analysis PowerPoint Charts Template?
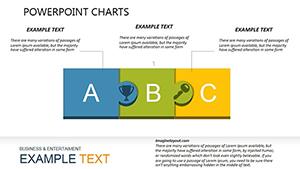
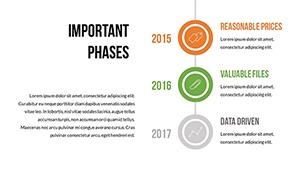
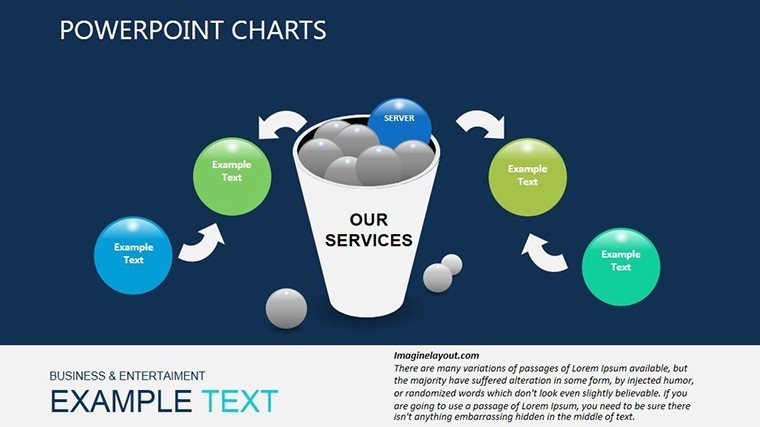
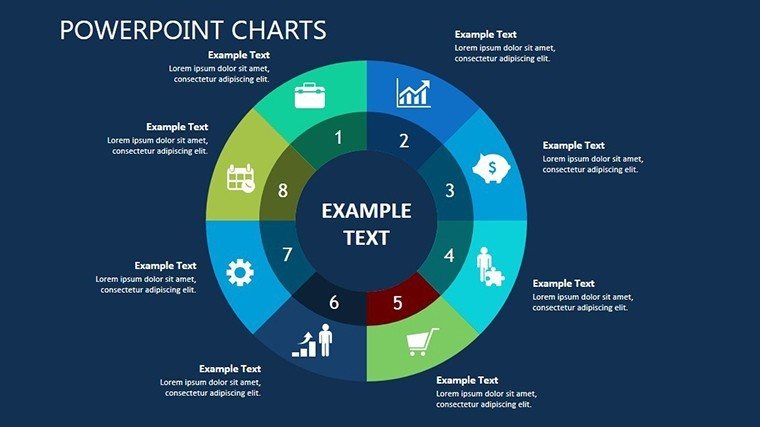
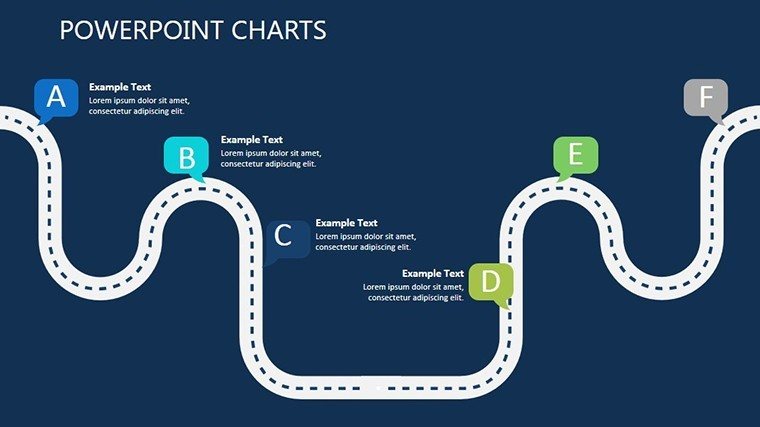
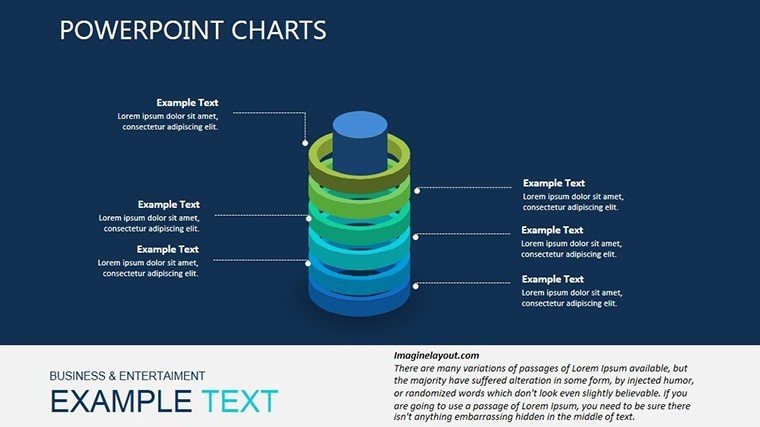
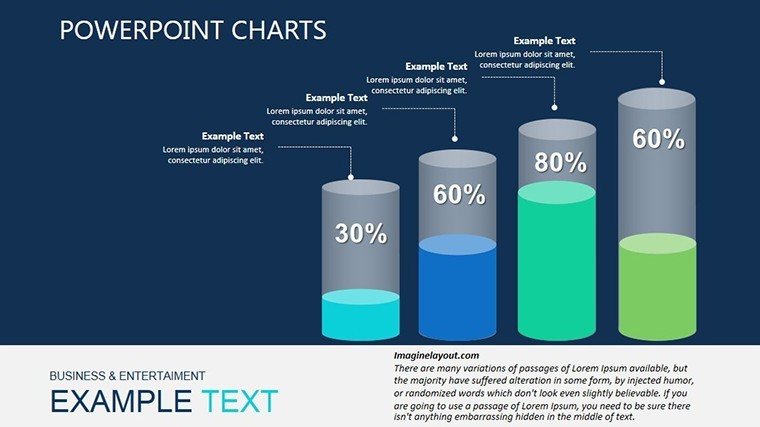
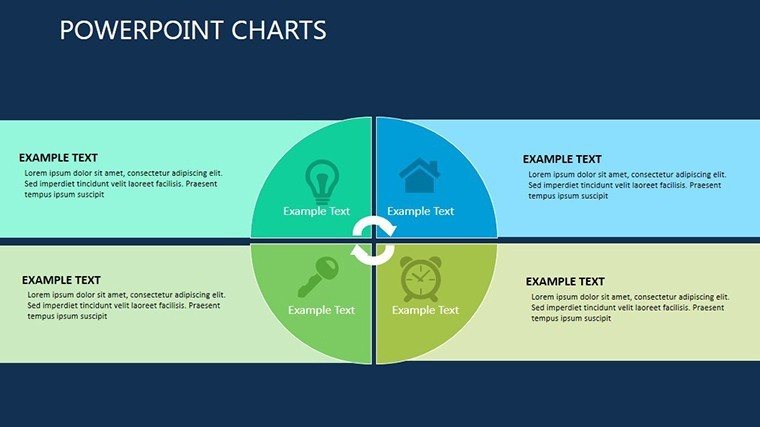
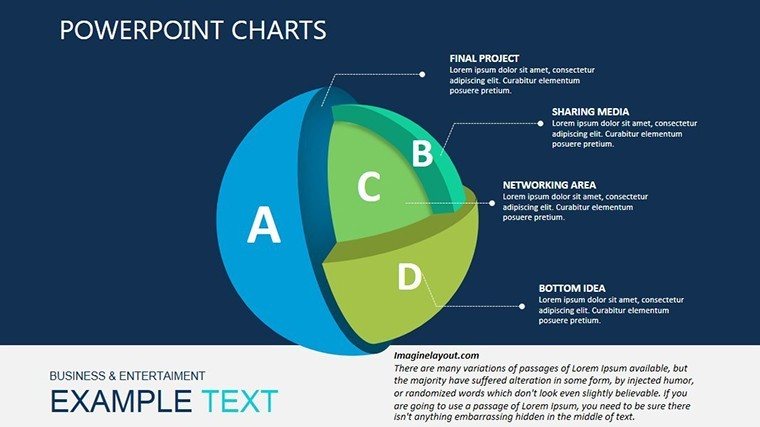
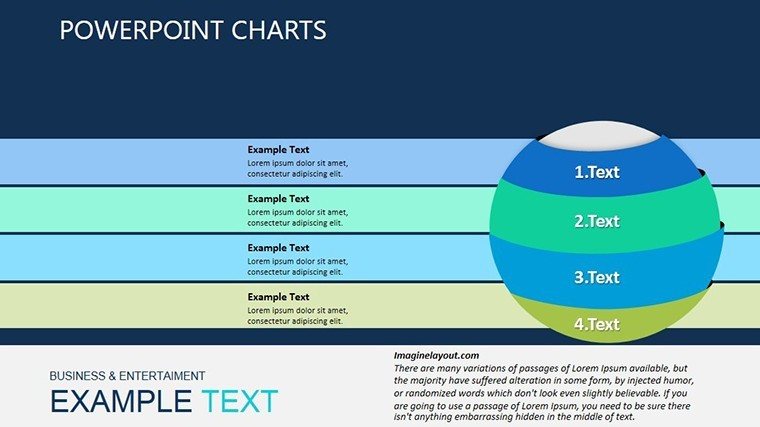
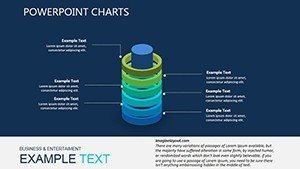
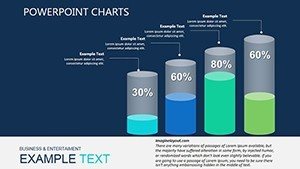
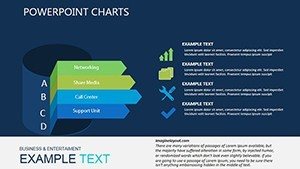
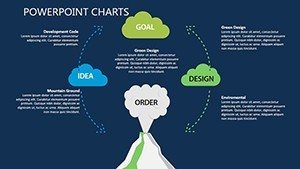
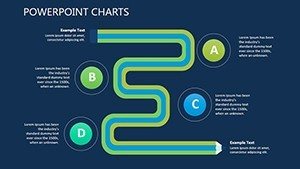
1. Visual Brilliance for Impactful Presentations: Captivate your audience with stunning visual representations of financial data. Our template offers a diverse range of editable charts, ensuring your message is conveyed with precision and clarity.
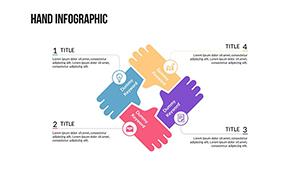
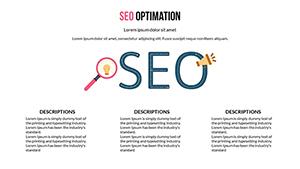
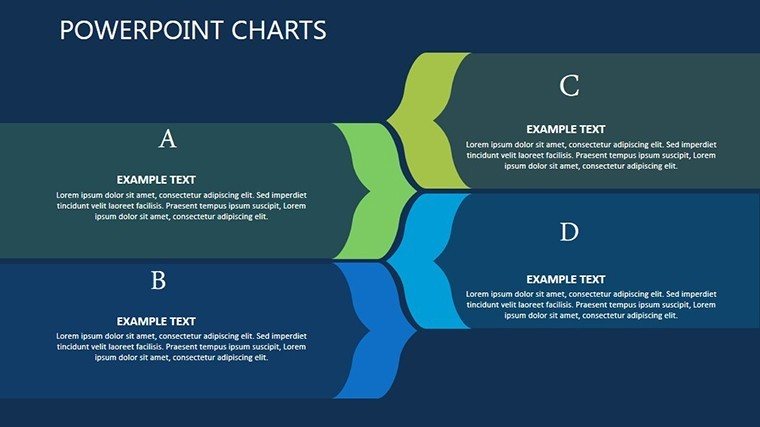
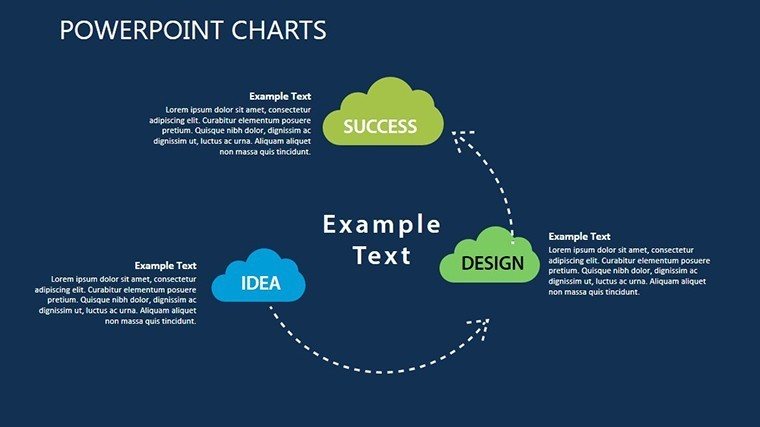
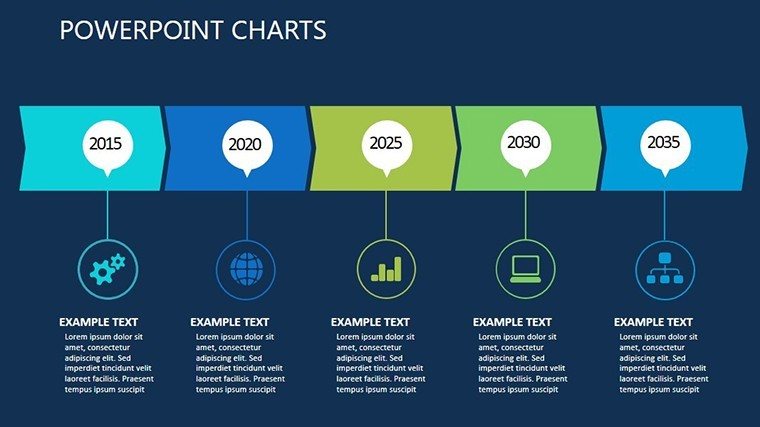
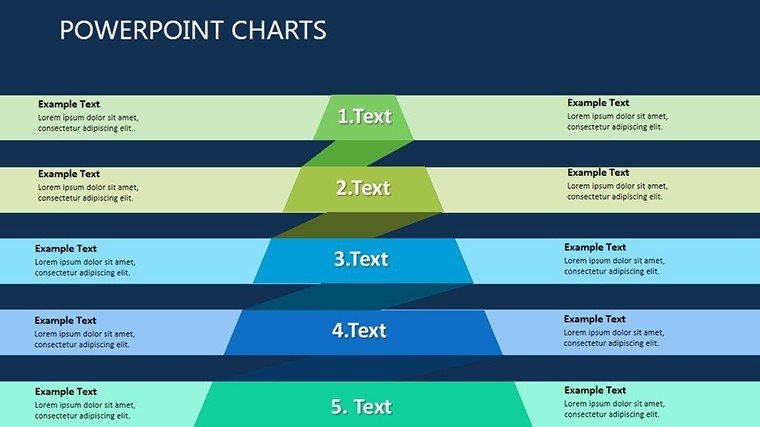
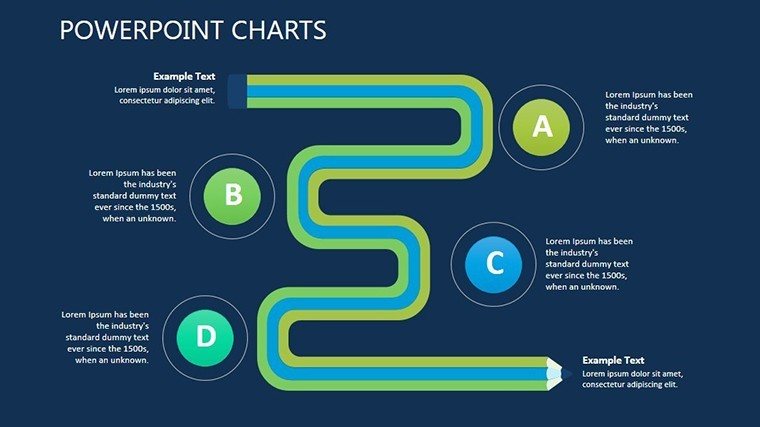
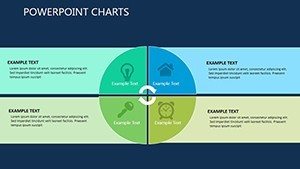
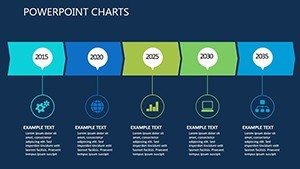
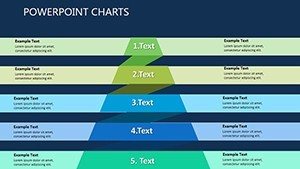
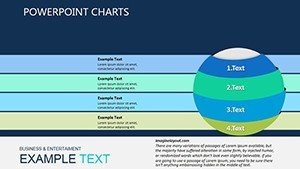
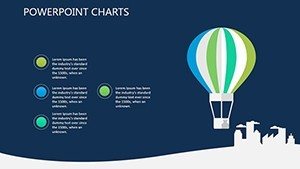
2. Infographic Excellence for Enhanced Comprehension: Transform complex financial information into easily digestible infographics. Whether it's trends, comparisons, or projections, our template provides a comprehensive suite of graphical tools for effective communication.
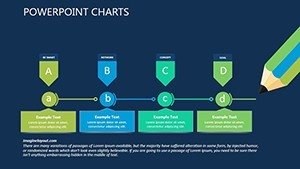
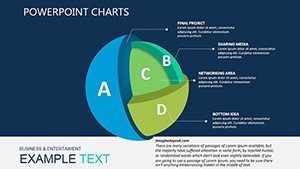
3. Customization at Your Fingertips: Tailor each chart to suit your specific needs. With editable elements, color schemes, and fonts, you have complete control over the visual narrative, ensuring seamless integration with your brand.
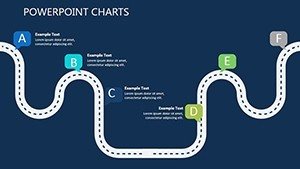
4. Seamless Download for Instant Deployment: Our template is available for immediate download, allowing you to incorporate compelling financial visuals into your presentations without delay.
Who Can Benefit?
- Financial Analysts and Consultants: Streamline your data-driven insights with visually compelling charts.
- Executives and Decision-makers: Enhance boardroom presentations with impactful financial visuals.
- Educators and Trainers: Simplify complex financial concepts for students and trainees.
Elevate your financial presentations to new heights with our editable PowerPoint charts template. Download and unlock the potential for impactful, data-driven storytelling in your reports. Empower your audience with visually stunning infographics, setting a new standard for financial analysis presentations.
Remember, our template is not just a tool; it's a catalyst for transforming your financial data into a compelling narrative that resonates with your audience. Experience the difference today!