Global Finance Analytics PowerPoint Charts Template (18 Slides)


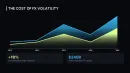


This template contains 18 slides built around three-color variance logic (positive, negative, total). Each waterfall chart uses PowerPoint's native connector lines - these lines stay attached to the correct bar even when you change the data values. Area charts are pre-grouped with semi-transparent fills, so overlapping series remain readable without manual reordering.
Practical Editing Behavior
- In waterfall slides, the "start" and "end" bars use a fixed darker shade; changing theme colors does not override these two bars automatically - you'll need to update them manually via Shape Fill.
- Area charts have the transparency set at 40% on the slide master. If you duplicate the slide, the transparency setting copies over, but unlinking the chart resets it to solid.
- Labels on the horizontal axis show a 3-month rolling format by default. Resizing the chart container may truncate the last two labels - use the axis options to adjust text angle.
Technical Advantages
- Waterfall connector lines preserve position after data changes
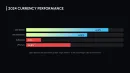
- Three-color scheme (green/red/blue) hard-coded for variance reporting
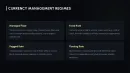
- Slide master contains 6 pre-set data label positions
- Works offline - no external data links required
Technical Specification
| Slides | Formats | Aspect ratio | Editable elements | Color customization | Software |
|---|---|---|---|---|---|
| 18 waterfall + area | .pptx | 16:9 | All bars, connectors, labels, series names | Manual fill for start/end bars; theme colors for standard bars | PowerPoint 2019+ (connector lines require 2019 or newer) |
Frequently Asked Questions
- Do connector lines break if I delete a bar in the waterfall chart? Yes. Deleting a bar removes the segment connector. Undo or rebuild the chart from a fresh slide.
- Can I change the three-color scheme to a different palette? Use the "Replace Colors" tool. Positive (green) and negative (red) bars are controlled by two distinct shape styles on the master.
- Are these charts editable in Keynote? The .pptx opens in Keynote, but waterfall connector lines will become ungrouped standard lines. Use PowerPoint for full connector behavior.
Related: Waterfall chart templates | Variance analysis templates