Empower your slides with Gantt chart templates optimized for Microsoft PowerPoint, where data-driven visuals meet storytelling prowess. These charts help dissect projects into digestible segments, ideal for reporting progress or forecasting outcomes.
Aimed at analysts, managers, and consultants, they provide robust tools for embedding charts that update dynamically with linked data. Benefit from high-contrast designs that pop on screens, ensuring every detail resonates.
Covering everything from sales pipelines to R&D cycles, our templates facilitate precise communication. Jump into the PowerPoint Gantt world and craft narratives that drive decisions. Browse the collection to find your match.
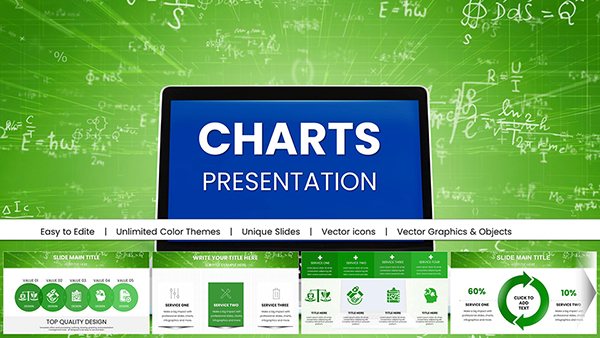
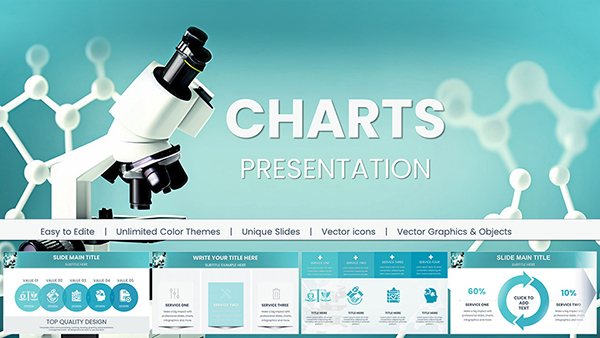
Circuit Service, Ideas and Processes PowerPoint Charts Template: Cycles for Architects
ID: #PC00683
$18.00
(1025)
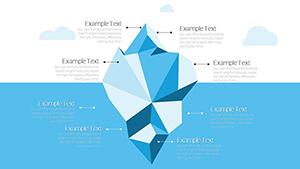
Editable Analytics Tutorial PowerPoint Charts Template: Insights for Architects
ID: #PC00681
$22.00
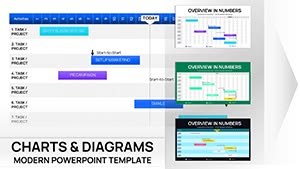
Elevating Presentations with PowerPoint Gantt Charts
PowerPoint excels at interactive charts, and our Gantt templates harness this by integrating SmartArt enhancements and VBA snippets for auto-updates. Far from plain bar graphs, they offer swimlane views for multi-team coordination.
Envision a quarterly review where Gantt bars morph with click triggers, revealing sub-tasks - far more engaging than static images. Versus default charts, ours include preset color schemes aligned with corporate palettes.
Industry-Specific Applications
Finance: Track budget allocations and expenditure timelines with fiscal year overlays.
IT: Diagram software deployments, noting testing and rollout phases.
HR: Schedule training programs, mapping cohorts to skill-building modules.
This versatility outshines generic tools, with built-in accessibility tags for inclusive sharing.
Key Differentiators and Design Strategies
Standout elements include pivotable data tables beneath charts for on-the-fly adjustments. Best practices: Anchor charts to master slides for consistency and use morph transitions for timeline evolutions.
For creativity, overlay Gantt with infographics - like pie charts for resource splits - creating hybrid slides that inform and inspire. Perfect for boardroom strategizing.
Transform your slides? Select from PowerPoint Gantt charts and integrate seamlessly.
Optimization Techniques for Impact
Balance density: Limit to 10 tasks per slide for focus.
Leverage themes: Sync with deck-wide motifs for unity.
Add tooltips: Hover effects for extra context in live demos.
Compress files: Keep under 10MB for swift loading.
These methods, proven in high-stakes environments, amplify your message.
Case Studies and Innovative Uses
A consulting firm charted merger integrations, with Gantt linking legal reviews to cultural alignments - securing a multi-million deal through clear foresight.
In retail, visualize inventory cycles with seasonal peaks, aiding demand forecasting. Experiment with 3D bars for immersive quarterly overviews.
Scalable from solos to enterprises, they adapt effortlessly.
Frequently Asked Questions
These insights pave the way for confident use. Discover more with our PowerPoint template suite.
Detailed at 1,100 words, these resources fuel your analytical edge. Download and chart your course.