Editable Analytics Tutorial PowerPoint Charts Template: Insights for Architects


Type: PowerPoint Charts template
Category: Analysis
Sources Available: .pptx
Product ID: PC00681
Template incl.: 40 editable slides
Harness the power of data to fuel your architectural visions with our Editable Analytics Tutorial PowerPoint Charts Template. Featuring 40 editable slides, this comprehensive resource equips you to visualize metrics from site analyses to performance reviews, turning numbers into narratives that drive decisions. Whether tracking sustainability scores or budget variances, it aligns with AIA data-driven practices, helping you present evidence-based designs that impress clients and collaborators alike.
Why Analytics Matter in Modern Architecture
In an era where data informs every facet of design - from energy modeling to occupant behavior - robust visualization tools are essential. This template provides a tutorial-like structure, guiding users through chart creation while offering pre-built options for immediate use. Its compatibility with PowerPoint and Google Slides ensures flexibility, allowing architects to iterate on insights without technical barriers.
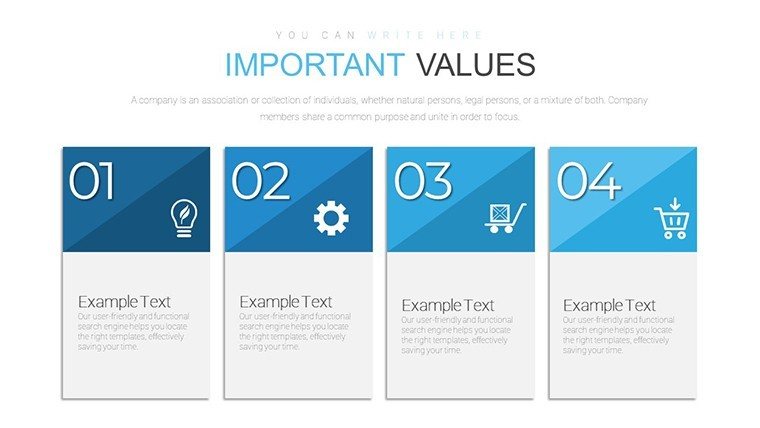
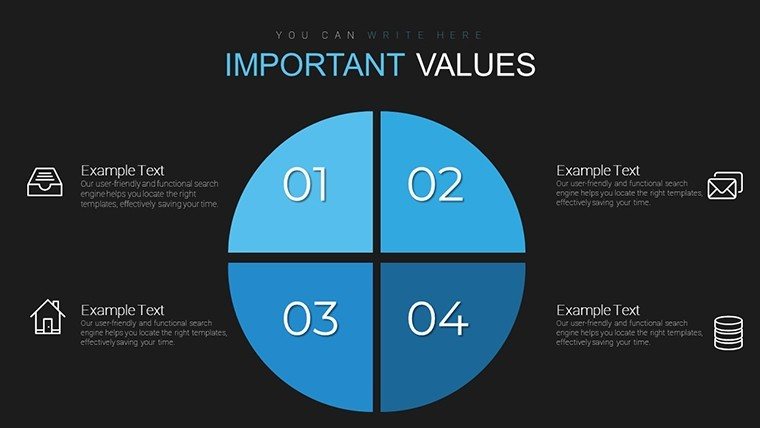
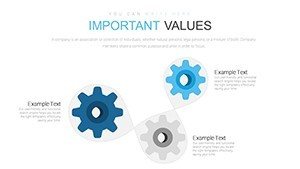
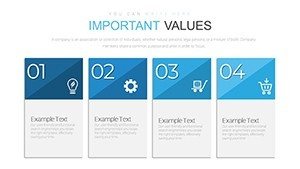
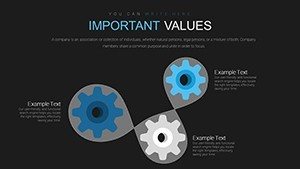
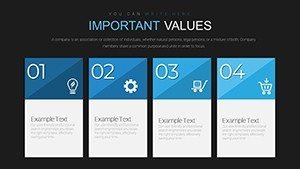
Essential Features for Data Mastery
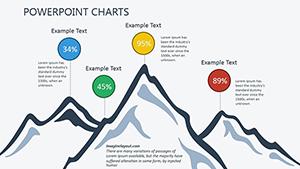
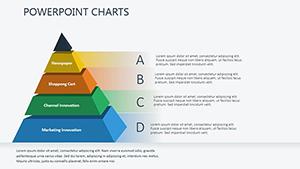
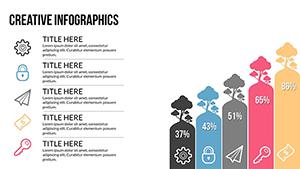
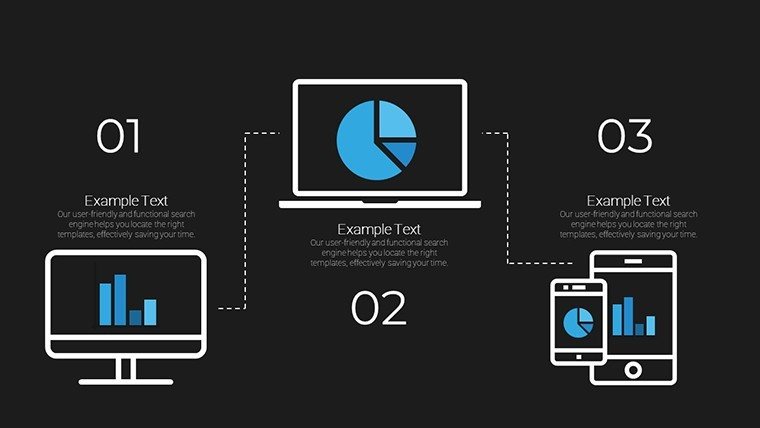
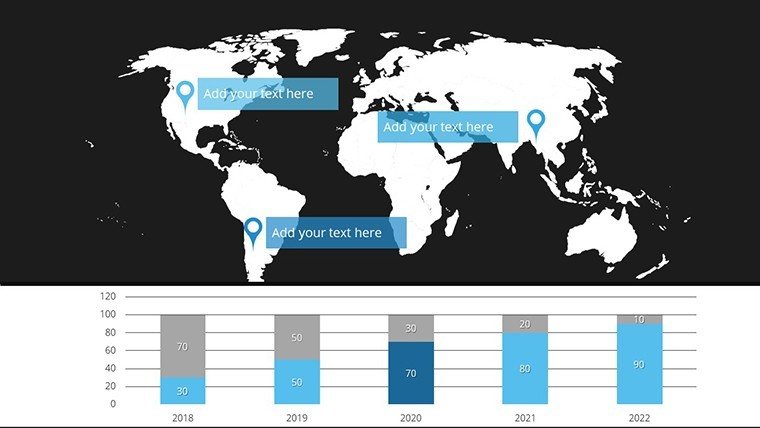
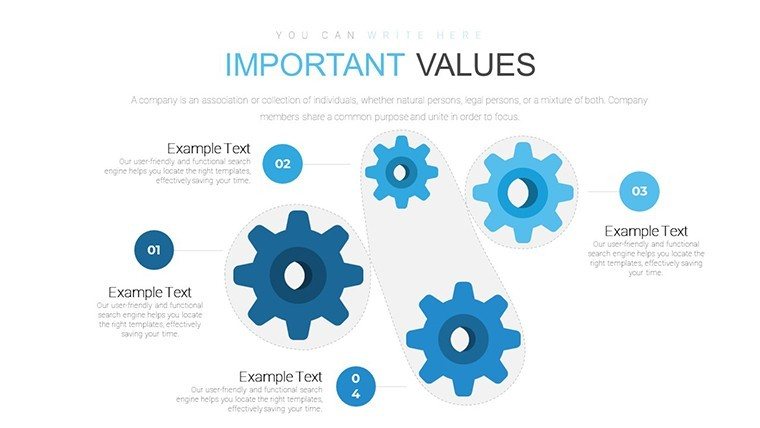
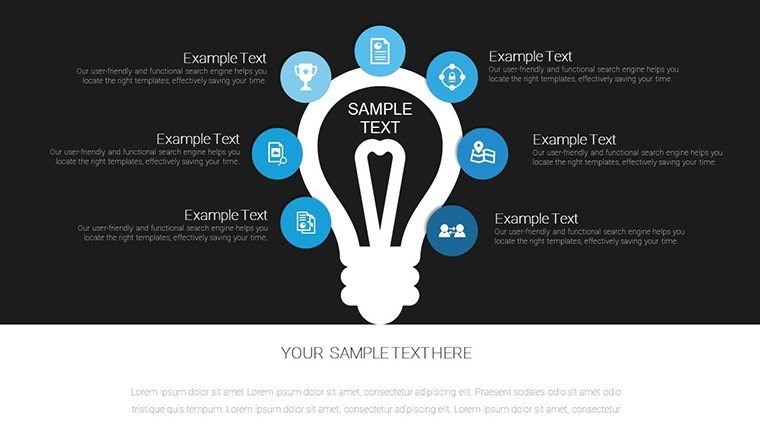
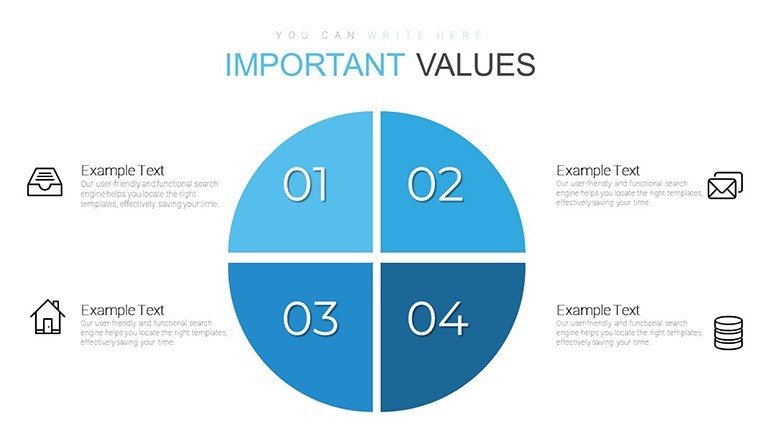
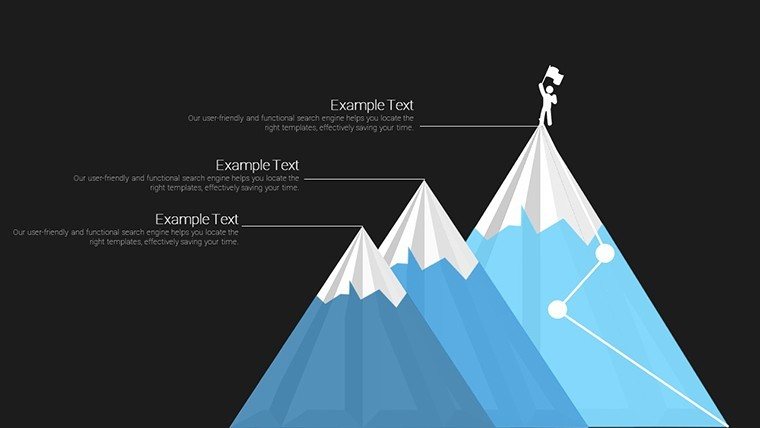
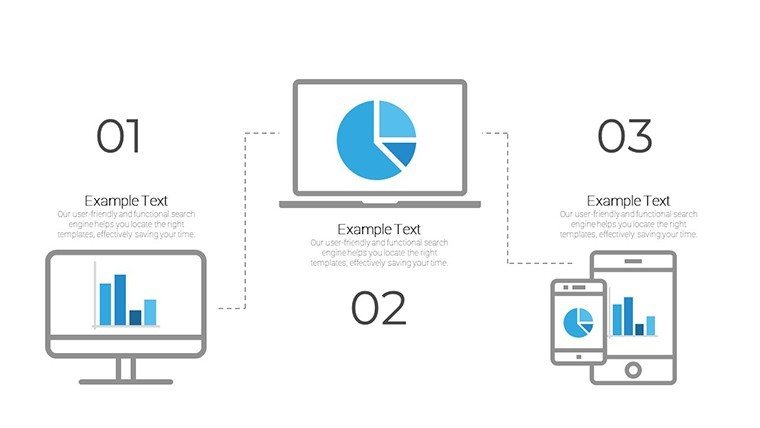
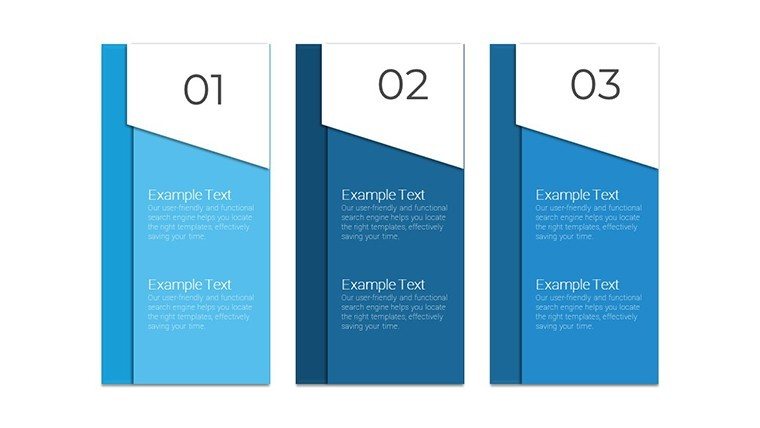
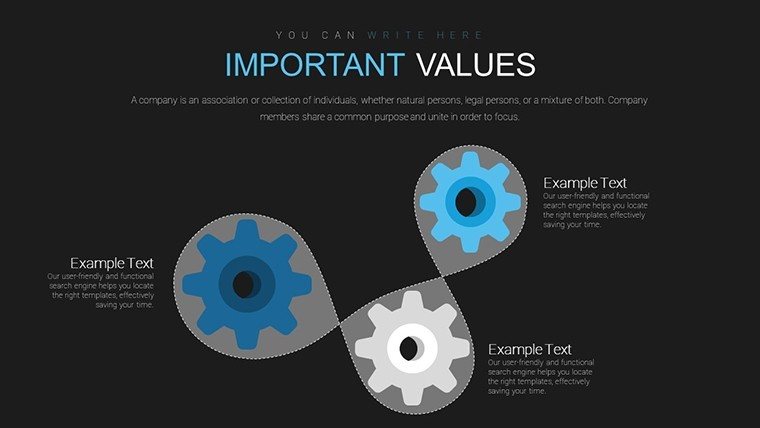
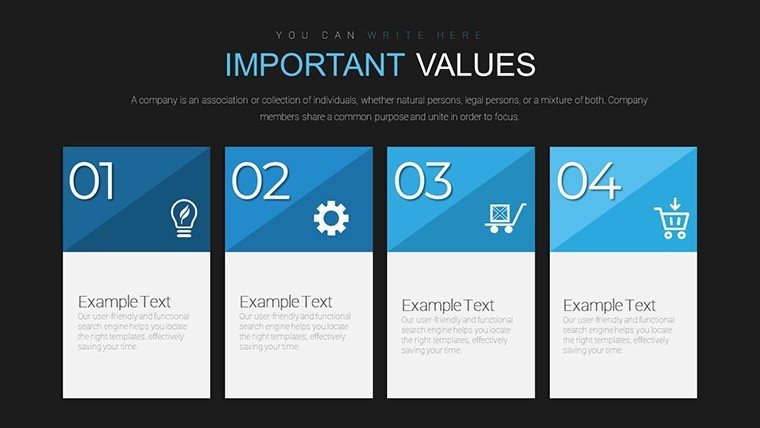
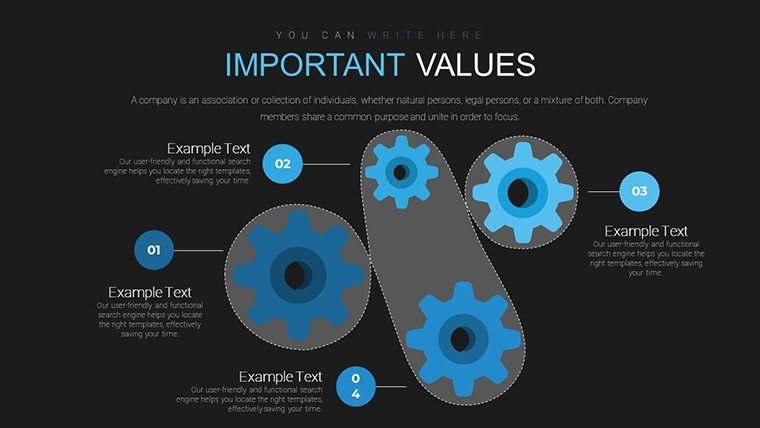
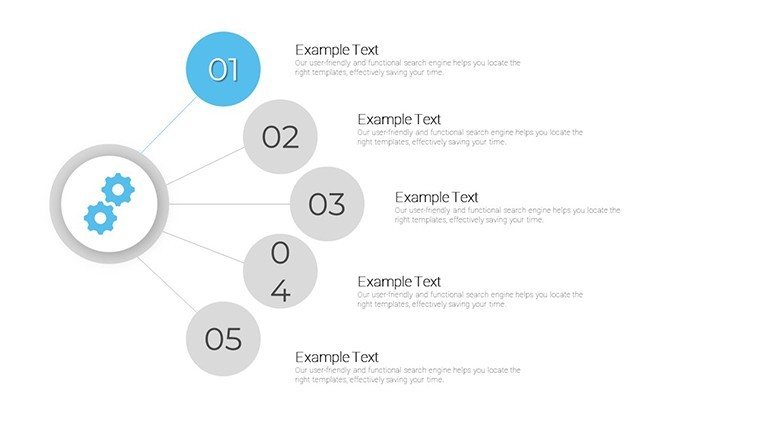
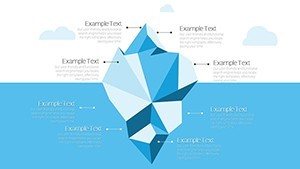
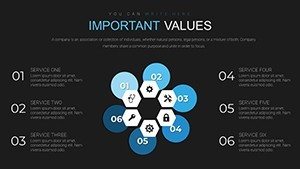
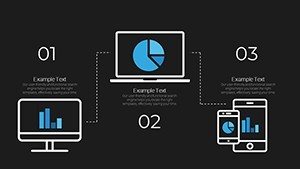
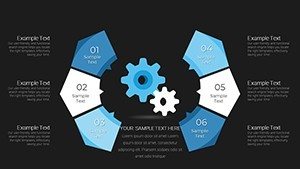
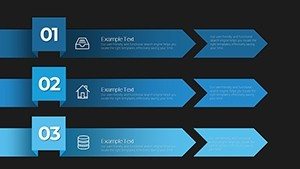
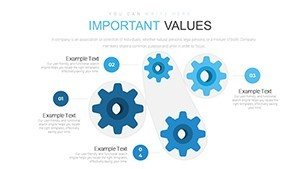
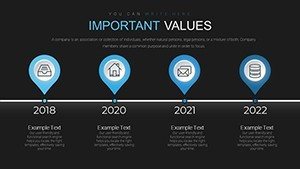
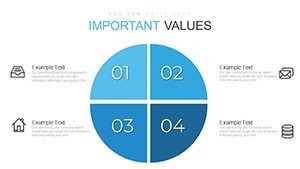
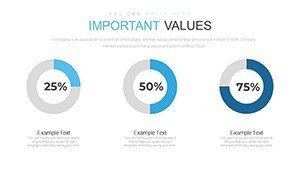
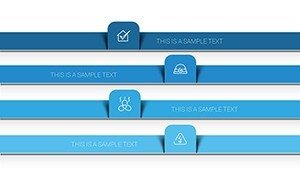
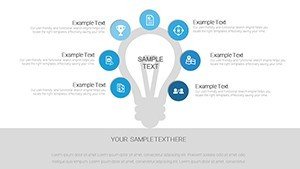
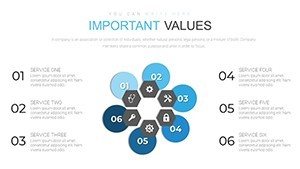
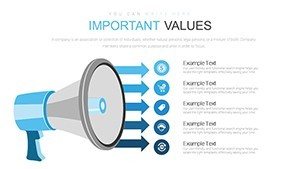
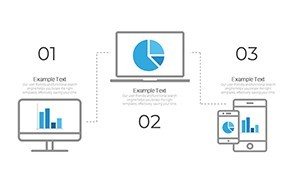
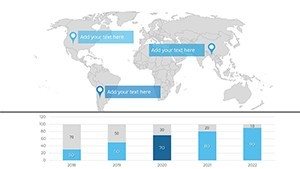
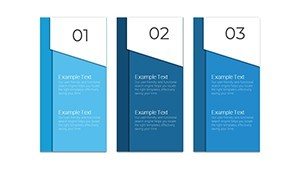
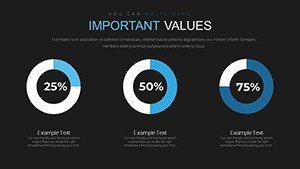
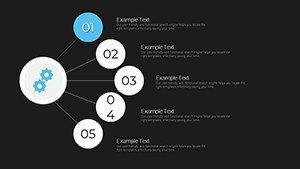
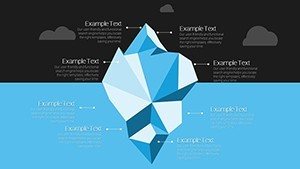
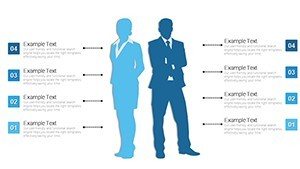
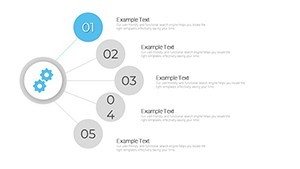
- Varied Chart Types: Bar, pie, line, and more, customizable for metrics like cost per square foot or material efficiency.
- 40 In-Depth Slides: Including tutorials, samples, and advanced analytics setups for thorough explorations.
- Professional Polish: Sleek designs that elevate reports, with easy data import from tools like Excel.
- Time-Efficient Tools: Pre-populated examples accelerate setup, freeing time for creative pursuits.
Naturally incorporating analytics visualization and metric charting enhances discoverability for professionals seeking insightful resources.
Architectural Analytics in Action
Envision a firm analyzing post-occupancy data for a high-rise: Using bar charts to compare energy use pre- and post-retrofit, they justified upgrades to stakeholders, echoing USGBC benchmarks. This template facilitated clear, compelling visuals, reinforcing their expertise. For educators in architecture programs, it's invaluable for teaching quantitative methods, dissecting data from case studies like net-zero buildings.
Step-by-Step Analytics Workflow
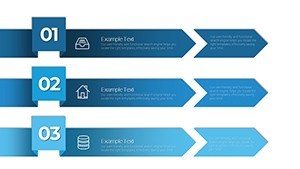
- Launch with Tutorial Slides 1-5: Learn basics of data entry and chart selection.
- Apply to Data: Slides 15-30 handle complex sets, like trend lines for project timelines.
- Refine Insights: Use filters and legends to highlight outliers, such as cost overruns.
- Present Findings: Culminate in summary dashboards for holistic views.
This resolves common issues like data overload, promoting informed, efficient designs.
Expert Guidance for Optimal Use
Inspired by data pioneers in architecture, like those at BIG (Bjarke Ingels Group), emphasize trends over raw numbers. Cite reports from the Architectural Research Centers Consortium for authority, perhaps charting innovation metrics. Pro tip: Combine charts in dashboards for multifaceted views, adding subtle humor like "Don't let your data hide in spreadsheets - let it shine!"
Superior to default options, it cuts analysis time, enabling faster iterations in fast-paced projects.
Embedding in Your Practice
Link seamlessly with BIM software for live data pulls, supporting agile methodologies. For teams, shared edits foster collective insights, crucial in multidisciplinary firms. In research, it aids in publishing findings, visualizing surveys on urban trends.
Tackling Data Dilemmas
When insights evade, the tutorial elements demystify, turning novices into proficient analysts.
Unlock your data's potential - download this Analytics template and insight your way to architectural triumphs.
Frequently Asked Questions
What chart types are included?
A wide range: bars, pies, lines, and scatters, all fully editable.
Does it offer data import tutorials?
Yes, step-by-step guides for seamless integration from spreadsheets.
Ideal for beginner analysts?
Perfect, with built-in tutorials to build skills progressively.
Can I create custom dashboards?
Yes, combine multiple charts on slides for comprehensive overviews.
Supports large datasets?
Handles extensive data with performance-optimized designs.
Compatible with older PowerPoint versions?
Works with recent versions; check notes for specifics.