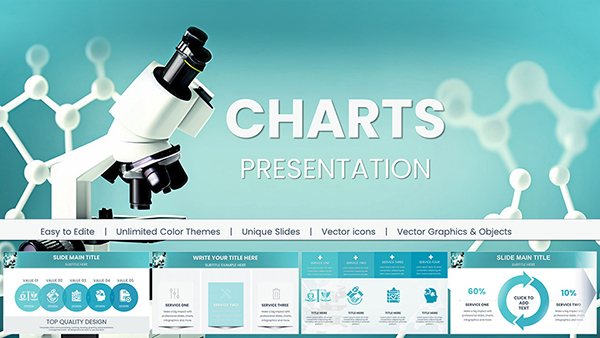
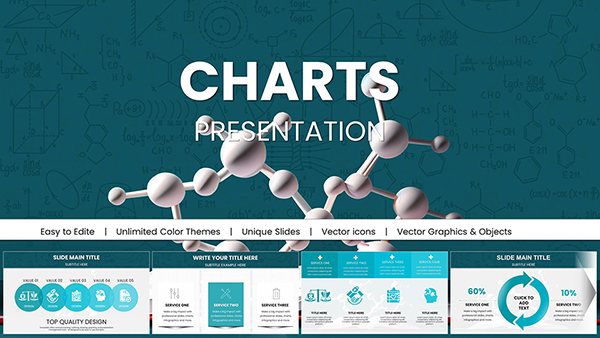
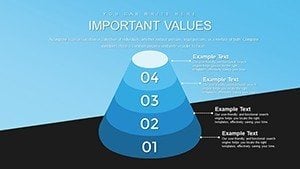
Analytical Market Research PowerPoint Charts Template: Decode Markets Strategically


Type: PowerPoint Charts template
Category: Analysis
Sources Available: .pptx
Product ID: PC00707
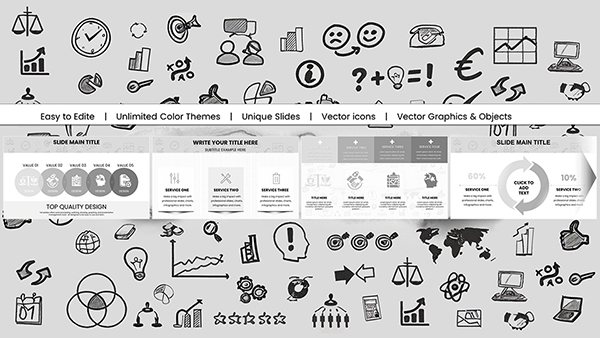
Template incl.: 46 editable slides
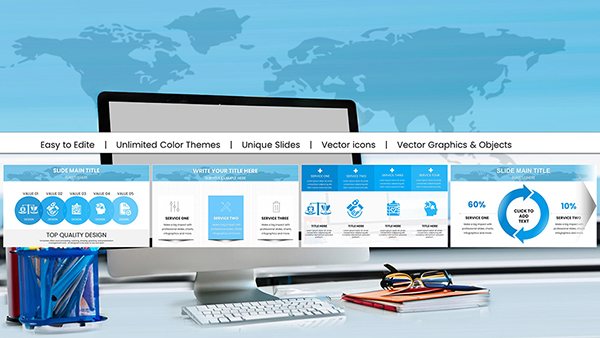
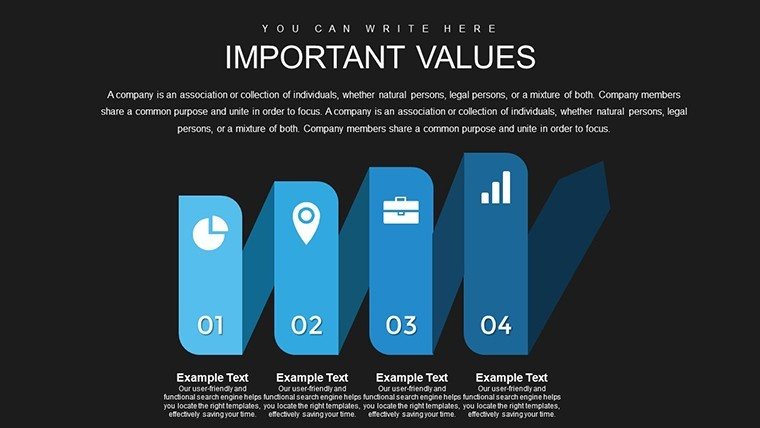
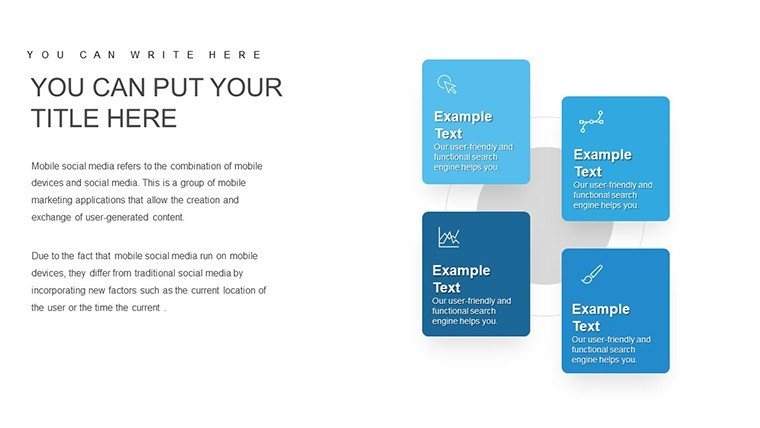
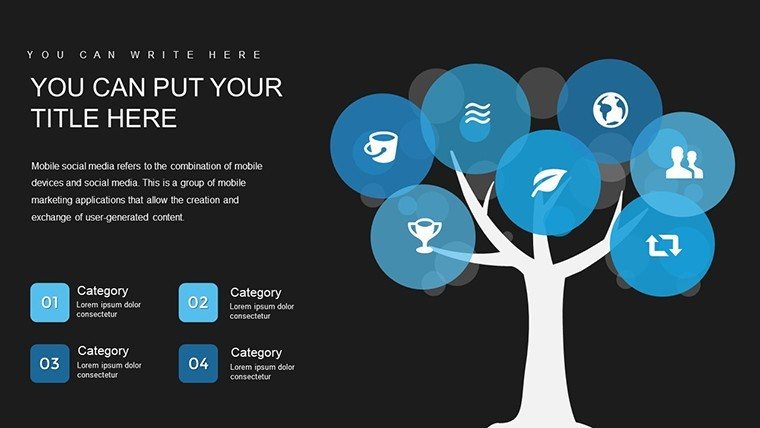
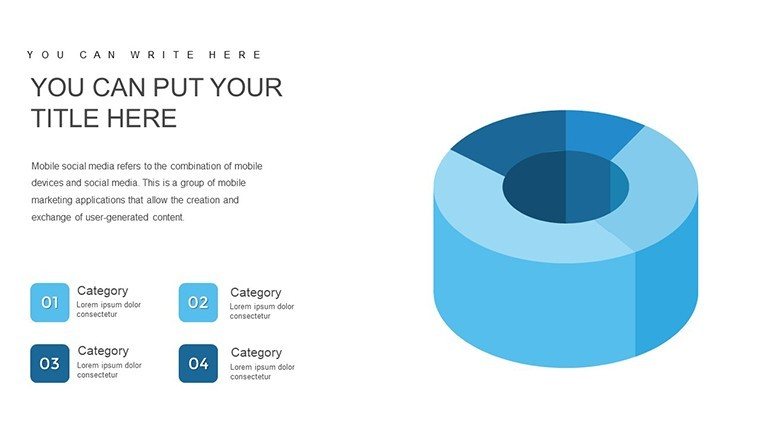
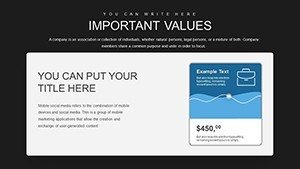
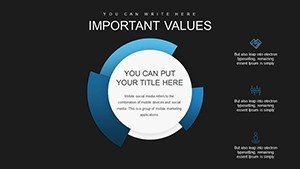
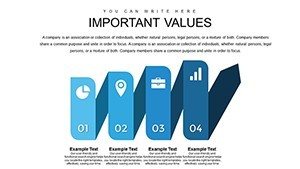
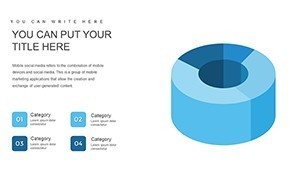
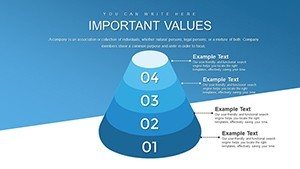
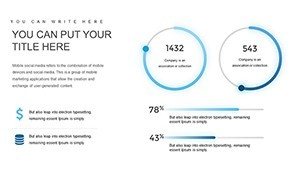
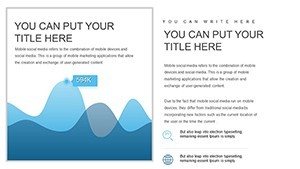
Market research is the backbone of informed business strategies, yet presenting findings can be daunting. Our Analytical Market Research PowerPoint Charts Template equips you with 46 editable slides to distill complex data into strategic gold. Perfect for researchers, analysts, and marketers navigating consumer behaviors and competitive arenas, this template facilitates deep dives into trends with visuals that clarify and convince. Visualize launching a product with charts mapping segmentation, or refining campaigns based on satisfaction surveys - all while maintaining data integrity and engaging stakeholders. It's a blend of precision and creativity, designed to turn data overload into decisive action, drawing on rigorous validation for trustworthy insights.
Navigating Market Complexities with Precision Charts
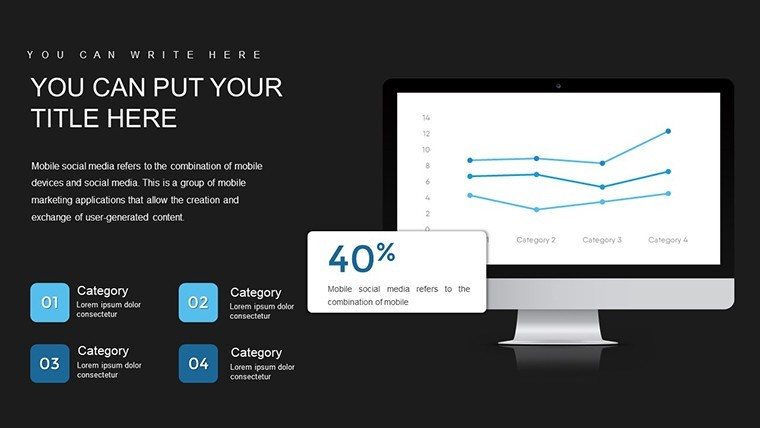
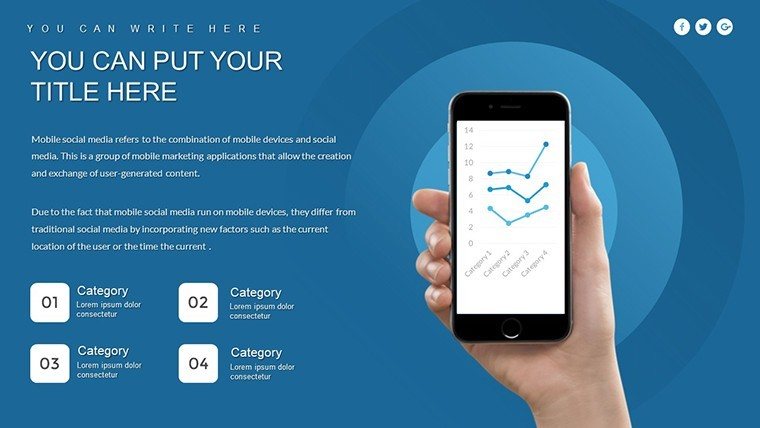
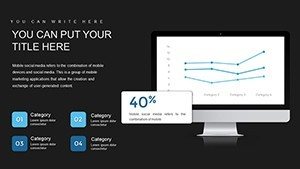
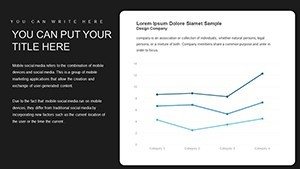
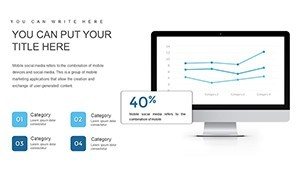
Today's markets demand agility, and this template provides the visual toolkit to respond. Aligned with methodologies from firms like Nielsen, it enables accurate depictions of dynamics, from consumer prefs to competitor moves. For instance, in analyzing survey data, use segmented charts to reveal patterns that inform targeted marketing.
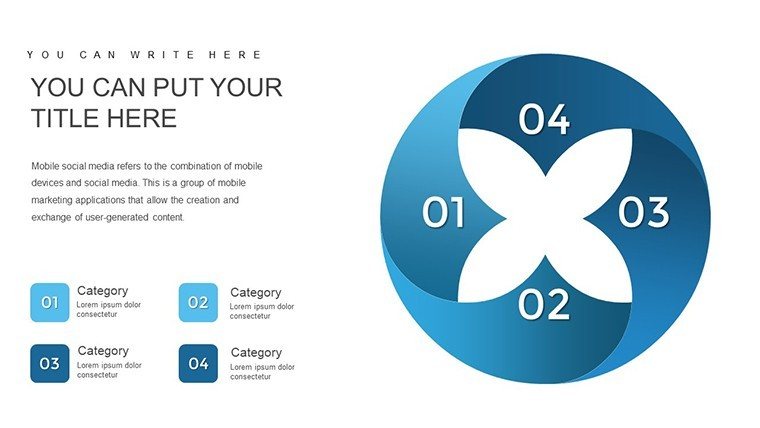
Key Features for Analytical Depth
- Versatile Templates: Adaptable for various research goals, with easy data integration.
- Accuracy Focus: Validated structures ensure reliable visualizations.
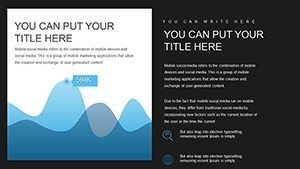
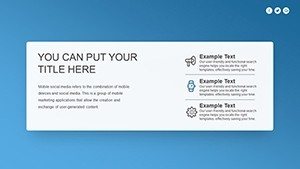
- Engaging Designs: Visually striking charts to hold attention and prompt discussion.
- Time-Efficient: Pre-built slides streamline creation, freeing time for analysis.
- User-Friendly Interface: Intuitive edits for all skill levels.
These attributes make complex research accessible, fostering better stakeholder communication.
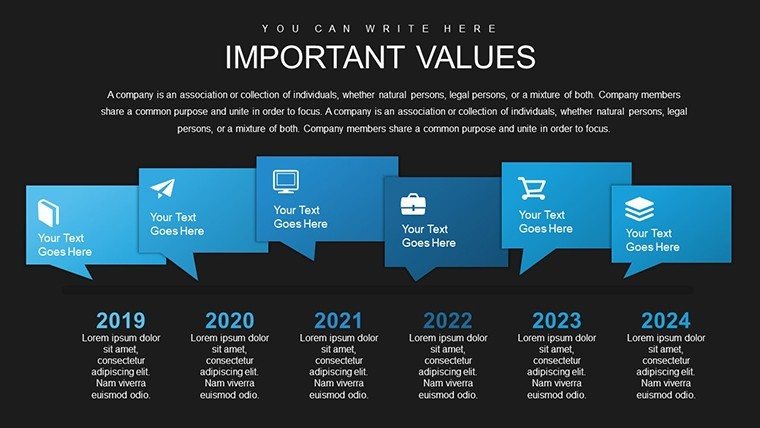
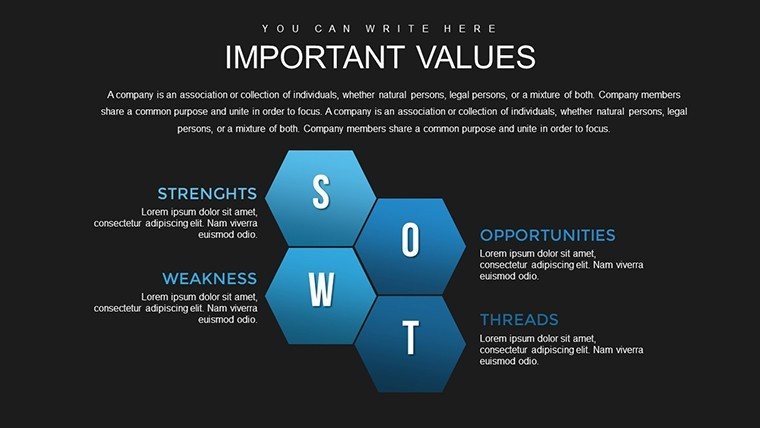
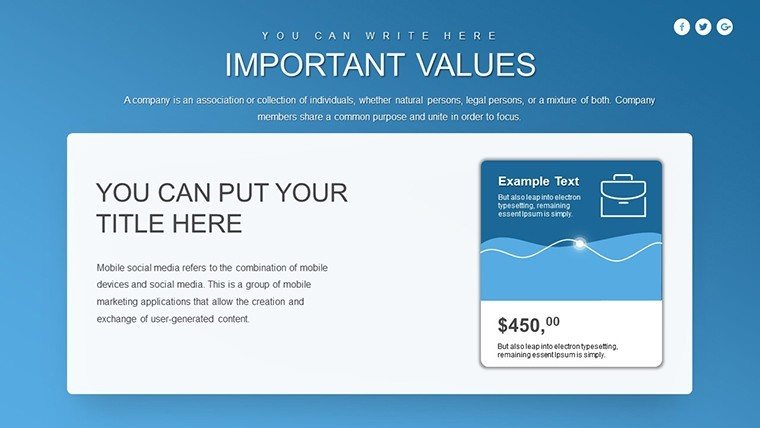
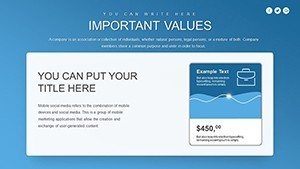
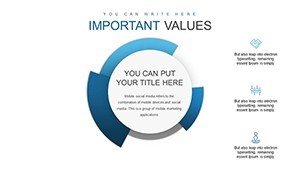
Strategic Applications in Real Scenarios
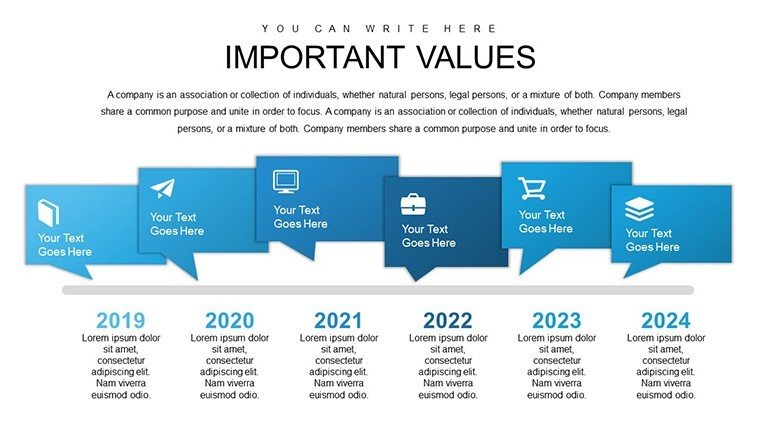
From quarterly reports to segmentation studies, this template adapts seamlessly. Marketers can visualize customer journeys, while analysts track competitive landscapes, enhancing decision-making across launches and expansions.
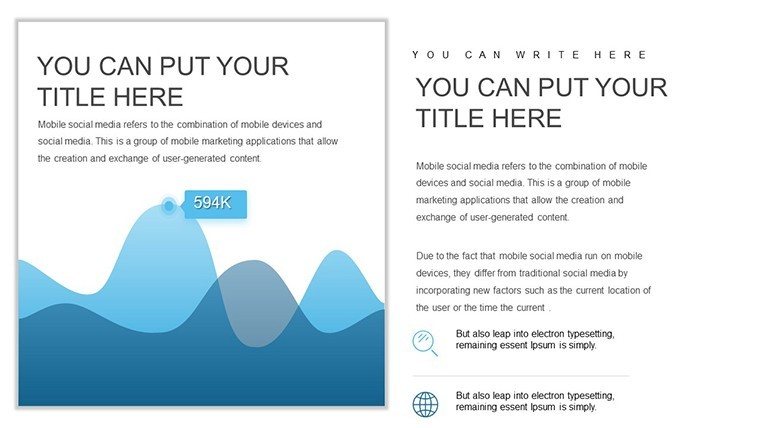
Step-by-Step Use Case: Survey Analysis Presentation
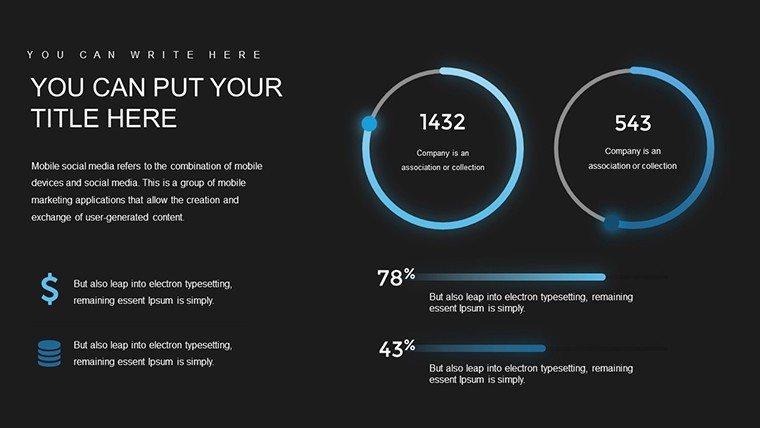
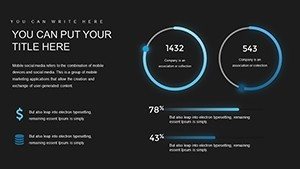
- Compile Data: Input satisfaction metrics into dedicated charts.
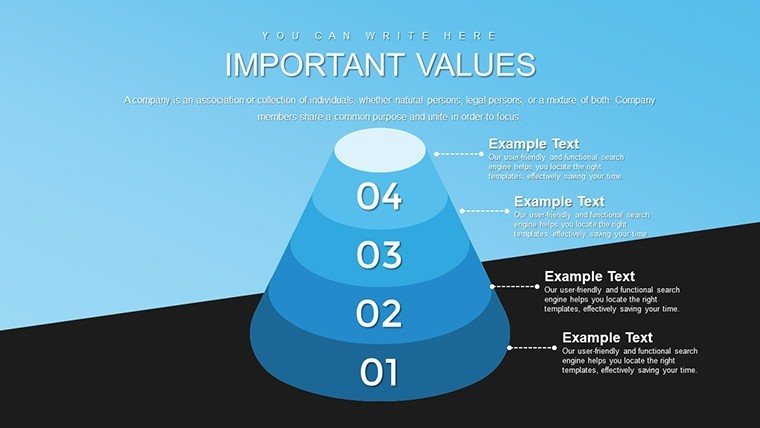
- Segment Insights: Use visuals to break down demographics.
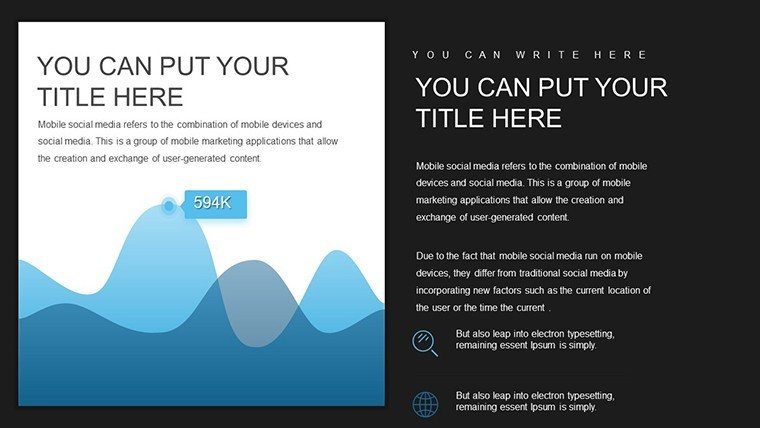
- Highlight Trends: Employ graphs to show correlations.
- Recommend Actions: Conclude with strategy slides for impact.
Superior to basic tools, it offers validated accuracy, potentially improving buy-in as per insights from marketing gurus like Philip Kotler.
Expert Strategies for Market Mastery
Integrate by focusing on key metrics first, then customizing. Reference American Marketing Association (AMA) standards for ethical data use. Tip: Layer charts for multidimensional views; another: Use subtle visuals to avoid overload, enhancing comprehension.
For business analysts, it means sharper reports; for researchers, compelling narratives. It resolves issues like inaccurate visuals, delivering value through informed strategies.
Ideal Users for Market Insights
- Market Researchers: Transform data into actionable stories.
- Business Analysts: Drive decisions with precise visuals.
- Marketing Pros: Refine tactics based on clear insights.
It's crafted to empower your market research endeavors.
Transform Your Research into Results Today
Embrace data-driven excellence with our Analytical Market Research PowerPoint Charts Template - download and strategize smarter.
Frequently Asked Questions
How accurate are the data structures?
Built with validated methods for reliable, error-free visualizations.
Can I handle large datasets?
Yes, slides support extensive data without performance issues.
Is customization limited?
No, full edits on all elements for tailored presentations.
Suitable for team collaborations?
Absolutely, shareable and editable in group settings.
What if I need help?
Support team available for guidance on usage.
Updates included?
Yes, access to future enhancements at no extra cost.