Marketing Research PowerPoint Charts: Unlock Data-Driven Insights


Type: PowerPoint Charts template
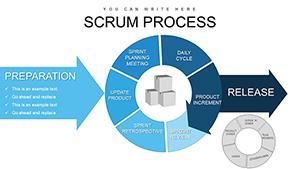
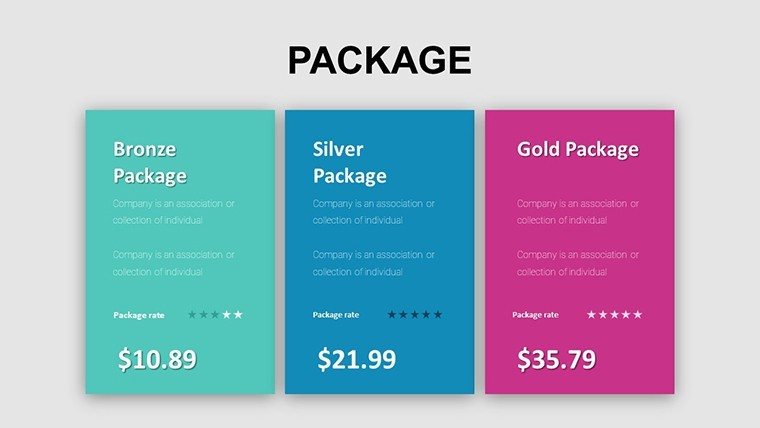
Category: Process
Sources Available: .pptx
Product ID: PC00928
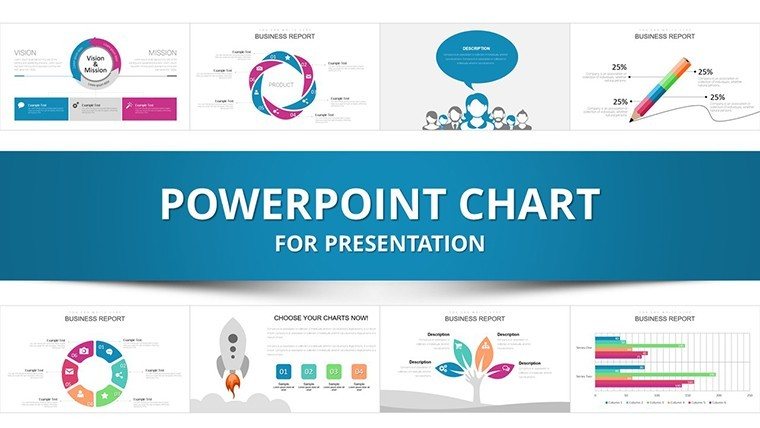
Template incl.: 43 editable slides
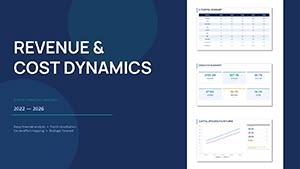
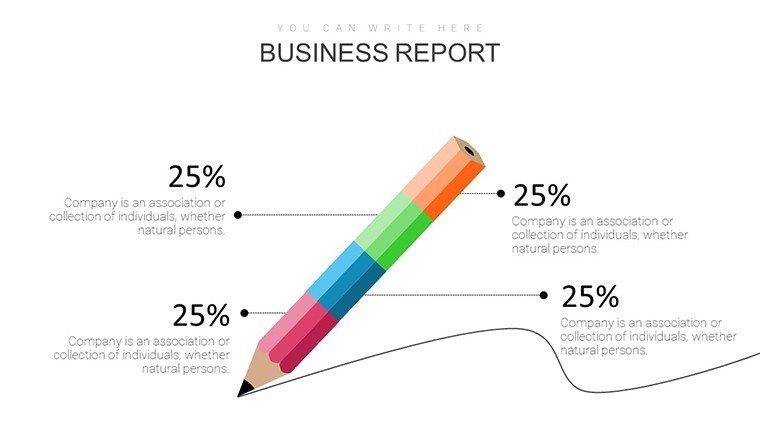
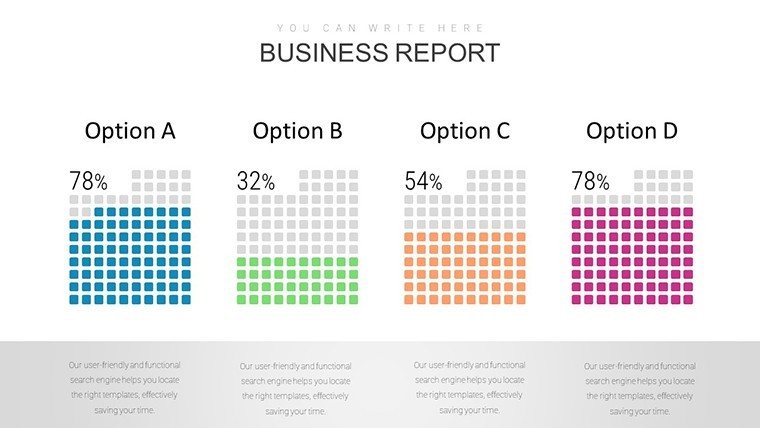
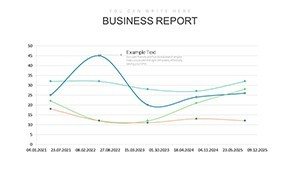
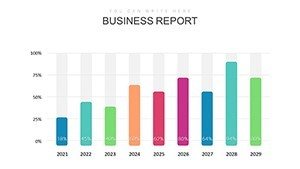
Navigating the complexities of market dynamics requires more than data - it demands compelling visuals that reveal hidden patterns. Our Marketing Research PowerPoint charts template empowers you to do just that. With 43 editable slides, it's crafted for marketing pros, researchers, and academics who turn raw information into actionable strategies. From consumer behavior graphs to trend forecasts, this template brings clarity to chaos.
Inspired by industry standards like those from the American Marketing Association, it emphasizes accurate representation and engaging design. Imagine unveiling a scatter plot of customer preferences in a strategy session, sparking innovative campaigns. This tool not only informs but inspires, making it essential for competitive edges in fast-evolving markets.
Core Features Tailored for Marketing Excellence
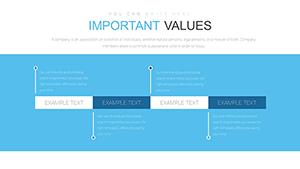
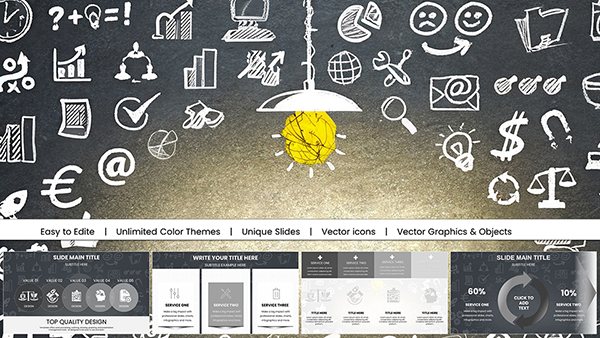
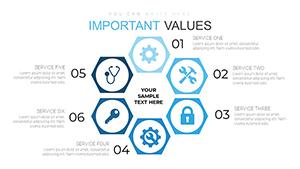
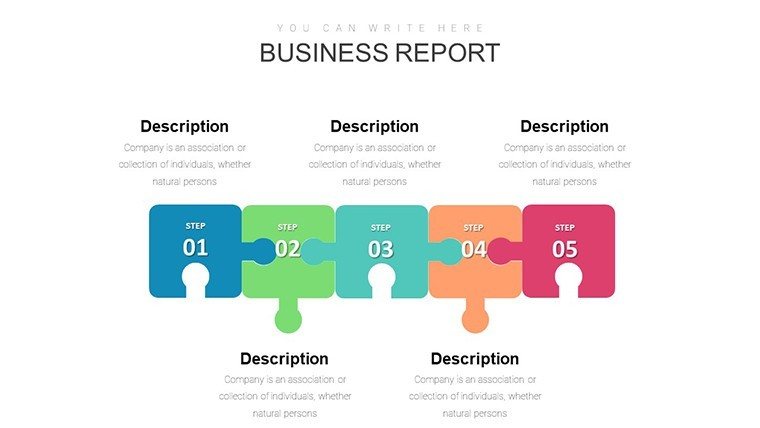
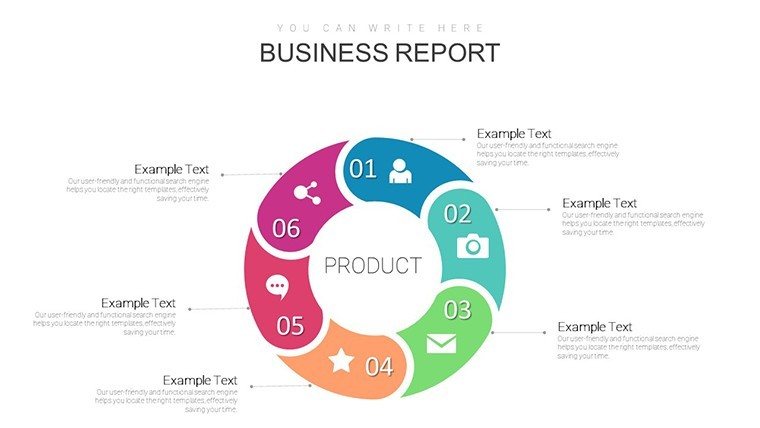
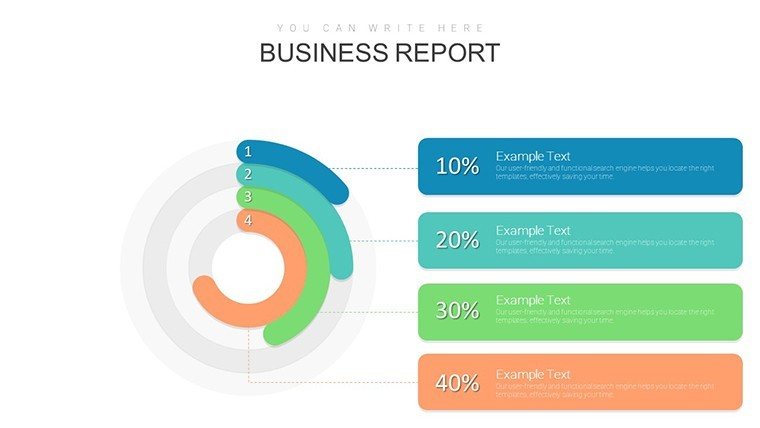
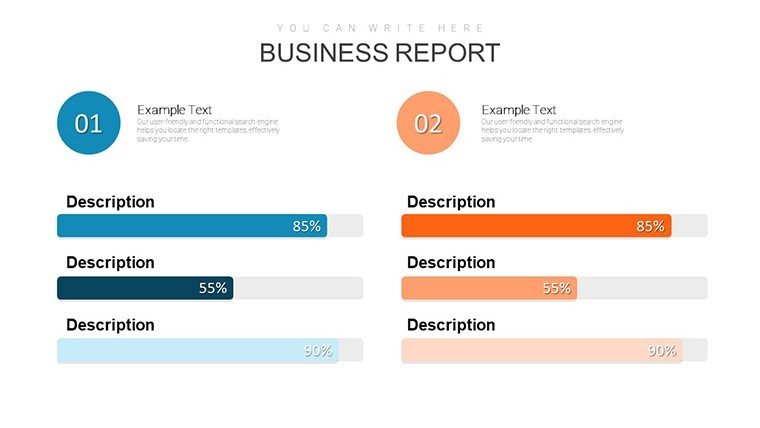
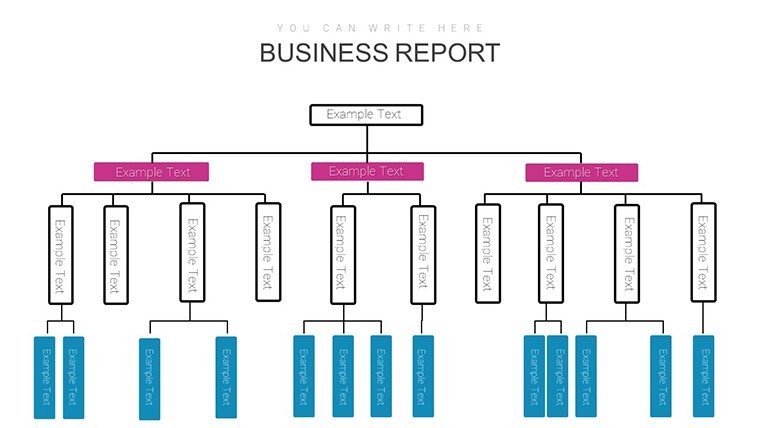
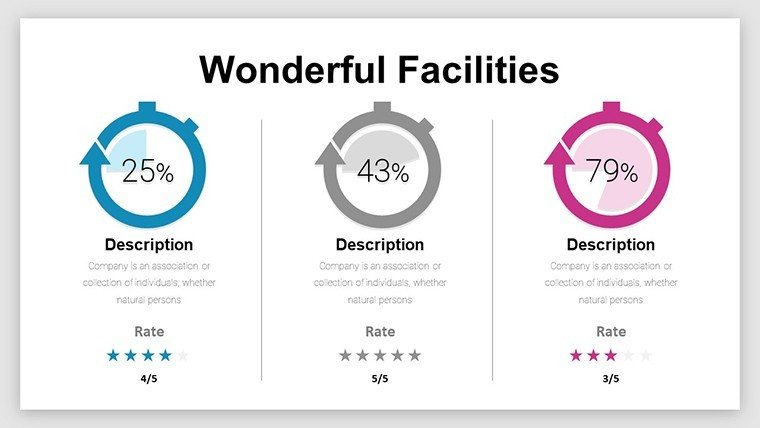
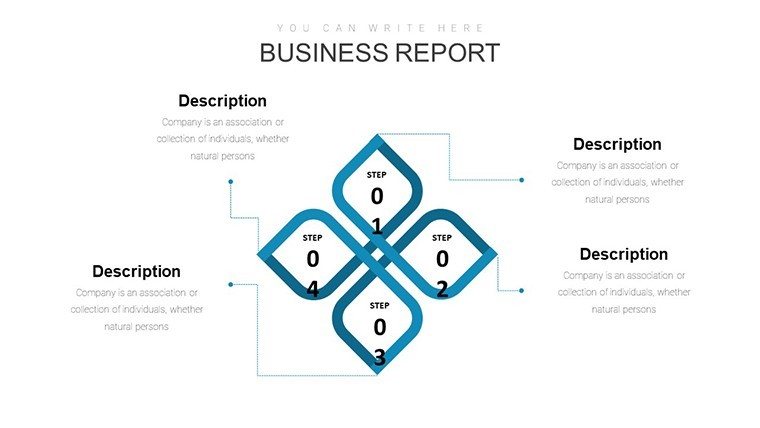
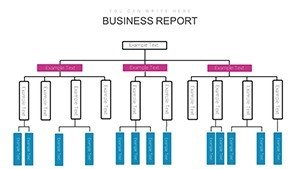
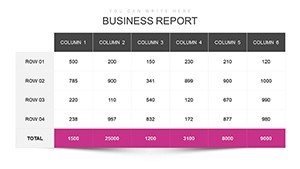
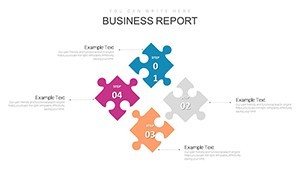
Explore the robust features that make this template indispensable. The 43 slides offer a rich array: dynamic graphs for quantitative data, flowcharts for process mapping, and more. Customization reigns supreme - alter layouts, fonts, and palettes to reflect your brand's voice.
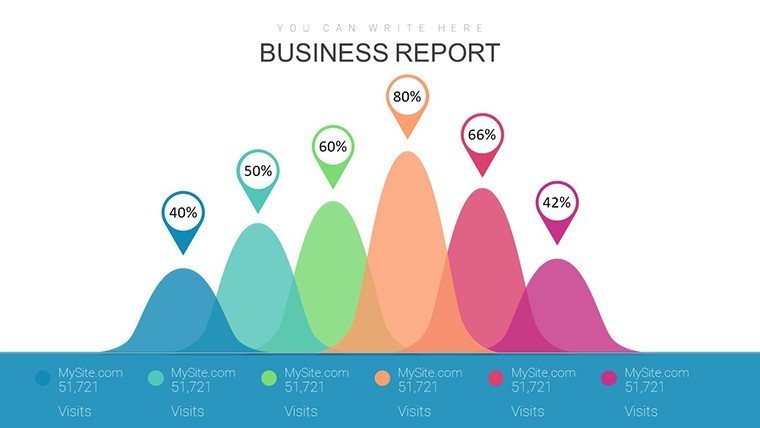
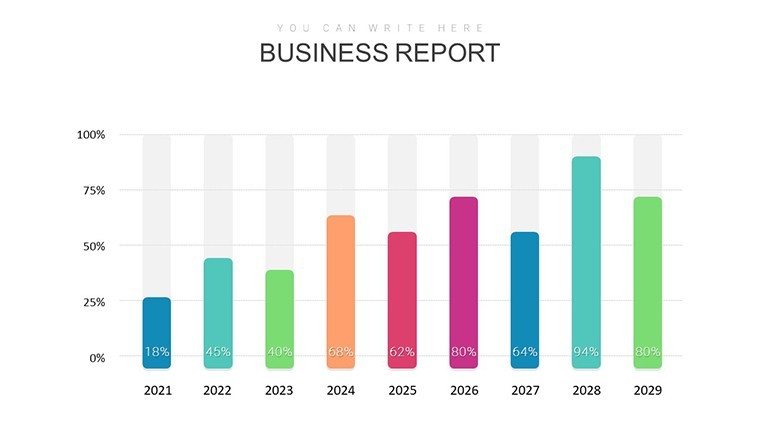
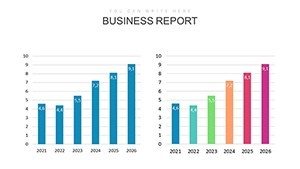
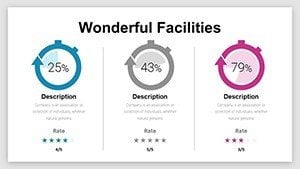
- Advanced Chart Varieties: Bubble charts for multi-variable analysis, histograms for distribution insights.
- Engagement Boosters: Interactive elements like hover tips and embedded links.
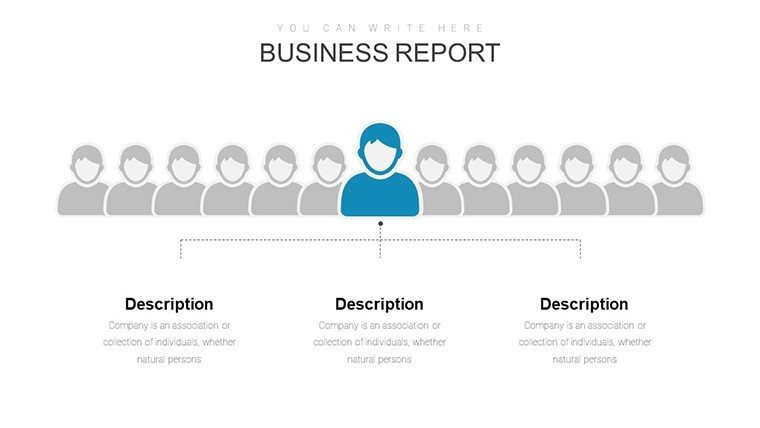
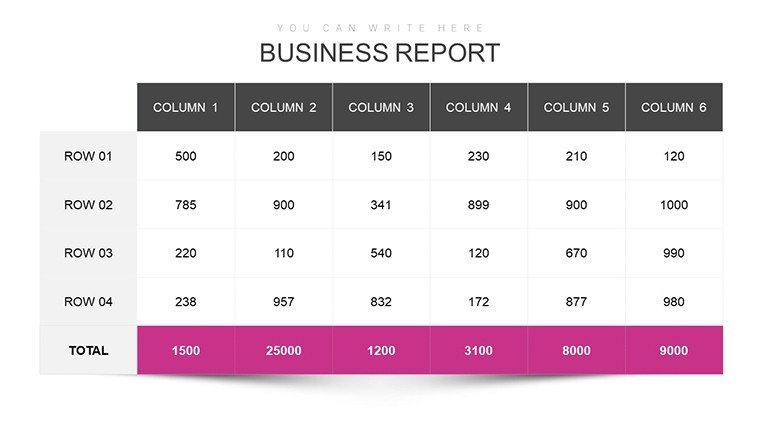
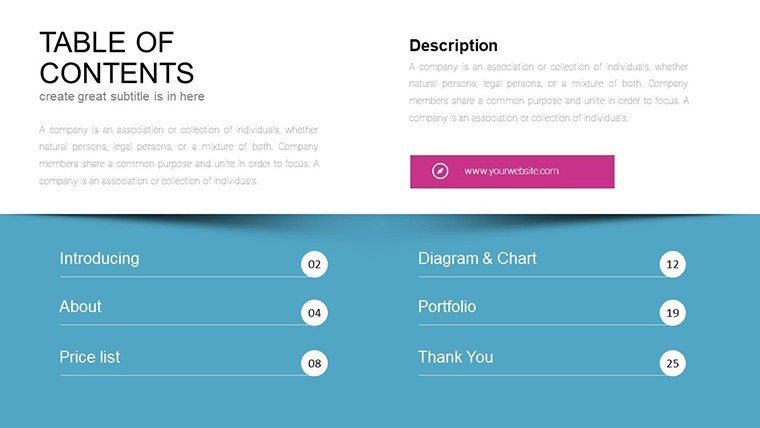
- Professional Polish: Clean, modern aesthetics with space for annotations and sources.
- Scalable Designs: Vector graphics for flawless zooming and printing.
Ease of use defines it; intuitive controls let you focus on analysis, not tech hurdles. Ideal for integrating with research tools like SurveyMonkey for seamless data flow.
Applications and Advantages in Marketing Contexts
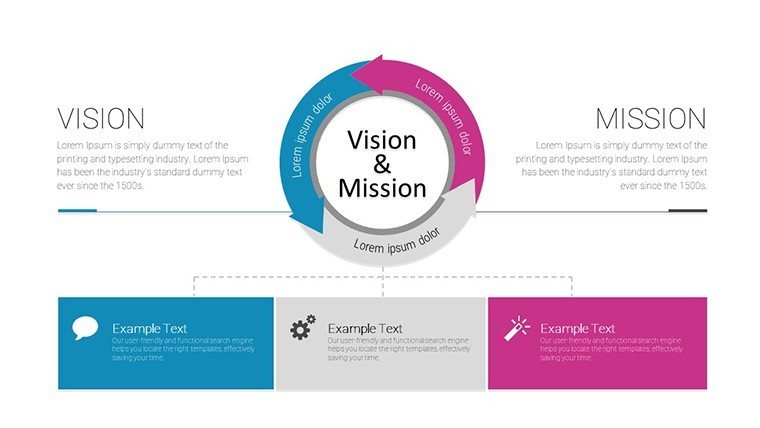
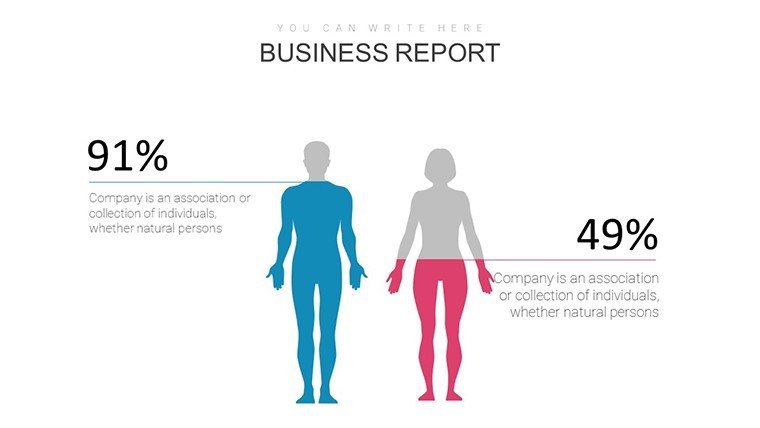
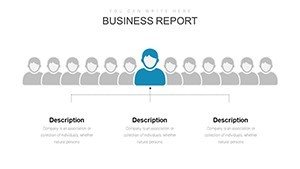
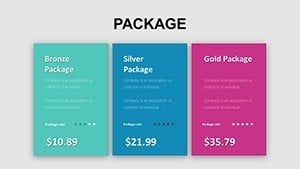
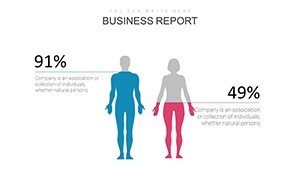
Harness this for diverse uses: In consultancy, map market segments with pie charts; in academia, teach segmentation via visuals. Benefits include heightened persuasion - visuals can increase comprehension by 400%, per Wharton studies - and time savings in report creation.
A walkthrough: Choose a research slide, import data sets. Refine visuals with color coding for segments, add narratives via text overlays. Build a deck that flows from hypothesis to conclusions. Deliver with impact, fostering discussions on next steps.
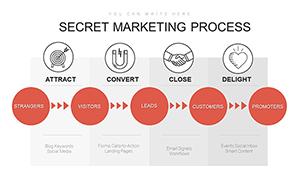
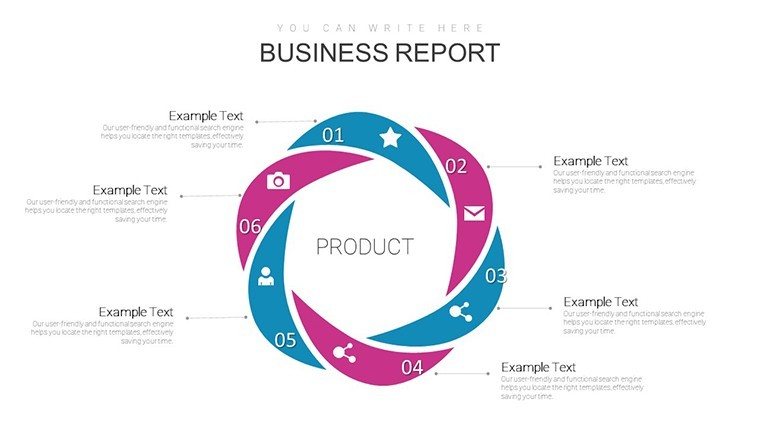
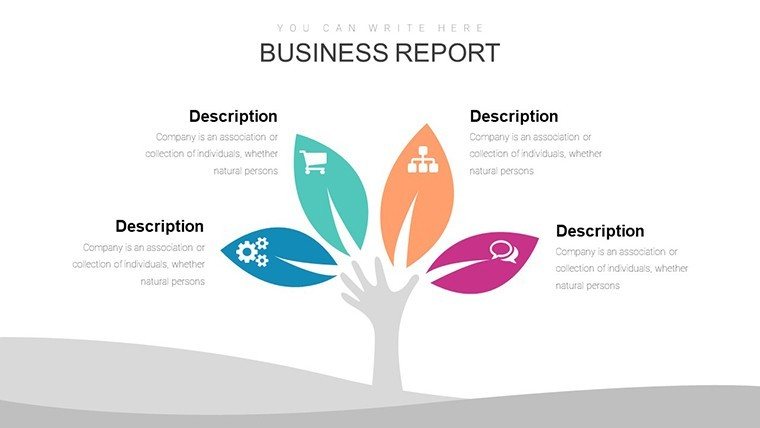
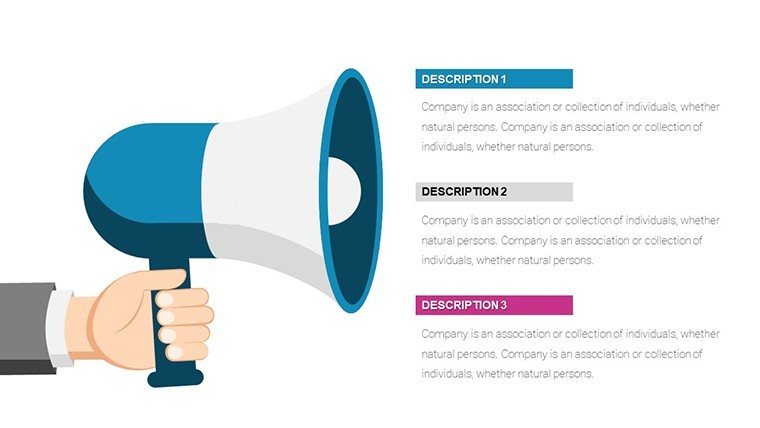
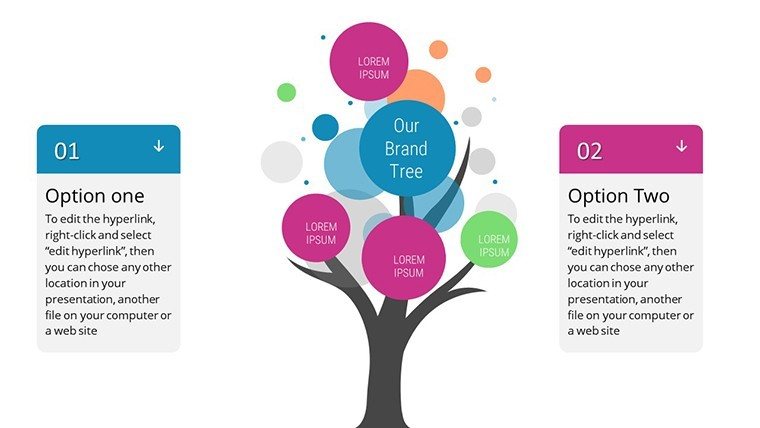
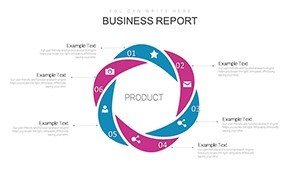
Outshining basic tools, it includes themed marketing icons - like target symbols for audience focus - adding relevance. For process-oriented tasks, visualize workflows, aligning with lean methodologies.
Strategic Tips for Optimal Use
Adapt to your crowd: Detailed for peers, summaries for stakeholders. Infuse storytelling, perhaps with a 'journey' chart for customer paths. Integrate into broader workflows, like exporting to dashboards or sharing via cloud platforms.
Elevate Your Research Game
This template's edge? Its marketing-specific depth, at $24, with strong user feedback. For educators, it aligns with curriculum standards; for consultants, it impresses clients with AIA-like precision in data docs.
Step up your game - secure this Marketing Research charts template and illuminate insights like never before.
Frequently Asked Questions
- Are the charts fully customizable?
- Yes, every element from data to design is editable in PowerPoint.
- Does it support data from external sources?
- Absolutely, import from Excel or CSV for real-time updates.
- Compatible with older PowerPoint versions?
- Works best with 2016+, but basic functions in earlier ones.
- Suitable for non-marketing uses?
- Yes, adaptable for general research or education.
- What about image exports?
- Easily export slides as images for reports or web use.