Financial Analysis Presentation Template - Editable PPTX


Financial Analysis Presentation Template Overview
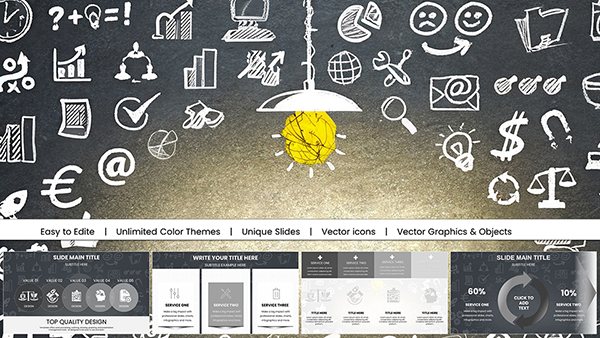
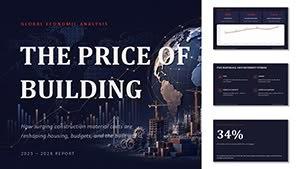
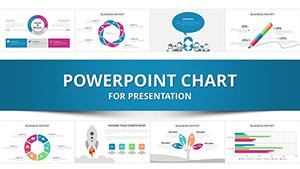
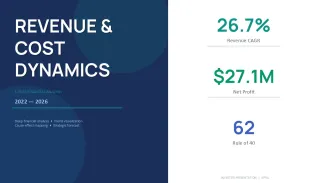
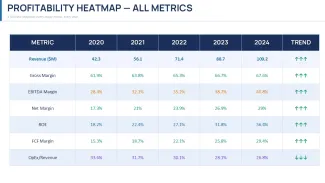
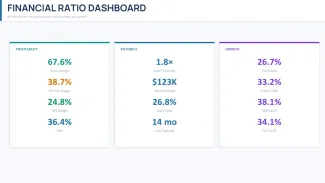
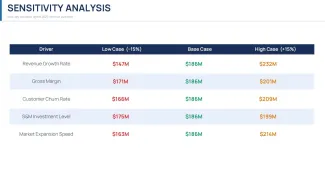
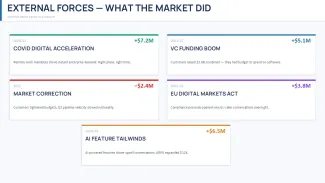
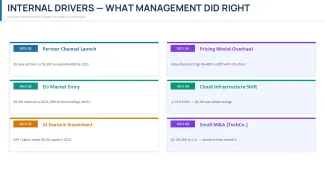
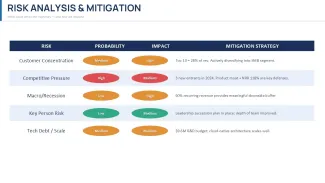
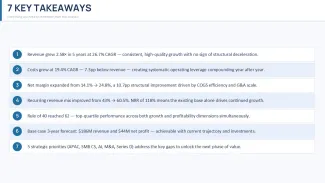
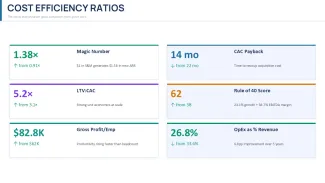
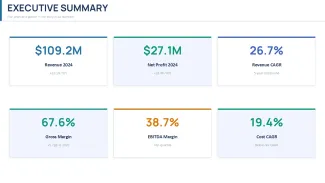
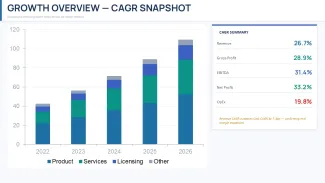
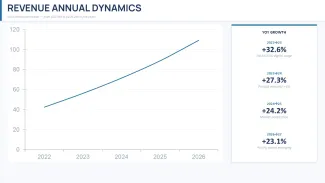
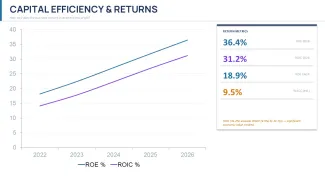
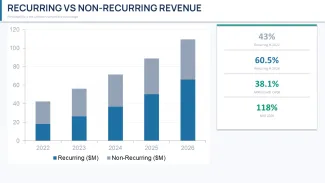
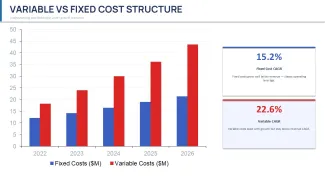
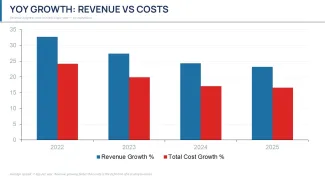
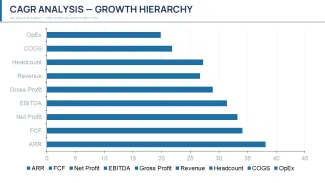
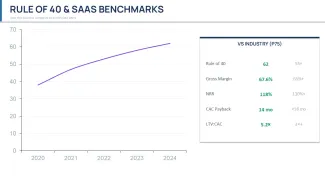
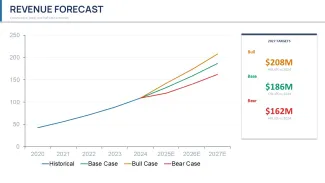
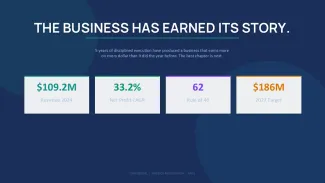
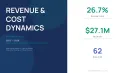
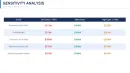
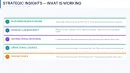
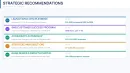
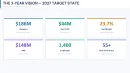
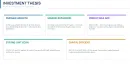
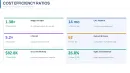
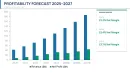
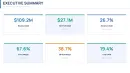
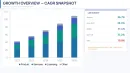
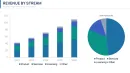
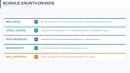
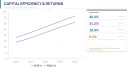
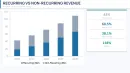
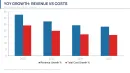
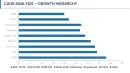
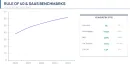
This file is basically a full investor-style deck built around revenue and cost analysis over multiple years. You get around 40+ slides (count based on the actual file structure), and it's not just charts dropped randomly - it's structured like a narrative. There are CAGR breakdowns, revenue streams, cost structures, margin bridges, and even sensitivity tables. It reads like someone actually built this for a boardroom, not just a marketplace listing.
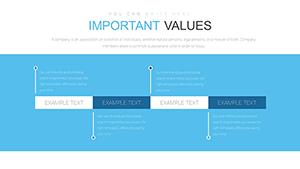
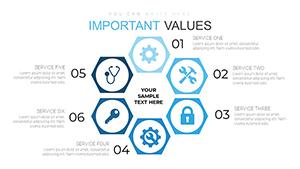
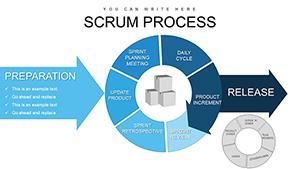
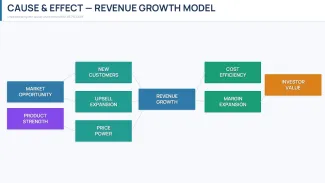
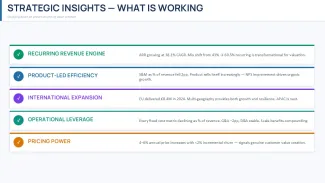
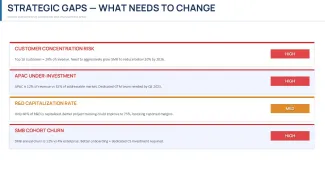
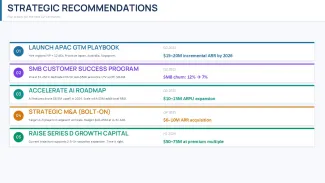
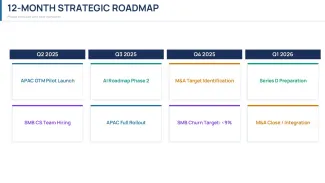
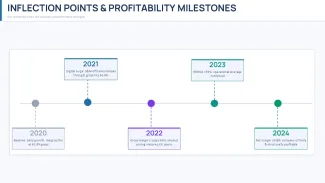
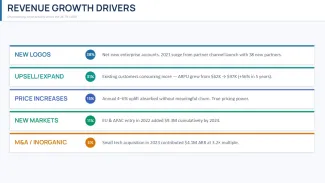
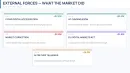
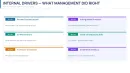
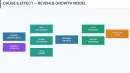
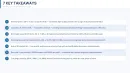
The layouts lean heavily on horizontal flows and grid-based tables. A lot of slides use left-to-right progression - growth drivers, timelines, cause-effect chains. Spacing is fairly tight in places, especially on data-heavy slides, but it's controlled. You can fit a lot without things colliding. Icons are minimal and mostly flat, used as small markers rather than focal points.
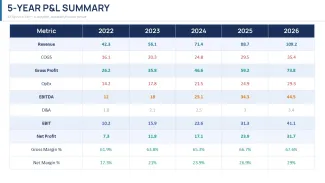
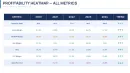
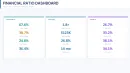
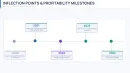
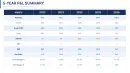
What stands out is the consistency. The horizontal flow layouts are genuinely well-structured - each step connects without crowding the slide. And the financial tables are already formatted in a way that doesn't require rebuilding. If you've ever tried to align a multi-year P&L manually, you know why that matters.
You're working in .pptx here, so PowerPoint 2016+ handles it fine. No weird dependencies. You open it, swap numbers, adjust labels, done. Works as-is. And yes, you drop in your data. That's it.
There's a free version (limited slides) and a paid version - price not clearly listed here, but typically around the mid-range for these templates. The difference is basically access to the full deck and all diagram variations. If you're only testing layouts, free is enough. If you're actually presenting to someone important, you'll want the full set.
Honestly, I just opened it, changed a few numbers, and it already looked usable. Took maybe ten minutes. The color switching is slightly confusing the first time, but once you find the slide master it takes under a minute. I always change the colors in the master first before filling in any data.
This works best for financial analysts, startup founders, or anyone preparing investor updates. You know that situation when the deck is due tomorrow - this is exactly when you grab something like this. It's not ideal if you need highly custom charts or very specific branding rules, but for structured financial storytelling, it holds up.
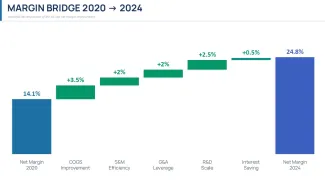
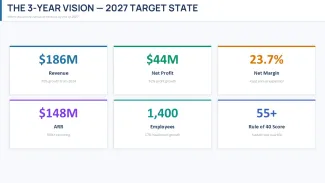
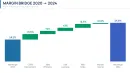
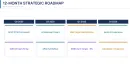
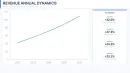
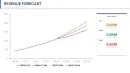
The color system is one of the better-built parts - one change in the master and the whole deck updates. That alone saves real time. And the layouts for forecasts and scenario planning are actually useful, not filler slides. I liked how the margin bridge slide is already balanced visually - no need to tweak spacing.
And earlier I mentioned the density - it's worth repeating. You can add more data than you think, and it still holds together. Slightly tight, but workable in practice.
Also works for internal team updates, not just investor decks.
Specifications
| Feature | Details |
|---|---|
| Slides/diagrams | 40+ slides including CAGR charts, waterfalls, forecasts |
| File format | .pptx editable in PowerPoint |
| Software version | PowerPoint 2016 and newer |
| Color schemes | Multiple themes via slide master adjustments |
| Editable elements | Charts, text blocks, icons, and tables resize independently |
| Aspect ratio | 16:9 widescreen |
| Free vs Paid | Free includes limited slides; paid unlocks full deck and layouts |
| Masters/Backgrounds | Prebuilt slide master with global color and font control |
FAQ
How do I change the colors in this template?
Go to the View tab and open Slide Master. From there, you'll see the main theme colors - change those and it updates across all slides automatically. It might feel slightly confusing the first time, but once you locate the master layout it's quick. In practice, takes under a minute.
Can I use this template for client presentations?
It's the same license most marketplaces use - one buyer, one project, commercial use is fine. You can present it to clients or stakeholders without issues. Just don't resell the template itself. That's basically it.
What's the difference between free and paid versions?
The free version gives you a small subset of slides so you can test the layout and structure. The paid version unlocks the full set - all diagrams, all variations, everything. If you're building a full financial deck, you'll need the paid one. Otherwise, the free version is fine for previewing.
Are refunds available if it doesn't work for me?
Refunds usually depend on the marketplace policy. In most cases, digital downloads aren't refundable once accessed, but exceptions exist if there's a technical issue. So basically, check the specific terms before buying. That's the safest way.
Can I reuse this template for multiple projects or team members?
Depends a bit on the license type. Usually it's one license per user or per project, so if multiple team members need access, you might need extra licenses. Works fine for internal use if one person is editing and sharing exports. Oh, and you can also export to PDF from there.
Download and start editing immediately