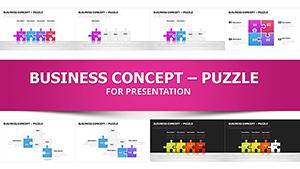
Editable Puzzles PowerPoint Charts Template for Engaging Slides


Type: PowerPoint Charts template
Category: Puzzles
Sources Available: .pptx
Product ID: PC00664
Template incl.: 24 editable slides
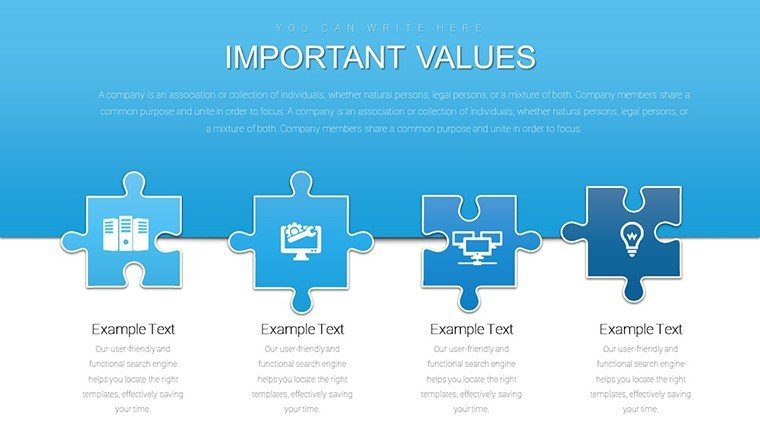
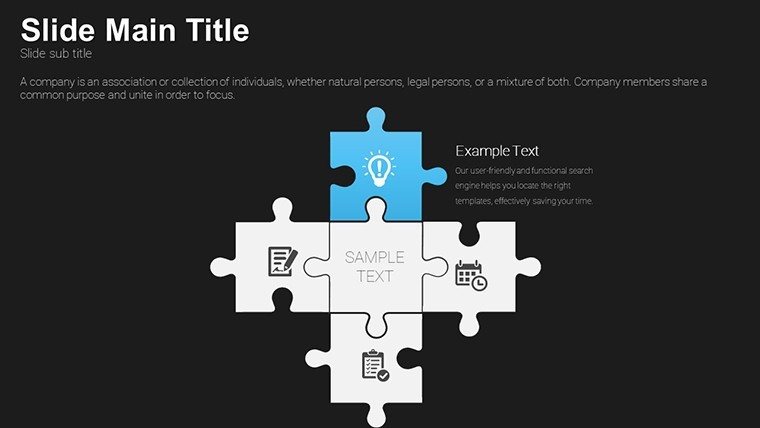
Picture this: Your audience leaning forward, piecing together your narrative as if solving an intriguing puzzle. That's the magic of our Editable Puzzles PowerPoint Charts Template, boasting 24 versatile slides that turn complex information into interactive visuals. Ideal for consultants decoding market strategies or educators unraveling scientific theories, this template empowers you to customize every piece - adjusting sizes, colors, and arrangements to fit your unique message. Forget dull bullet points; embrace puzzle infographics that reveal insights layer by layer, fostering deeper understanding and retention. Compatible with PowerPoint and Google Slides, it's a breeze to integrate into your workflow, saving precious time while amplifying your presentation's wow factor. Whether pitching a new campaign or training a team, these puzzles make your content stick, drawing from proven design tactics used in award-winning infographics.
Unleash Creativity with Editable Puzzles PowerPoint Chart Template
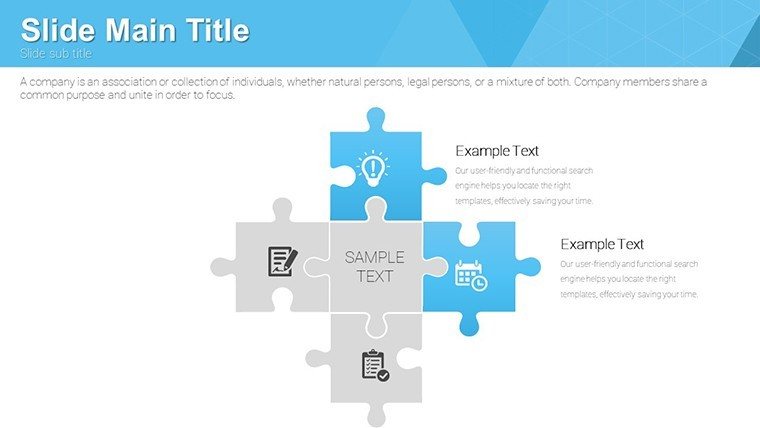
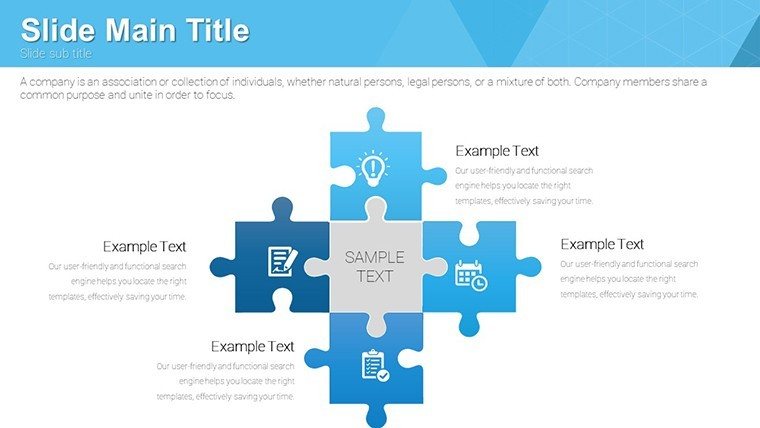
Customizable Puzzle Infographics for Impactful Presentations
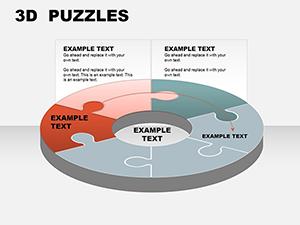
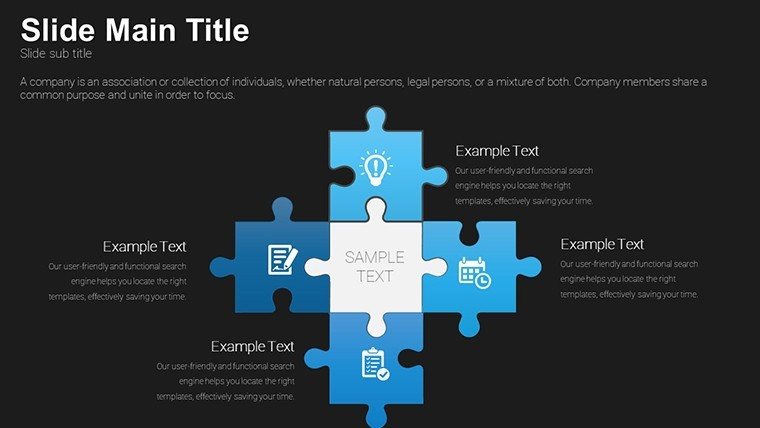
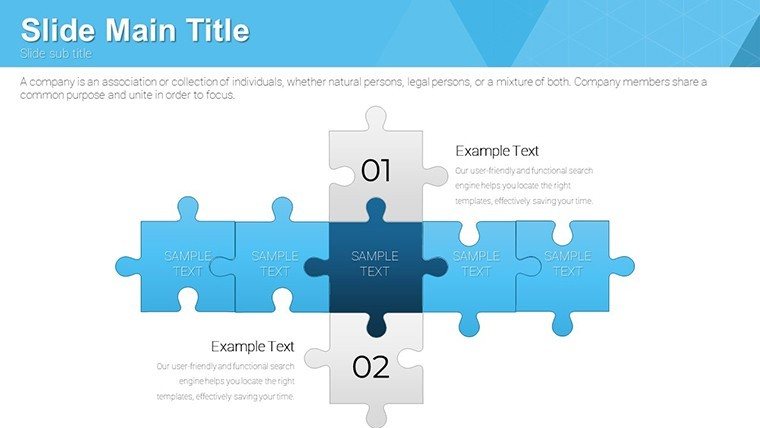
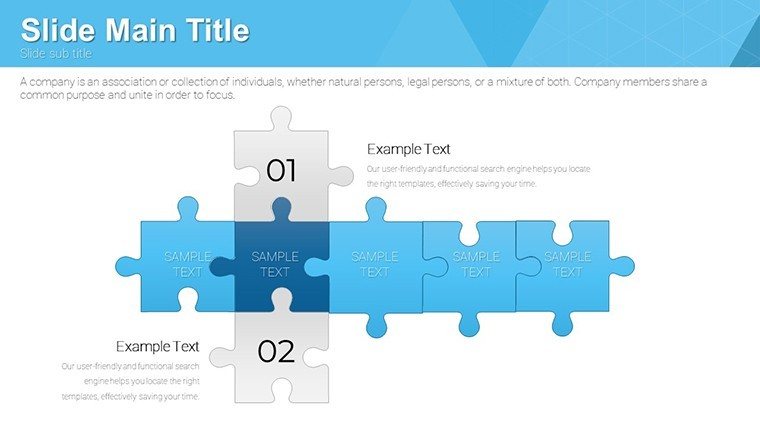
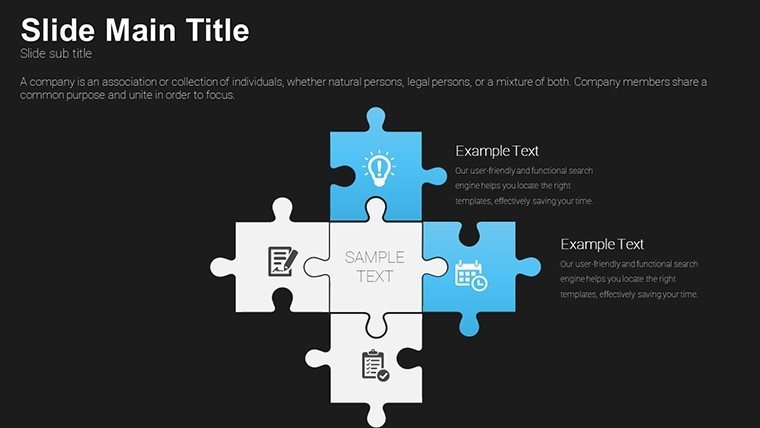
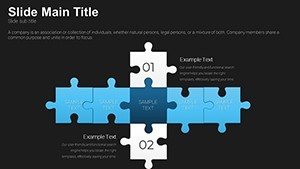
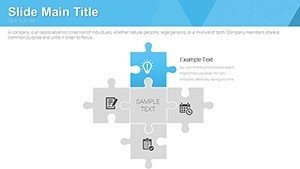
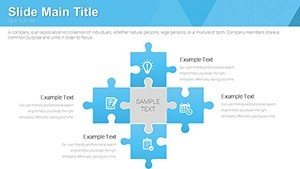
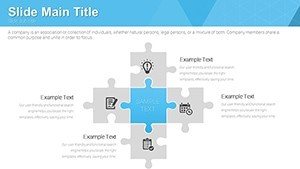
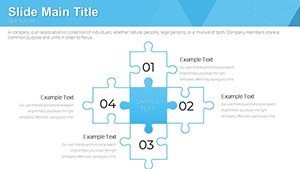
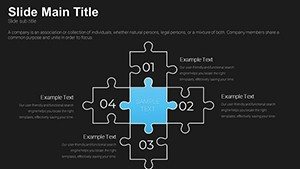
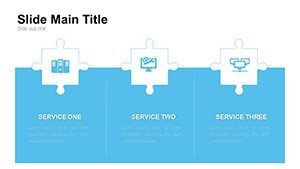
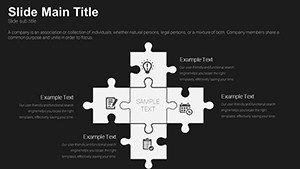
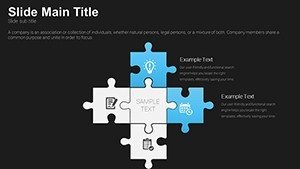
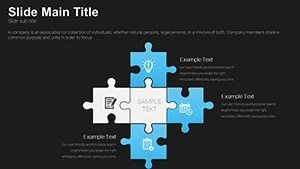
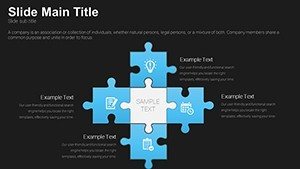
At the core are the puzzle infographics, each slide a canvas for your data. For example, Slide 3 could host a four-piece puzzle for quarterly goals, with each segment exploding into details on click. In a marketing context, use Slide 8 to puzzle out customer personas, linking demographics to behaviors visually.
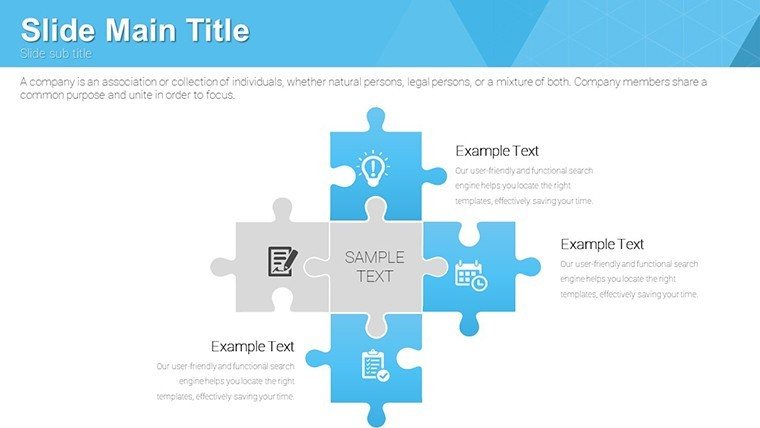
Seamless Customization for Unique Expression
Tailor with ease: Drag and drop pieces, recolor to match corporate palettes, or resize for emphasis. This flexibility outshines standard templates, akin to how graphic designers use vector tools in Illustrator for scalable creations, ensuring your puzzles adapt without quality loss.
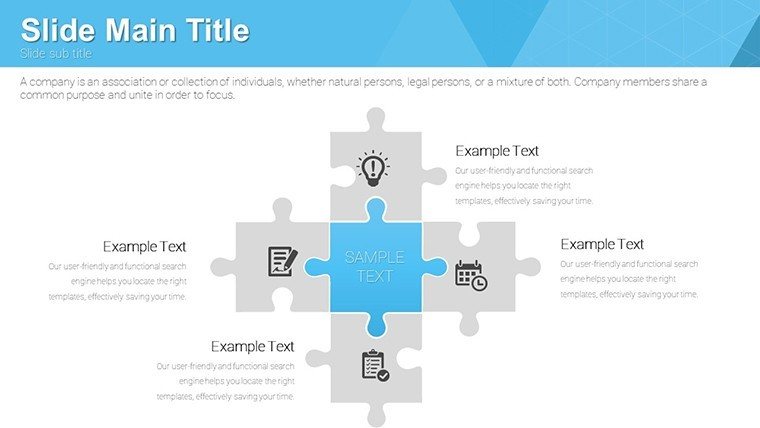
Dynamic Engagement, Maximum Impact
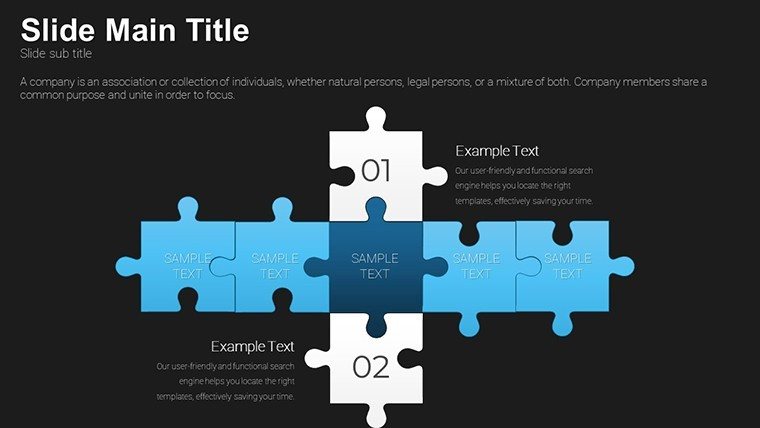
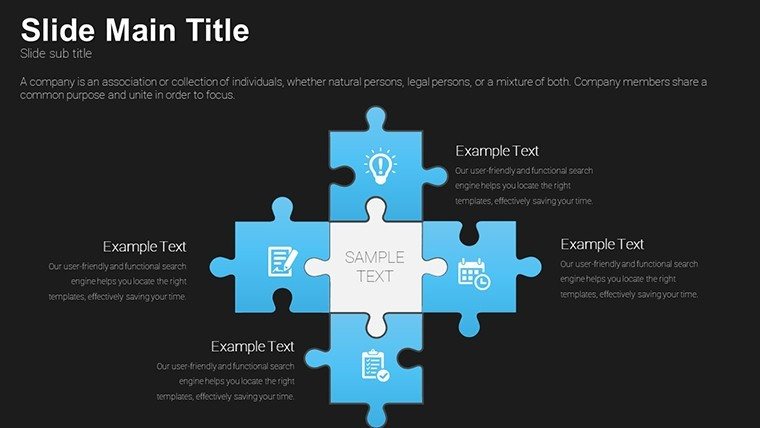
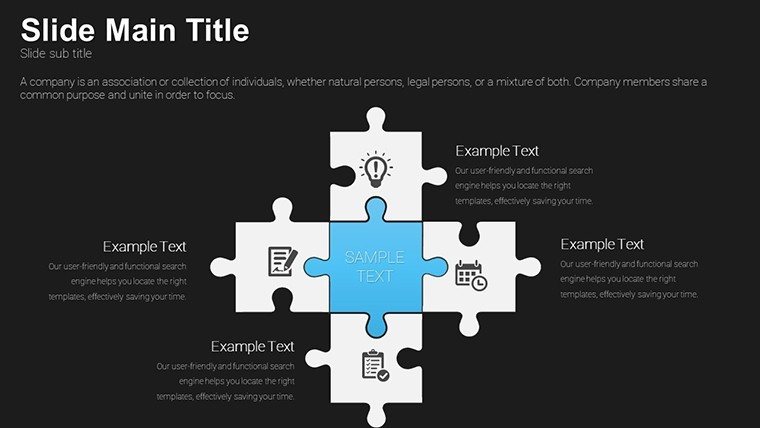
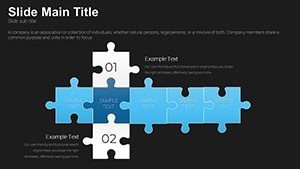
Progressive reveals keep audiences hooked - start with a scattered puzzle and animate assembly. Real case: A consulting firm reported 25% better client feedback using similar interactive elements in strategy sessions.
Why Choose Our Editable Puzzles PowerPoint Chart Template?
It's not just editable; it's intuitive. Pre-loaded with modern designs, it bypasses the tedium of building from zero, much like modular furniture speeds up interior setups. Benefits include time savings, professional polish, and enhanced audience interaction.
Who Can Benefit from This Template?
From boardrooms to virtual classrooms, the applications are vast.
- Professionals: Craft standout reports that puzzle through financial forecasts.
- Educators: Make lessons puzzle-like adventures in knowledge building.
- Designers: Prototype concepts with puzzle frameworks for client approvals.
- Consultants: Dissect problems into solvable puzzle pieces for clear solutions.
Step-by-step use: Open in PowerPoint, select a puzzle slide, input text/data, customize visuals, and rehearse animations. Compare to basic charts: Puzzles add narrative depth, turning data dumps into stories.
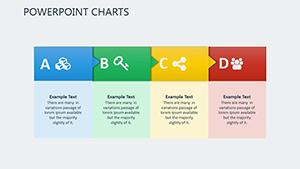
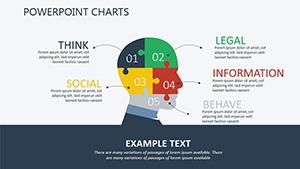
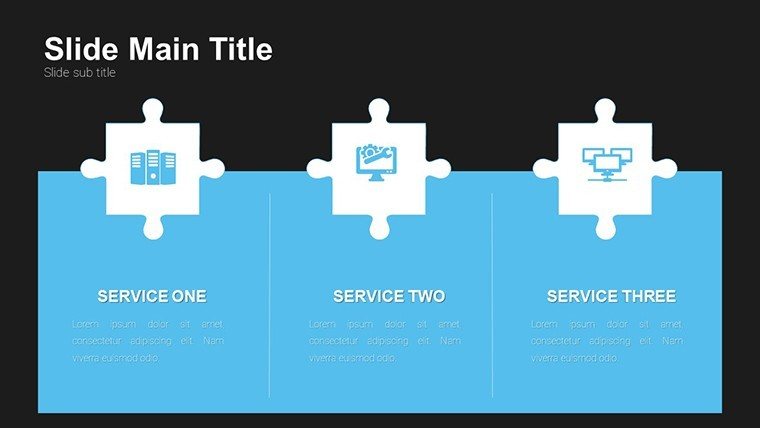
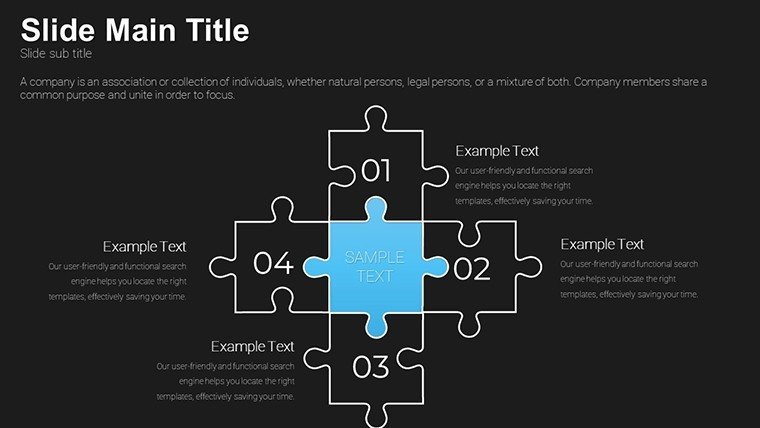
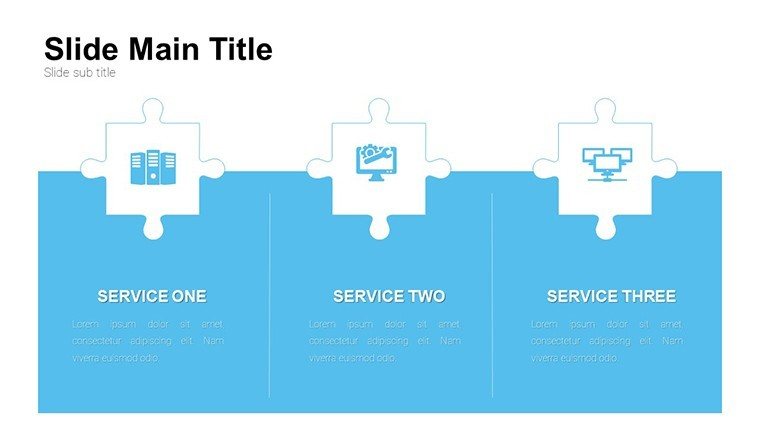
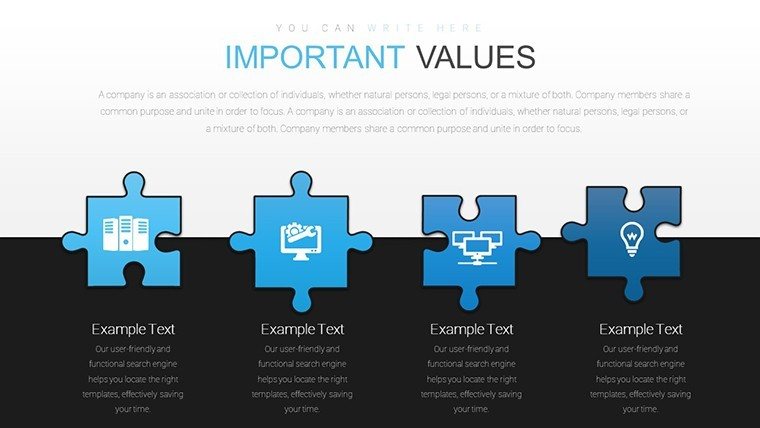
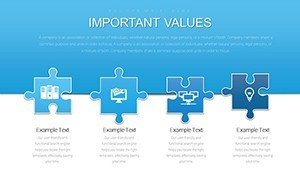
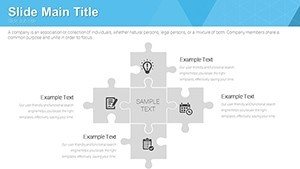
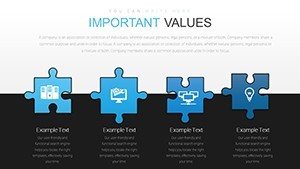
Value props shine in themed icons included - think gear puzzles for process flows or lightbulb ones for ideas. Workflow integration: Link to data sources for auto-updates, ideal for ongoing reports.
Tips: Balance puzzle complexity - too many pieces overwhelm; use for key takeaways. In creative pitches, infuse humor with quirky puzzle shapes, like a jigsaw for 'fitting' team roles.
Multiple CTAs: Ready to puzzle your presentations? Download and start customizing. Or, explore how this template elevates your next webinar - grab it today.
Wrap up with a bang: Let your ideas interlock seamlessly - secure this editable puzzle template and captivate like never before.
Frequently Asked Questions
How do I customize the puzzle pieces?
Select individual elements and edit via PowerPoint tools for color, size, and content changes.
Does it support animations?
Yes, built-in options for revealing puzzles piece by piece enhance engagement.
Suitable for large audiences?
Absolutely, high-res designs scale well for projectors or online shares.
Can I add my own images?
Easily insert photos into puzzle frames for personalized touches.
What's the file format?
.pptx, compatible with recent PowerPoint versions and Google Slides.