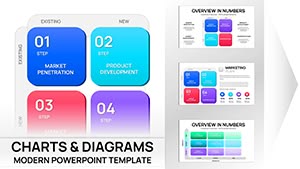
Navigate the Ansoff Matrix with finesse using our Ansoff Model Keynote charts. Geared toward planners and executives, these visuals distill the classic framework into dynamic, Apple-polished graphics that clarify paths to penetration, development, and diversification.
Each chart captures the model`s quadrants with intuitive icons and scalable data inputs, making it easy to spotlight high-potential moves. Ideal for workshops or reports, they transform theoretical models into tangible tactics.
For growth-oriented minds, this selection illuminates decision points. Select a chart and chart your course through strategic expansion.
Investment Management Keynote Charts Template: Master Financial Narratives with Precision
ID: #KC00586
$20.00
(853)
Taxes and Accounting Keynote Charts Template
ID: #KC00570
$19.00
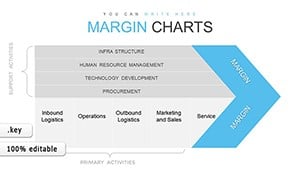
Visualizing the Ansoff Framework in Keynote
The Ansoff Model thrives in visualization, and our Ansoff Model Keynote charts excel by animating quadrant transitions - revealing risks and rewards in sequence. Tailored for strategic reviews, they include risk gauges and opportunity scorers for nuanced analysis.
CEOs use them for horizon scanning, teams for brainstorming sessions. Precision editing ensures alignment with your metrics.
Targeted Applications
Publishing: Quadrant plots for genre diversification.
Telecom: Penetration charts for service upgrades.
Agri-Tech: Development maps for crop innovations.
A winery`s portfolio growth: the chart`s matrix pulses with sales data, highlighting diversification sweet spots - a strategic spotlight.
Ansoff Charts Beyond Basics
Basic matrices are static; ours feature interactive hovers and build paths, deepening engagement. Crisp vectors maintain quality across exports.
Guiding Principles
Populate with weighted scores for objectivity. Tip: Animate from safe to bold strategies to build narrative tension.
Features like quadrant zoom-ins aid detailed dives.
Practical Examples and Innovations
For retail chains: overlay customer data on development axes, using fades for phased reveals. Innovate with embedded calculators for real-time scoring.
In startups, adapt for pitch decks: color-code viability for investor appeal. Tip: Pair with icons evoking each strategy`s essence.
Dynamic Integrations
Link to external models for hybrid views, enhancing adaptability.
CTA: Strategize smarter - download Ansoff charts for Keynote clarity.
Frequently Asked Questions
Empowering queries resolved. Browse for your ideal fit.