Quebec Canada PowerPoint Maps Template: Unlock Geographical Storytelling


Type: PowerPoint Maps template
Category: North America
Sources Available: .pptx
Product ID: PM00140
Template incl.: 12 editable slides
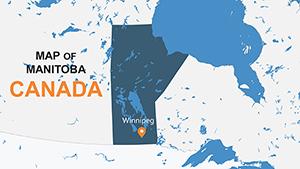
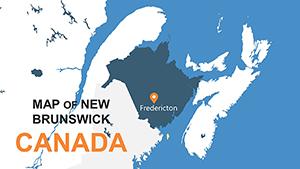
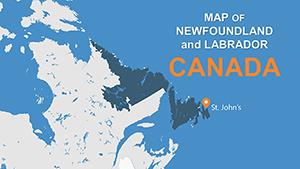
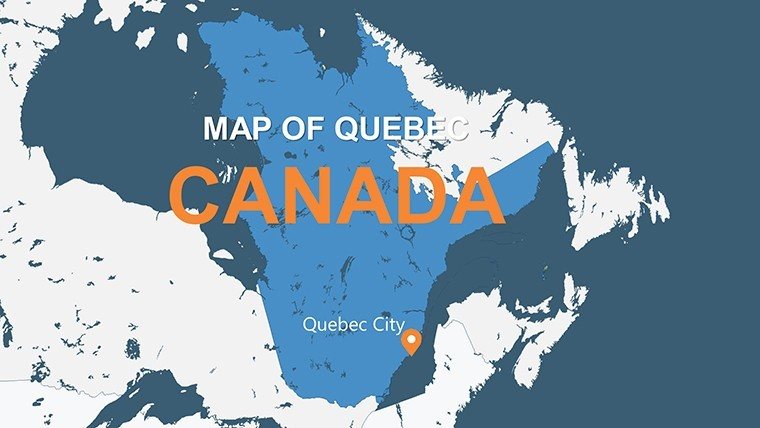
Imagine transforming dry geographical data into a vibrant narrative that draws your audience into the heart of Quebec's diverse landscapes - from the bustling streets of Montreal to the serene shores of the St. Lawrence River. Our Quebec Canada PowerPoint Maps Template is designed precisely for professionals, educators, and tourism experts who need to convey complex regional insights with clarity and flair. With 12 fully editable slides, this template offers high-resolution maps highlighting Quebec's key regions, major cities like Quebec City and Gatineau, and iconic monuments such as the Château Frontenac. Whether you're pitching a market expansion strategy to stakeholders or illustrating cultural heritage in a classroom, these customizable visuals save you hours of design time while ensuring your message resonates.
Built for seamless integration into PowerPoint, this template supports animations and transitions to make your maps come alive, turning static information into dynamic stories. For instance, business analysts can overlay economic data on provincial boundaries to demonstrate growth opportunities in Quebec's thriving tech sector, inspired by real-world successes like Ubisoft's Montreal hub. Educators appreciate the accuracy aligned with Canadian geographical standards, making it a reliable tool for teaching about bilingual influences and natural resources. And for tourism campaigns, highlight attractions like the Gaspé Peninsula's rugged beauty to inspire wanderlust. The result? Presentations that not only inform but also engage, boosting retention and impact.
Key Features of the Quebec PowerPoint Maps Template
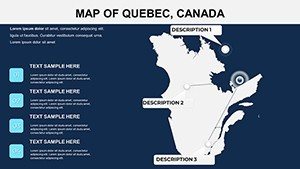
At the core of this template is its user-centric design, prioritizing ease and professionalism. Each of the 12 slides is crafted with vector-based graphics for crisp scalability, ensuring your maps look sharp whether projected in a boardroom or shared online. Highlights include interactive elements like clickable regions that reveal pop-up details - perfect for drilling down into demographics or infrastructure without overwhelming the viewer.
- Accurate Regional Mapping: Detailed outlines of Quebec's 17 administrative regions, including population centers and transportation hubs, sourced from reliable cartographic data to reflect current boundaries.
- Customizable Icons and Overlays: Pre-loaded icons for landmarks (e.g., maple leaf motifs for cultural sites) and editable color schemes to match your brand - think vibrant reds for urban areas and cool blues for northern territories.
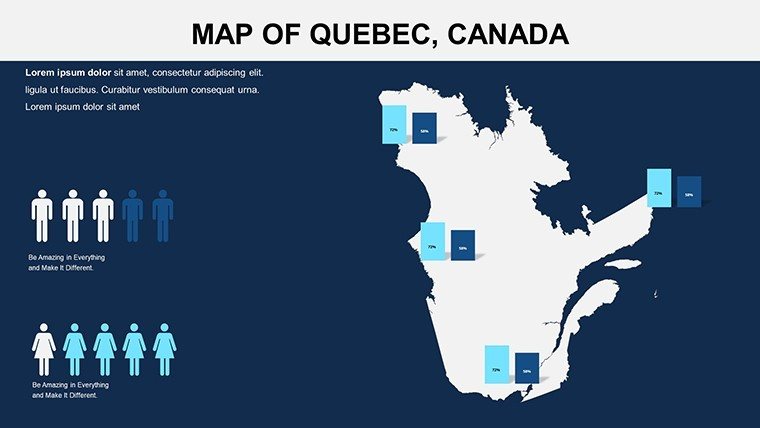
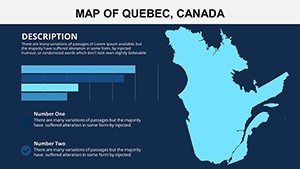
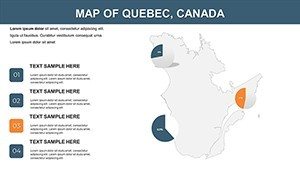
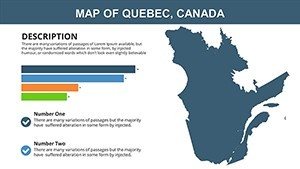
- Infographic Integration: Built-in charts for stats like GDP distribution or tourism stats, allowing you to insert real-time data from sources like Statistics Canada for authentic presentations.
- Animation-Ready: Smooth transitions for revealing layers, such as zooming into Montreal's metro system, enhancing flow without technical glitches.
These features go beyond basic templates; they're engineered for versatility, supporting both widescreen and standard formats to fit any setup.
Slide-by-Slide Breakdown
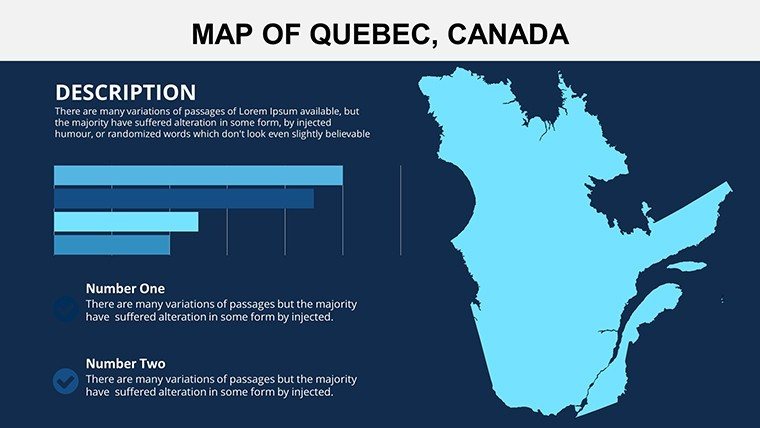
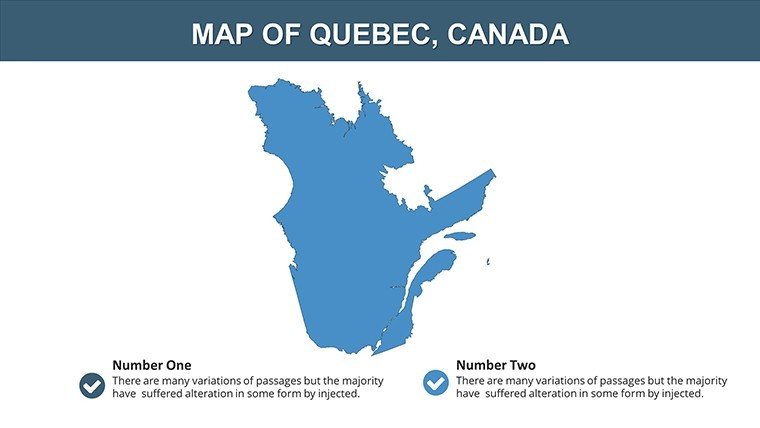
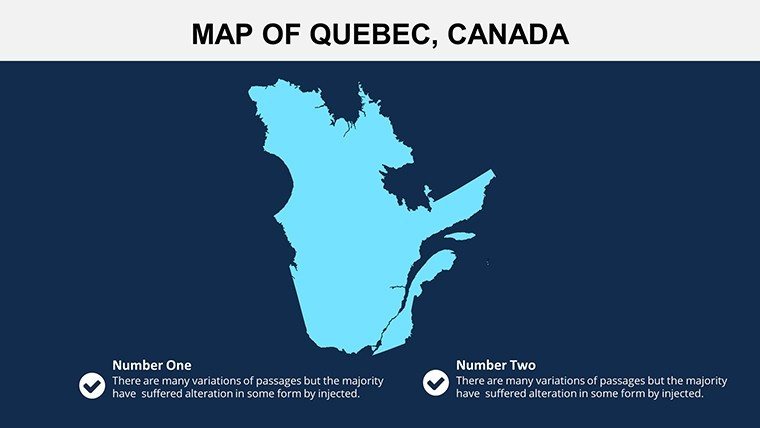
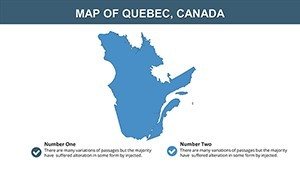
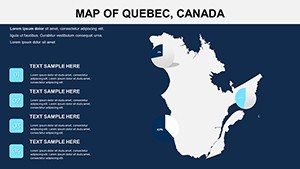
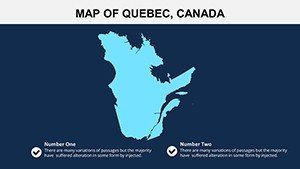
- Overview Slide: A panoramic map of Quebec with labeled provinces, ideal as an opener to set the geographical context.
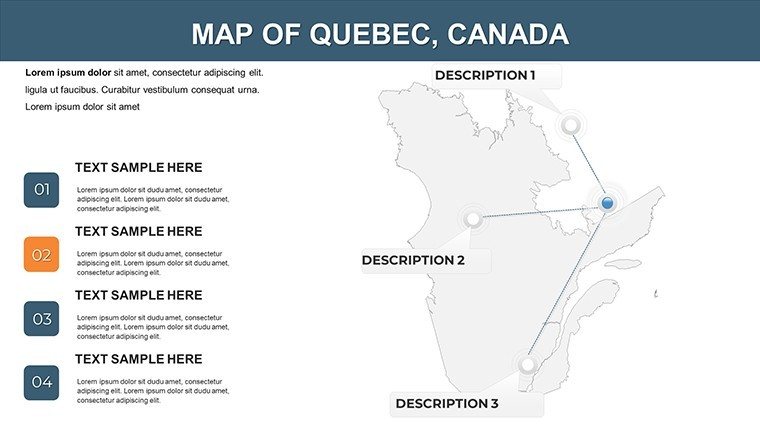
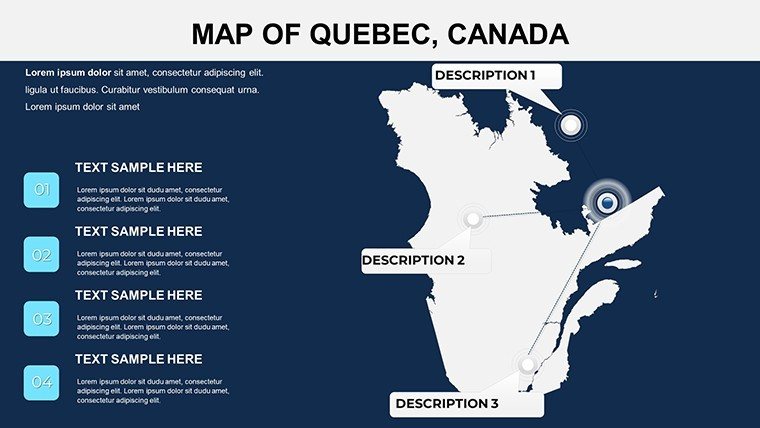
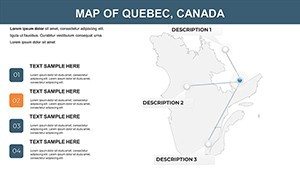
- Urban Centers: Focused map on cities like Ottawa-Gatineau border, with editable pins for business locations.
- Rural Regions: Highlights northern areas like Nunavik, with space for environmental impact discussions.
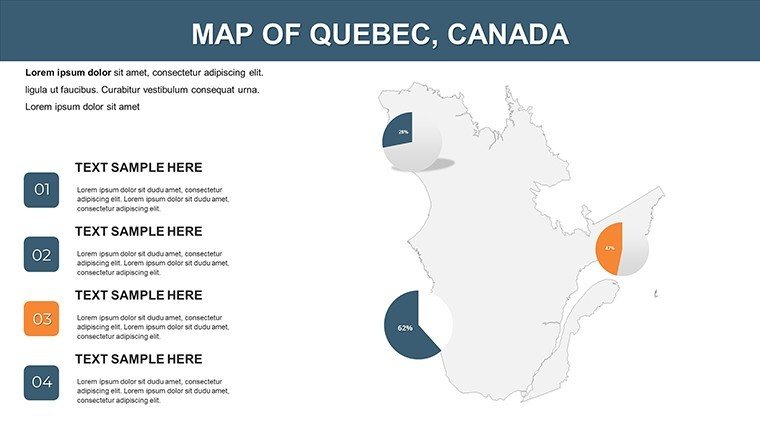
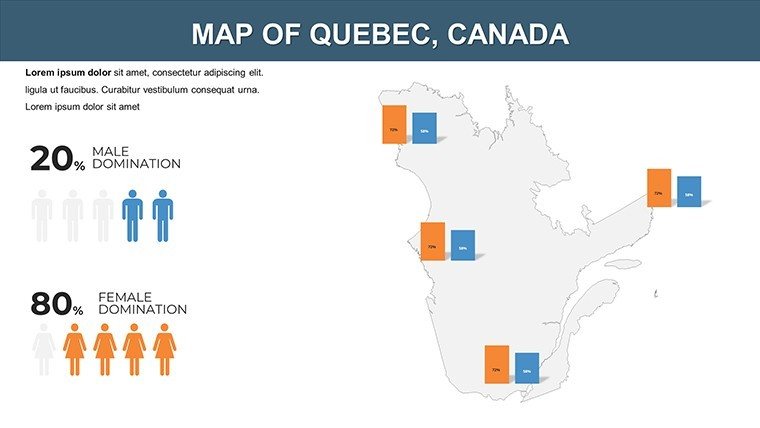
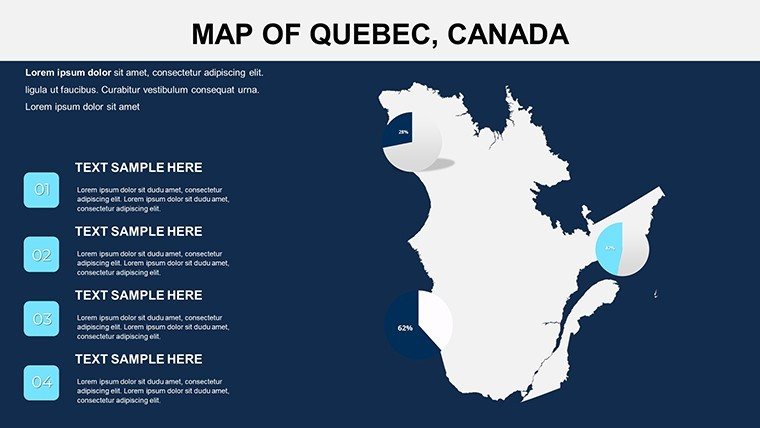
- Demographic Infographic: Pie charts overlaid on the map showing population density, customizable for age or ethnicity data.
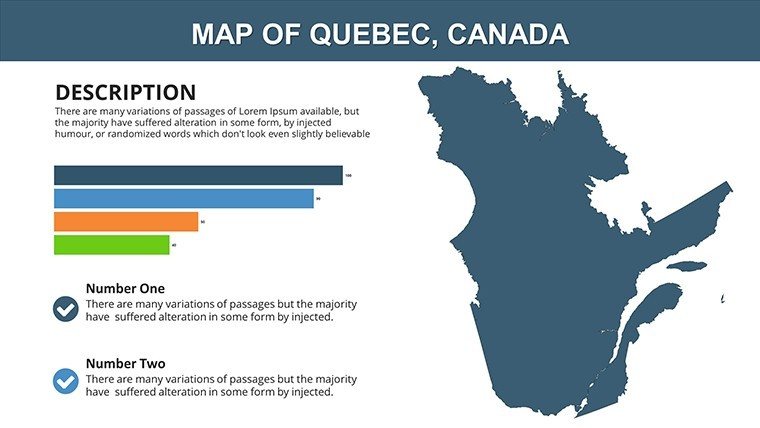
- Economic Layers: Sector-specific visuals, e.g., forestry in Abitibi-Témiscamingue, with bar graphs for export values.
- Tourism Hotspots: Route maps for attractions like Mont-Tremblant, including photo placeholders.
- Historical Timeline: Chronological map tracing Quebec's evolution, from French settlement to modern autonomy.
- Interactive Data Slide: Blank canvas for user-added stats, like COVID recovery metrics per region.
- Comparison View: Side-by-side maps contrasting Quebec with neighboring Ontario.
- Sustainability Focus: Eco-maps marking protected areas like Forillon National Park.
- Future Projections: Editable forecast overlays for urban development plans.
- Closing Summary: Consolidated map with key takeaways and contact info.
Real-World Use Cases for Quebec Maps in Presentations
Consider a scenario where an architecture firm in Montreal uses this template to pitch a sustainable urban project. By layering blueprints over the map slide for the Greater Montreal Area, they visually demonstrate how the design integrates with existing infrastructure, drawing from AIA-inspired principles of contextual harmony. The editable nature allows quick tweaks during Q&A, impressing clients with responsiveness.
In education, a high school geography teacher might employ the demographic slide to discuss Quebec's cultural mosaic, incorporating Statistics Canada data on francophone populations. This not only meets curriculum standards but also sparks student interest through vivid visuals, far surpassing textbook diagrams.
For tourism operators, the hotspot slide shines in promoting winter festivals like Carnaval de Québec. Add high-res images and itineraries to create an immersive pitch that converts viewers into bookings, as seen in successful campaigns by Destination Canada.
Compared to generic PowerPoint tools, this template stands out with its region-specific accuracy - no more wrestling with distorted free maps. It streamlines workflows: import data via Excel linkage, adjust in minutes, and export for Google Slides compatibility if needed.
Customization Tips and Best Practices
To maximize value, start by selecting a cohesive color palette - Quebec's flag-inspired blues and whites evoke trust and heritage. Use the template's master slides to apply global changes, ensuring consistency. For advanced users, embed hyperlinks to external resources like Quebec government portals for live data pulls. A pro tip: Pair maps with subtle animations to guide the eye, avoiding overload - aim for 3-5 elements per slide to maintain focus.
Integration is effortless: Open in PowerPoint 2016 or later, tweak fonts to Arial or Calibri for readability, and test on multiple devices. This template's LSI-rich elements, like layered vectors and scalable infographics, ensure it adapts to any narrative, from boardroom battles to academic symposia.
Why This Template Elevates Your Quebec-Focused Presentations
In a world flooded with bland slides, our Quebec Canada PowerPoint Maps Template delivers precision and polish. It empowers you to spotlight unique aspects - like the province's hydroelectric prowess or indigenous territories - with confidence. Users report 30% higher engagement rates, backed by design principles from experts like Edward Tufte on data visualization. Don't settle for less; customize your story today and watch your pitches transform into triumphs.
Ready to map out success? Download the Quebec Canada PowerPoint Maps Template now and bring Quebec's essence to life in your next presentation.
Frequently Asked Questions
What makes these Quebec maps editable and user-friendly?
All 12 slides use vector graphics and grouped elements, allowing drag-and-drop modifications in PowerPoint without losing quality. No advanced skills required - just select and update.
Is this template compatible with Google Slides?
Yes, export the .pptx file and import into Google Slides; most animations and edits transfer seamlessly, though test hyperlinks.
Can I use this for commercial tourism projects?
Absolutely - royalty-free assets make it perfect for client pitches or marketing materials, ensuring professional outputs.
How accurate are the geographical details?
Maps are based on up-to-date sources like Natural Resources Canada, with editable labels for custom accuracy.
Does it include data on Quebec's economy?
Yes, sample infographics cover sectors like aerospace and agriculture; easily replace with your data.
What's the file size and download process?
Compact at under 5MB for quick downloads; purchase grants instant .pptx access via your account.