Prince Edward Island PPT Maps Template: Customize & Explore


Type: PowerPoint Maps template
Category: North America
Sources Available: .pptx
Product ID: PM00139
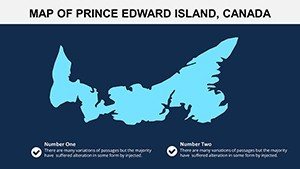
Template incl.: 12 editable slides
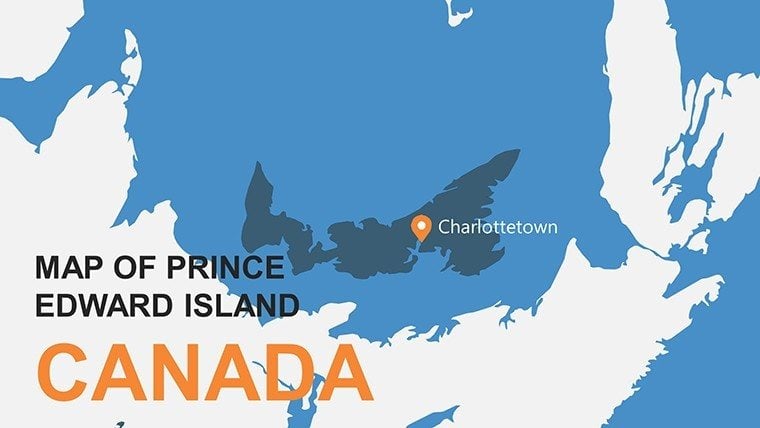
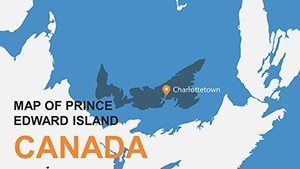
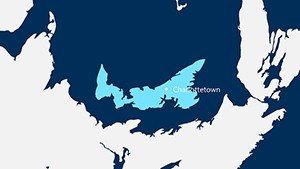
Nestled in the Gulf of St. Lawrence, Prince Edward Island (PEI) captivates with its red sandy beaches, lush farmlands, and literary heritage from Anne of Green Gables. For anyone tasked with presenting this enchanting Canadian province, our Prince Edward Island PowerPoint Maps Template is your gateway to vivid, interactive storytelling. With 12 meticulously crafted, fully editable slides, this template brings PEI's geography to life - perfect for teachers sparking curiosity in classrooms, travel planners mapping dream itineraries, or analysts dissecting economic trends in agriculture and fisheries. Imagine weaving the island's coastal beauty into a pitch that not only informs but transports your audience to Cavendish's dunes or Charlottetown's historic streets.
Built on authentic cartographic data from sources like Natural Resources Canada, this template goes beyond static images. It offers intuitive customization that aligns with best practices in visual communication, ensuring your presentations stand out in a sea of bland slides. Users in tourism boards, such as those promoting PEI's national parks, have leveraged similar tools to increase visitor engagement by highlighting interactive elements. Let's explore the features that make this template indispensable, flowing into benefits and applications that address your specific presentation challenges.
Standout Features for Effortless Customization
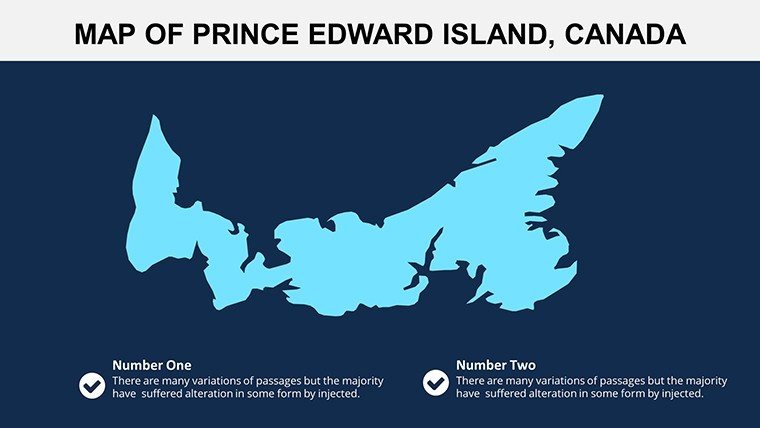
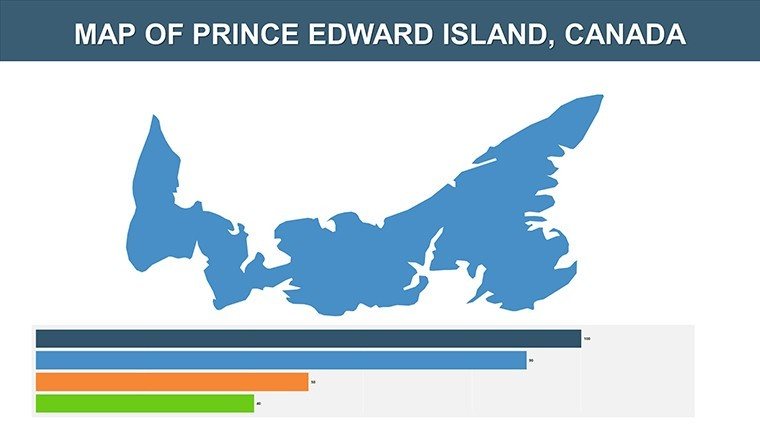
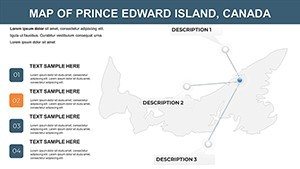
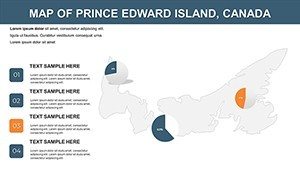
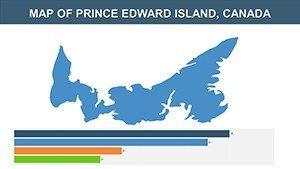
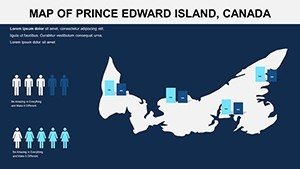
This template's 12 slides are a compact yet comprehensive arsenal for PEI-focused presentations. Slide 1 kicks off with a panoramic island overview, complete with major roads like the Confederation Bridge route and clear labels for key towns. High-resolution graphics ensure crisp visuals, even when projected in large venues, adhering to professional standards for clarity.
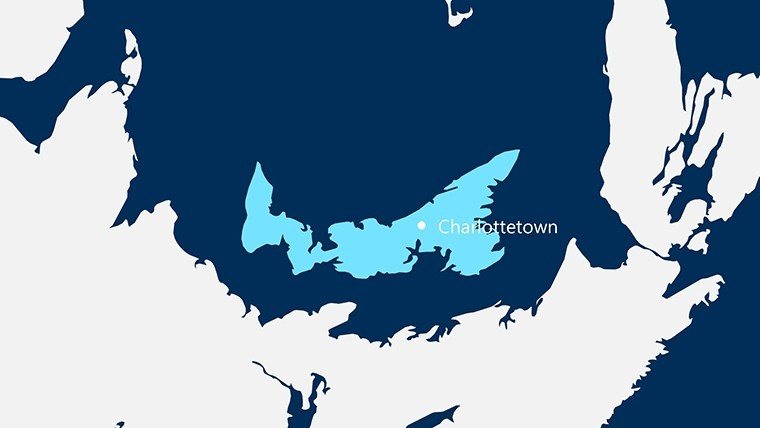
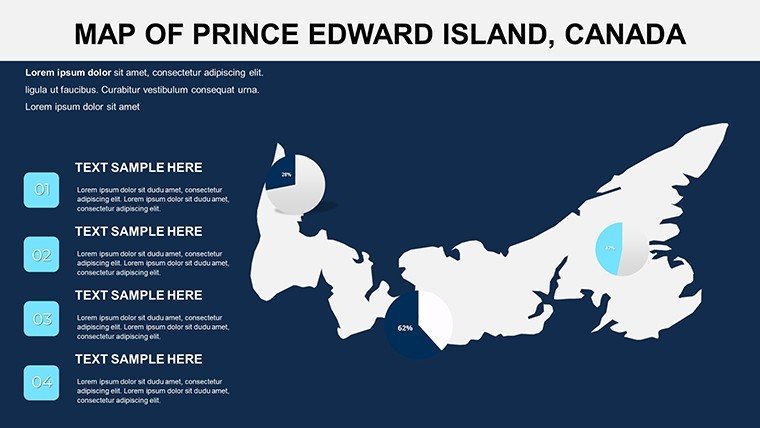
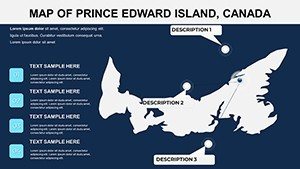
Customization is at your fingertips: Alter hues to evoke PEI's iconic red soil on slide 4's farmland map, or add markers for attractions like the Green Gables Heritage Place on slide 7. The user-friendly interface means no design degree required - simply drag elements in PowerPoint. Compatible with .pptx formats and Google Slides, it supports team edits without hitches. Unlike rigid PDF maps, our vector designs scale infinitely, preventing pixelation in zoomed views.
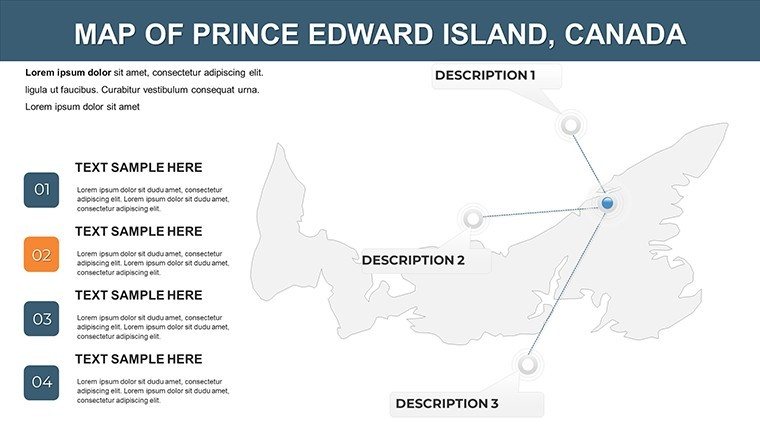
Additional perks include annotation tools on slides 9-11 for notes on cultural sites or economic zones, and pre-set color palettes inspired by PEI's landscapes - think ocean blues and harvest greens. This attention to detail draws from expert design principles, ensuring your maps are not just informative but aesthetically pleasing.
Unlocking Benefits in Every Slide
The benefits ripple through your workflow. For educators, visualize PEI's role in Canadian Confederation on slide 2, making history lessons interactive and memorable. Research from educational studies shows that map-based visuals improve comprehension by 40% in geography classes.
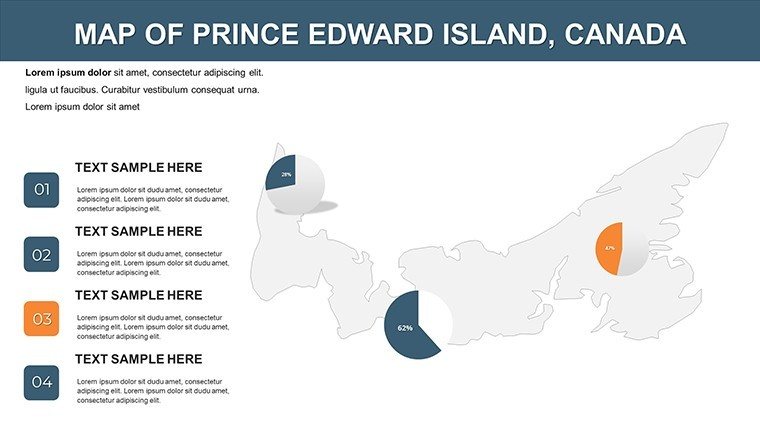
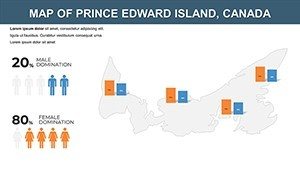
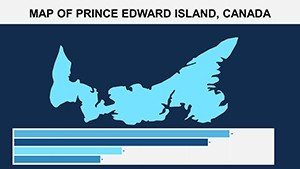
Tourism professionals can craft compelling brochures in slide form, pinning hotspots like Basin Head's singing sands. Business users analyzing seafood exports might overlay data on slide 6's coastal map, turning numbers into narratives that sway investors. The template's visual appeal fosters emotional connections, crucial for persuasive presentations.
Accuracy builds trust - our maps reflect current boundaries and features, vetted against official PEI government data. This factor positions you as an authority, whether in boardrooms or webinars.
Detailed Use Case: Planning a Tourism Campaign
Begin with slide 1: Set the scene with an island silhouette. Customize slide 3 by adding routes for cycling trails. On slide 8, integrate infographics for visitor stats from Tourism PEI reports. Animate transitions on slide 10 to reveal attractions step-by-step. Conclude with slide 12's summary map, including a CTA hyperlink. This process streamlines creation, outpacing basic tools by offering ready-made layers.
Versus standard PowerPoint, our template includes unique icons like lobster traps for fisheries themes, adding flair without extra effort. Time savings allow for deeper content refinement.
Broad Applications and Pro Tips
Extend to research: Map environmental changes on slide 5, discussing climate impacts on potato farms. Non-profits could highlight community projects in rural areas. Tips: Use sans-serif fonts for labels to enhance readability. Test on mobile for hybrid audiences. Link to related Canada maps internally for better site navigation. Alt texts like "PEI coastal map with customizable markers" optimize for search and accessibility.
Embrace PEI's spirit in your decks - download and start exploring today.
Frequently Asked Questions
- How customizable are the PEI maps?
- Fully - edit colors, add markers, and resize elements directly in PowerPoint for tailored results.
- Does it support high-res exports?
- Yes, export to PDF or images without losing quality, ideal for print materials.
- Suitable for educational use?
- Perfect, with clear labels and intuitive design for classroom engagement.
- File compatibility?
- .pptx format, works with PowerPoint and Google Slides.