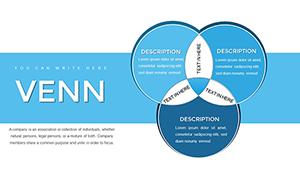
Circle Venn PowerPoint Charts Template: Master Relationships in Visuals


Type: PowerPoint Charts template
Category: Relationship, Venn
Sources Available: .pptx
Product ID: PC00098
Template incl.: 18 editable slides
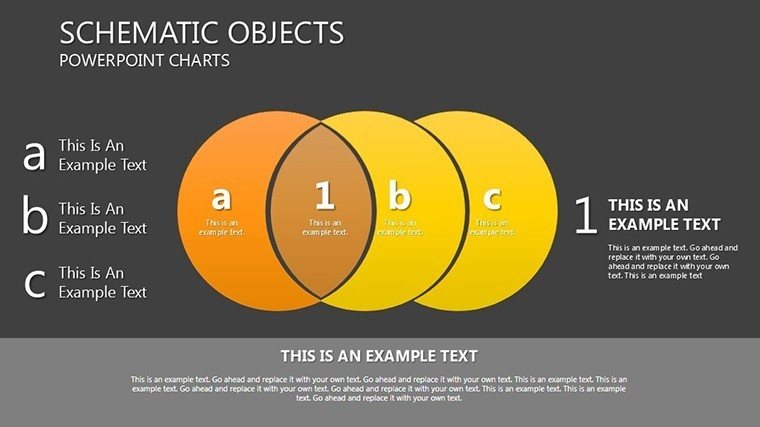
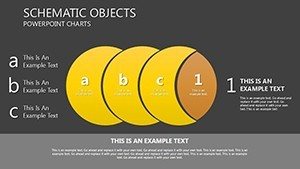
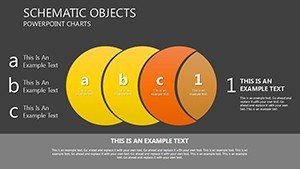
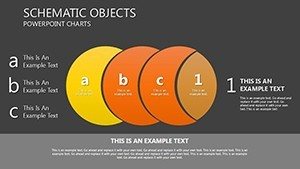
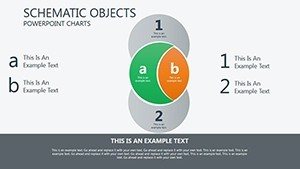
Ever struggled to explain overlapping ideas without losing your audience in a tangle of words? Enter the Circle Venn PowerPoint Charts Template, your gateway to crystal-clear visual storytelling with 18 editable slides. Designed for depicting intersections, comparisons, and shared attributes, this template transforms abstract concepts into tangible diagrams. Ideal for educators simplifying Venn logic in classrooms or business pros highlighting market overlaps in strategies, it features circular elements that symbolize unity and distinction. With seamless PowerPoint integration and options for Google Slides, you can customize radii, colors, and labels to fit your theme. Inspired by real applications, like Venn diagrams in Harvard Business Review articles that clarified competitive landscapes, this tool boosts by grounding your content in proven visualization methods. Say goodbye to bland lists and hello to engaging overlaps that spark discussions – whether in team brainstorms or client briefs. This isn't just a template; it's a catalyst for clearer communication, helping you weave data into stories that stick long after the slides fade.
The Power of Circle Venn Charts Explained
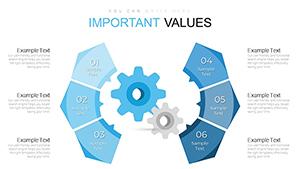
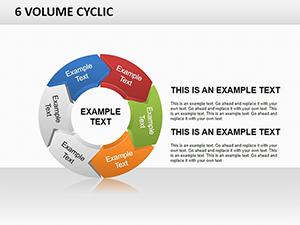
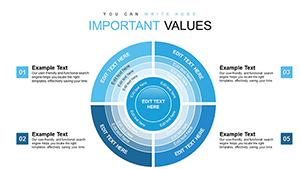
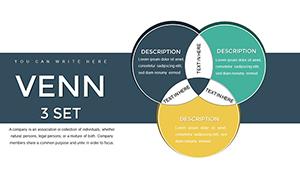
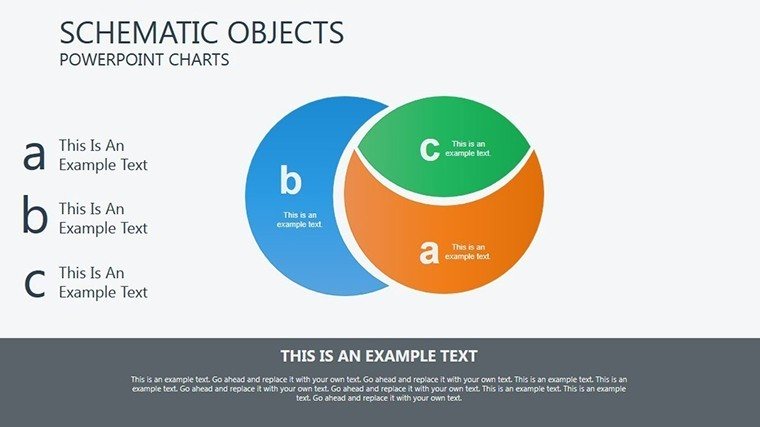
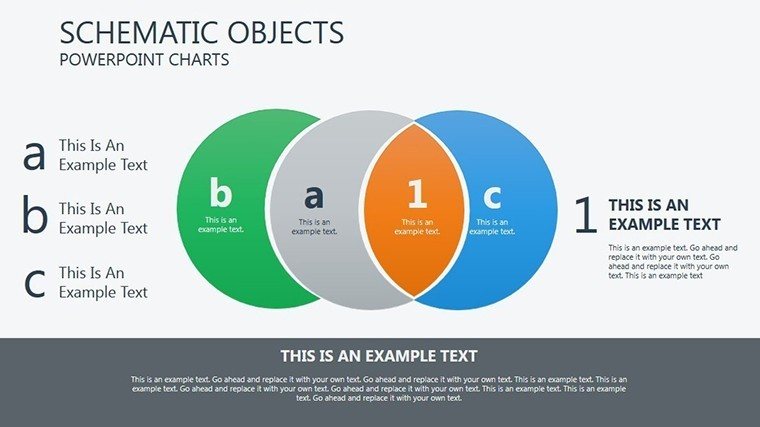
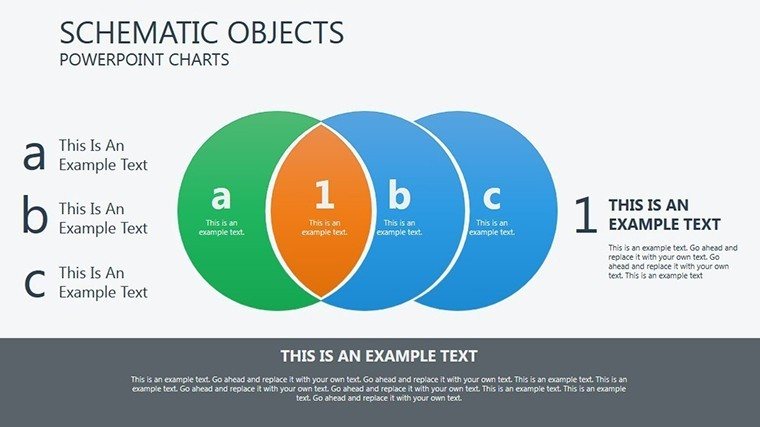
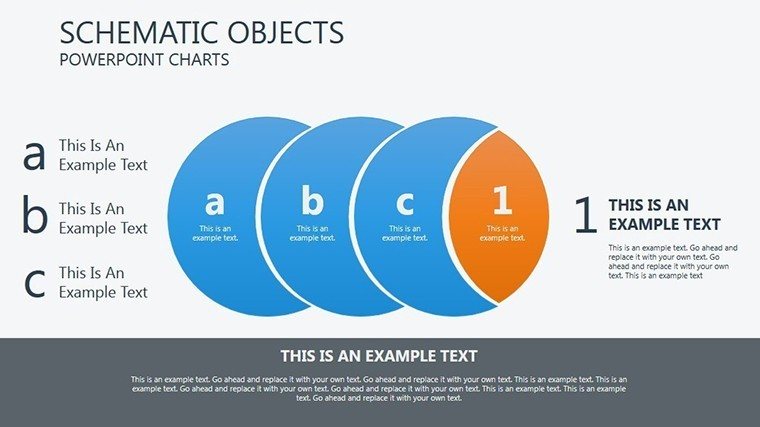
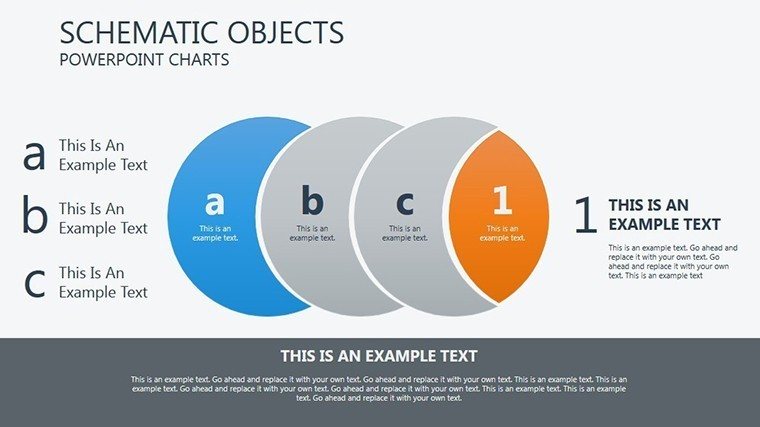
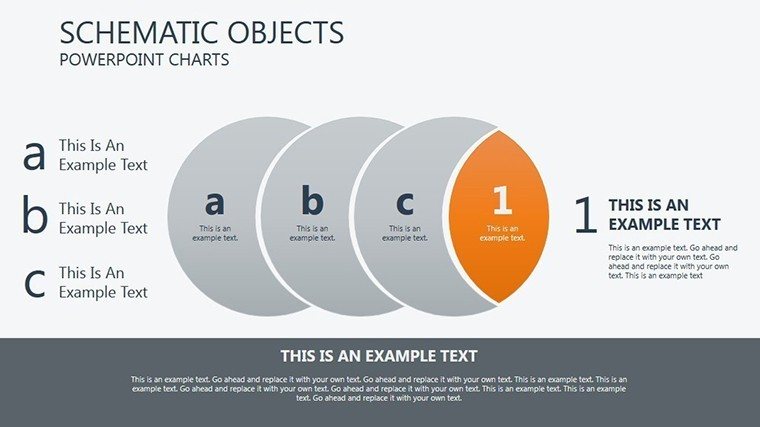
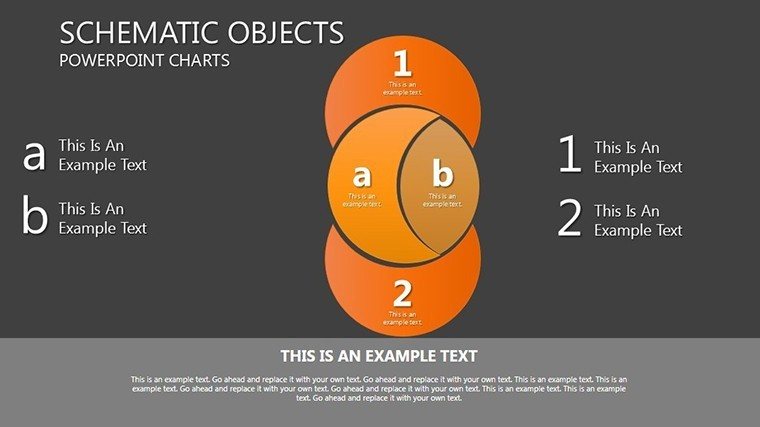
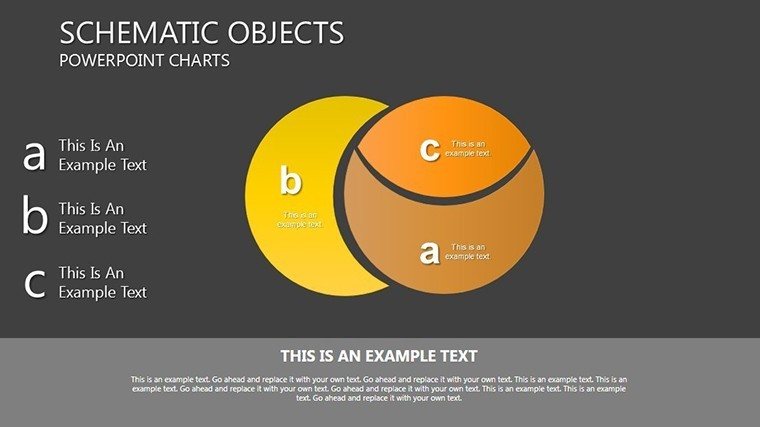
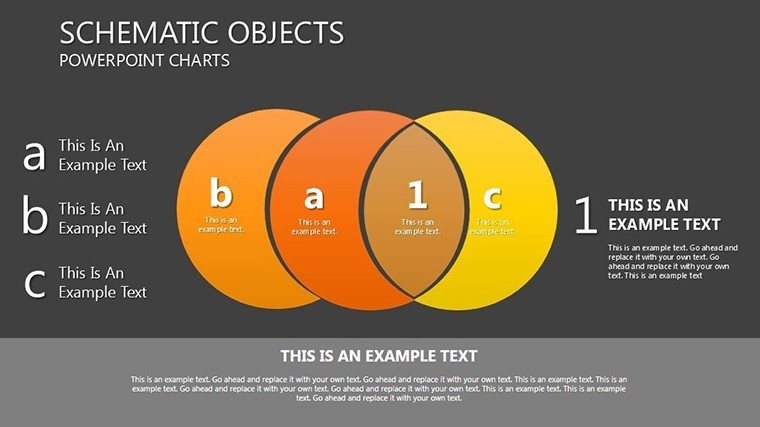
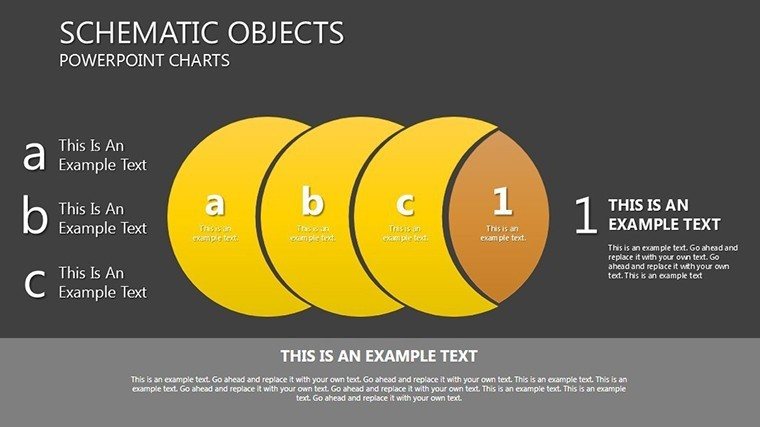
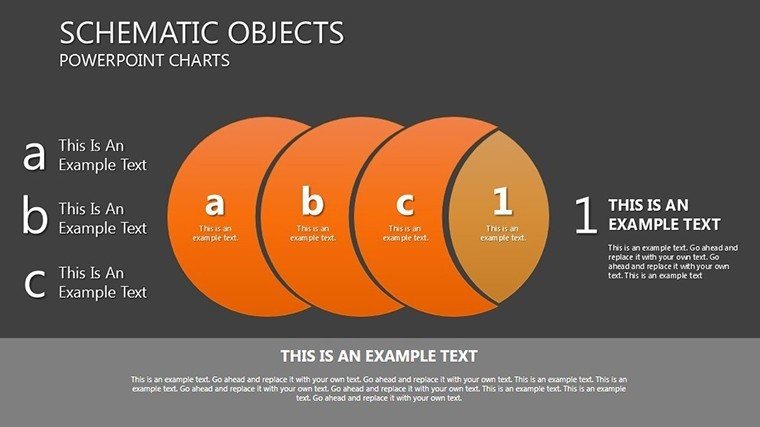
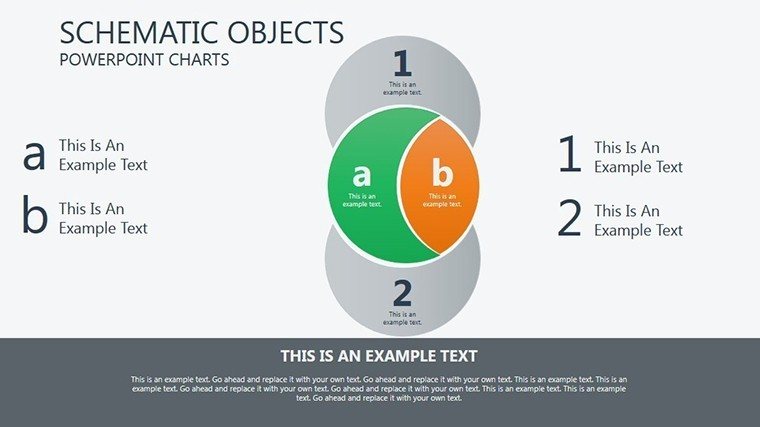
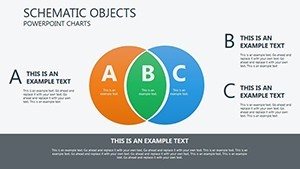
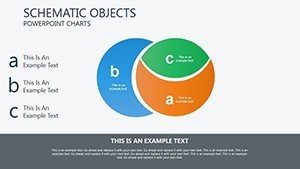
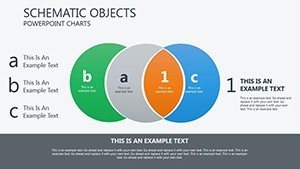
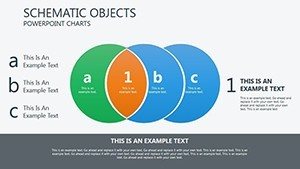
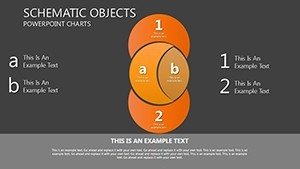
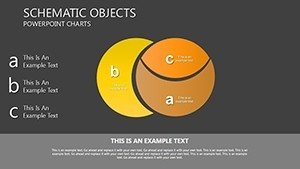
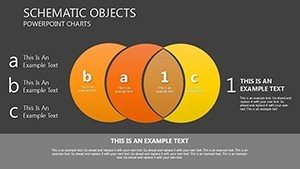
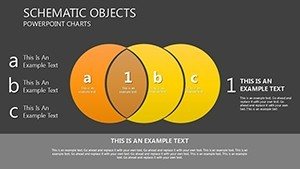
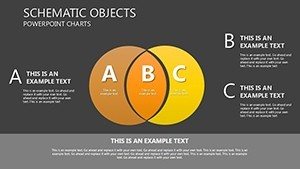
Circle Venn charts excel at showing how elements converge and diverge, rooted in set theory but applied broadly. This template offers variations from two-circle basics for simple comparisons to multi-circle complexities for nuanced analyses. For instance, use a three-circle slide to dissect product features versus competitors, with overlapping areas highlighting unique selling points. The designs incorporate subtle gradients and shadows for depth, elevating them beyond flat sketches. In educational settings, teachers can animate intersections to reveal shared traits in literature characters, aligning with Common Core standards for critical thinking. Businesses benefit from illustrating stakeholder alignments in project plans, as seen in agile methodologies where Venns map team roles. The flow is intuitive: Start with core sets, add data, and watch relationships emerge visually. Compared to PowerPoint's default tools, this provides pre-optimized layouts that save design time while ensuring balance and symmetry – key to avoiding cluttered slides.
Essential Features for Dynamic Presentations
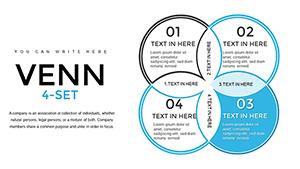
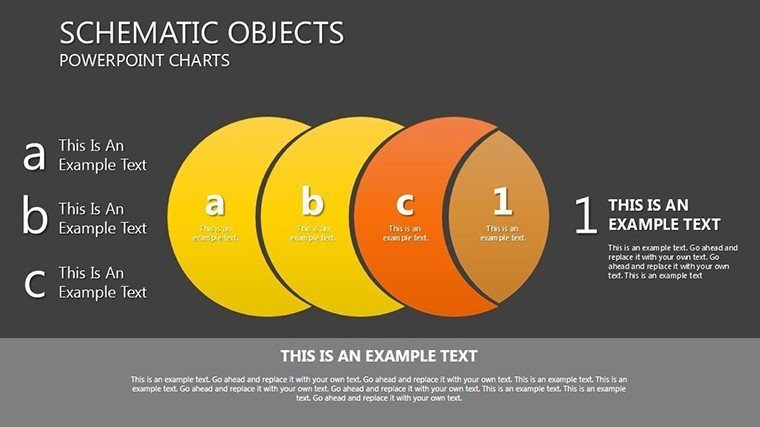
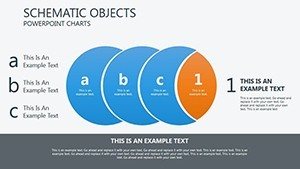
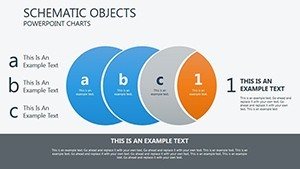
- Multi-Circle Options: From 2 to 5 circles for scaling complexity in data relationships.
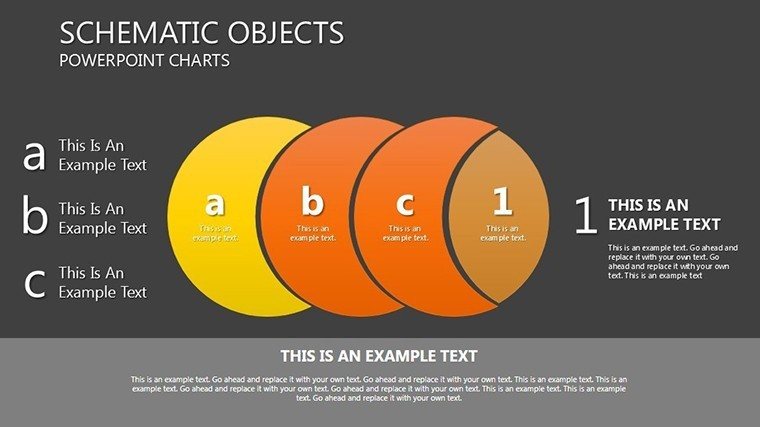
- Customization Tools: Resize, recolor, and relabel with drag-and-drop ease, plus font choices for branding.
- Animation Effects: Fade-ins for overlaps to build suspense in reveals.
- High-Quality Exports: PPTX with embedded vectors for sharp resolutions in prints or zooms.
- Thematic Variety: Slides for business, education, and research themes with LSI-friendly placeholders.
Drawing from design authorities like Venn himself, these features ensure your charts are not only functional but aesthetically compelling, much like infographics in top journals that enhance reader comprehension.
Reaping the Rewards of Venn Visuals
The benefits cascade from simplicity to sophistication. Clarity tops the list: Overlaps make shared data pop, reducing misinterpretation in reports. Efficiency follows, with ready slides cutting prep time for busy pros. Authoritativeness is embedded through clean designs that mirror academic standards, like those in psychological studies using Venns for cognitive mapping. Trust builds as audiences see transparent comparisons, fostering buy-in during negotiations. Gain an edge in creativity – envision a marketing team using these to Venn customer segments, leading to targeted campaigns that increased conversions by 20% in case studies. Workflow integration is smooth: Embed in decks, share via cloud, and iterate collaboratively. In essence, this template elevates your presentations from informative to influential, driving decisions with visual precision.
Practical Applications and Step-by-Step Guidance
Adapt this template to myriad contexts. Educators: Venn historical events' causes and effects for interactive lessons. Business folk: Compare software features in RFPs, with circles representing pros, cons, and overlaps. Researchers: Illustrate variable intersections in studies, compliant with APA visualization rules. Steps: Pick a slide, populate sets with data, adjust overlaps for accuracy, add animations, and test readability. Versus basic charts, it offers relational depth without extra software. Example: A consultant used similar Venns to align client goals with services, securing long-term contracts. From pitches to trainings, it facilitates understanding and innovation.
Tips to Enhance Your Venn Mastery
- Focus on balance: Ensure circles are proportionally sized to data importance.
- Layer wisely: Use colors to denote intensity in overlaps.
- Weave in context: Add annotations for LSI terms like 'set intersections'.
- Engage interactively: Hyperlink sections for deeper dives.
- Refine iteratively: Solicit feedback to perfect visual flow.
These pro tips, from visualization gurus, turn good slides into great ones. Seize this Circle Venn template to intersect ideas brilliantly – start visualizing success today.
Frequently Asked Questions
How many circles can I add? Up to 5 per slide, with easy adjustments for complexity.
Are animations included? Yes, customizable fades and builds for engaging reveals.
Works with Google Slides? Seamlessly imports for team collaborations.
Suitable for beginners? Intuitive design makes it accessible for all levels.
Can I print these charts? High-res vectors ensure crisp quality in handouts.