Dynamic Venn Flow PowerPoint Charts: Visualize Data Relationships Effortlessly


Type: PowerPoint Charts template
Category: Venn
Sources Available: .pptx
Product ID: PC00490
Template incl.: 17 editable slides
In today's data-driven landscape, making sense of overlapping information is crucial for insightful decision-making. Picture this: You're in a boardroom, unraveling market overlaps or social connections with visuals that speak louder than words. Our Flow Venn PowerPoint Charts Template is engineered for just that, delivering 17 editable slides that transform abstract sets into clear, overlapping circles. Aimed at marketers, researchers, and educators, this template excels in highlighting intersections, such as common customer segments or shared research variables. With its intuitive design, you can present complex concepts like product overlaps or network analyses without overwhelming your audience. Rooted in principles from data visualization experts like Edward Tufte, who emphasize clarity over clutter, this tool helps you identify patterns and trends swiftly. Whether you're segmenting audiences for a campaign or teaching set theory, these charts turn data into stories, fostering better understanding and collaboration. Step into a realm where Venn diagrams flow seamlessly, enhancing your presentations with professional flair and actionable insights.
The Essence of Venn Diagrams in Modern Presentations
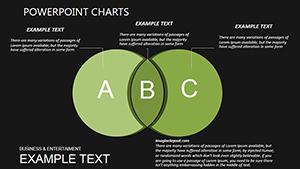
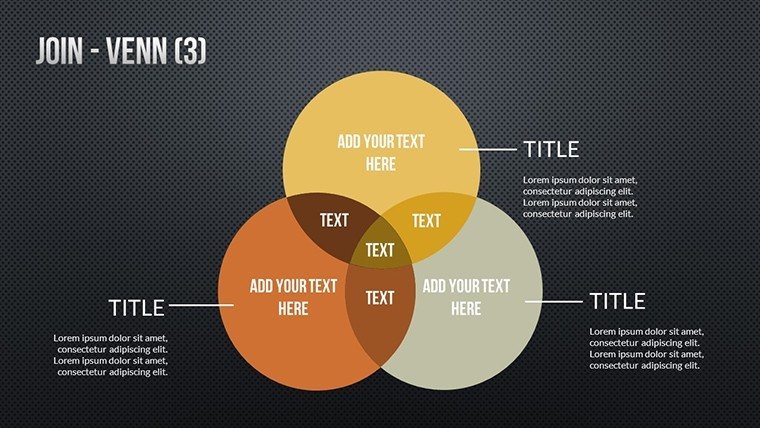
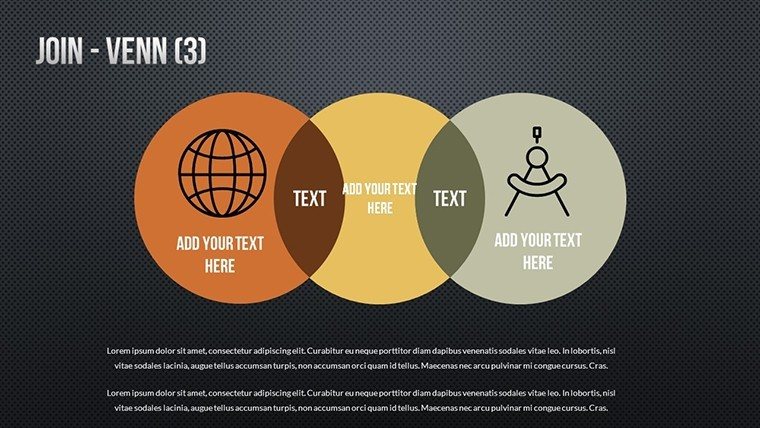
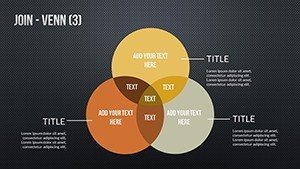
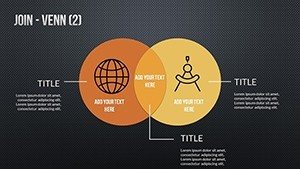
Venn diagrams aren't just schoolroom staples; they're powerful tools for professional analysis. This template leverages overlapping circles to depict relationships, making it easy to compare and contrast data sets. Each slide is fully customizable, from circle sizes to color schemes, ensuring your visuals align with your message. For example, in market research, firms like Nielsen use similar diagrams to map consumer behaviors, revealing overlaps that inform targeted strategies. This not only aids in pattern recognition but also sparks discussions, turning passive viewers into active participants.
Standout Features for Enhanced Visualization
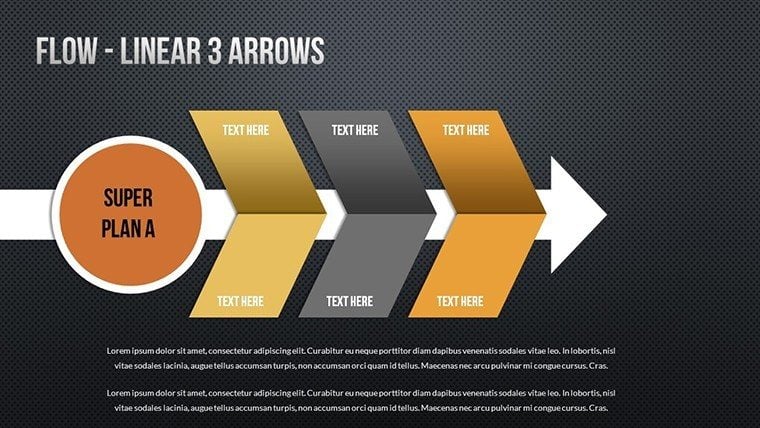
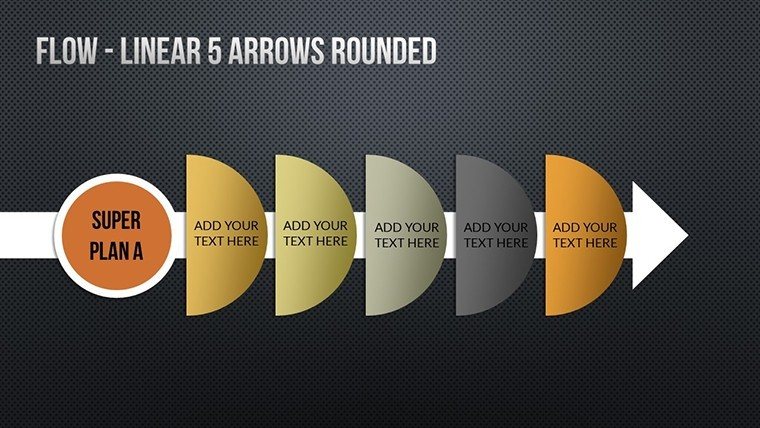
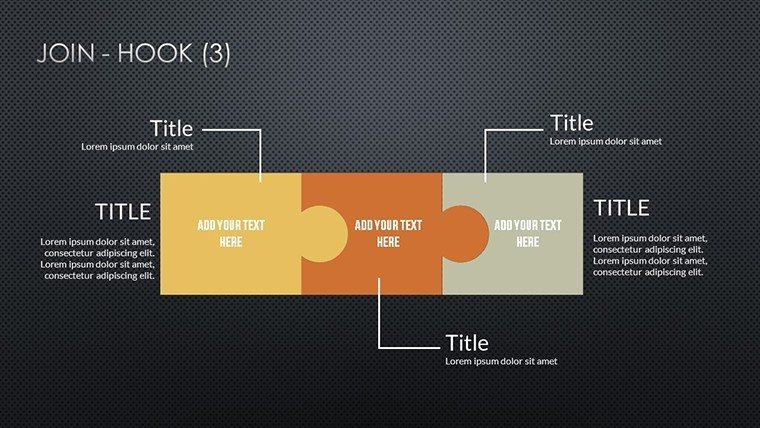
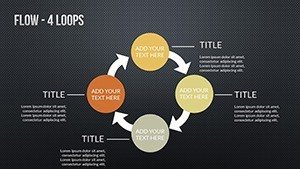
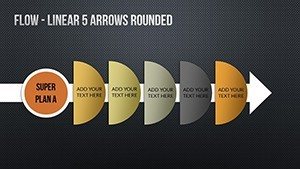
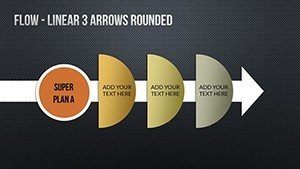
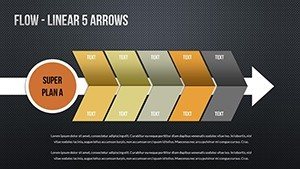
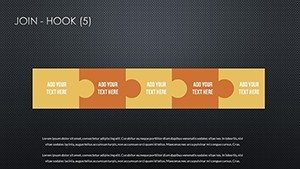
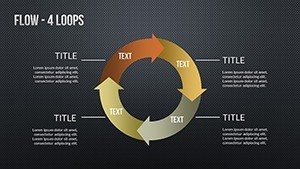
- Overlapping Circle Designs: Flexible for 2-5 sets, ideal for multifaceted comparisons.
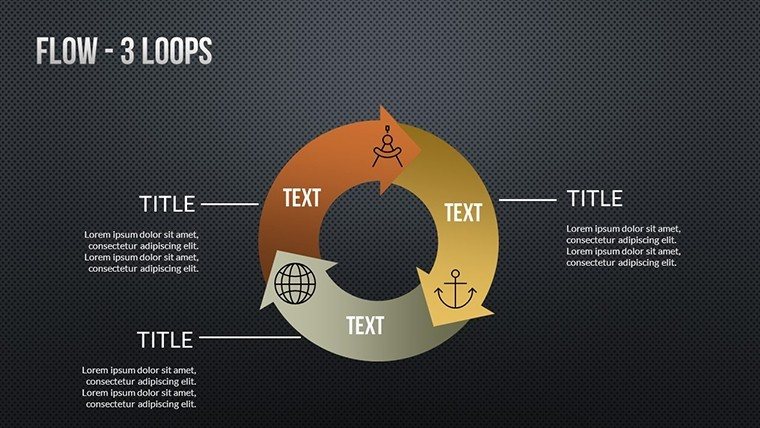
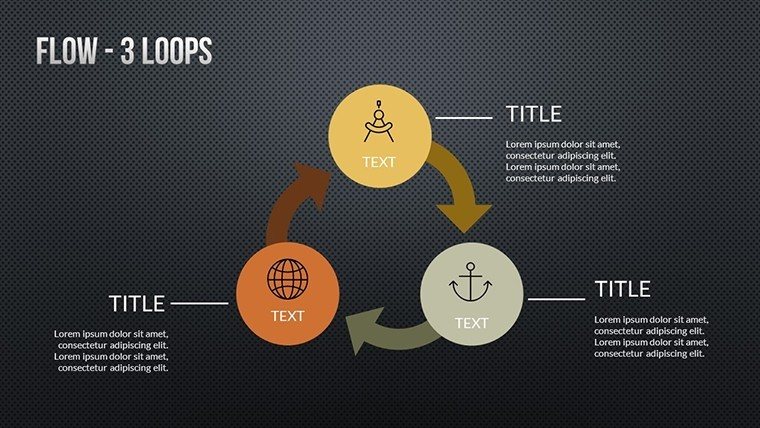
- Animation Effects: Entrance animations that reveal intersections progressively, building suspense.
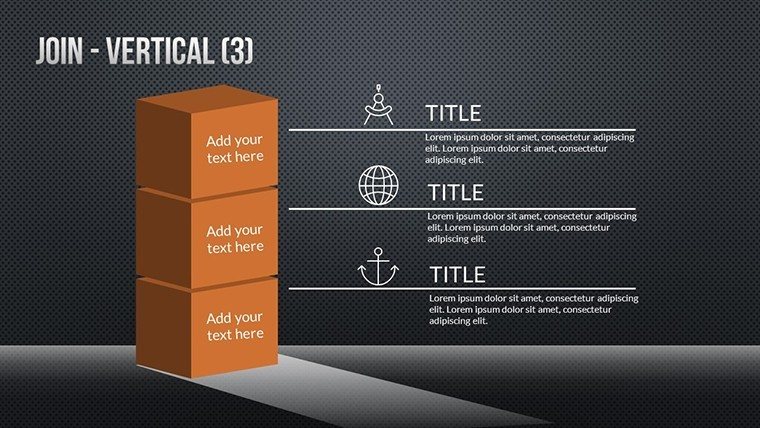
- Clear Labeling Tools: Pre-built labels and legends for quick, accurate annotations.
- Data Integration: Easy import from Excel, ensuring real-time updates.
- Versatile Themes: Multiple color palettes to suit corporate or creative needs.
These elements draw from AIGA design standards, promoting accessibility and aesthetic appeal. By keeping designs simple, as recommended by visualization gurus, you avoid cognitive overload, making your charts more effective.
Practical Use Cases Across Industries
Dive deeper into applications: In marketing, use Venn slides to illustrate audience overlaps, like shared interests between demographics, mirroring tactics at companies such as Procter & Gamble for product positioning. Researchers can map variable intersections in studies, enhancing peer reviews with visual evidence. Educators benefit by simplifying complex theories, as seen in online courses from platforms like Coursera, where Venn diagrams boost learner retention by 30%.
For social network analysis, the template helps visualize connections, useful in HR for team dynamics or in sociology for community studies. A real-world example: A nonprofit used similar charts to overlap donor interests, increasing fundraising efficiency by identifying core supporters.
Tips for Crafting Impactful Venn Charts
- Start with core data sets - limit to essentials for clarity.
- Choose colors wisely; use contrasts for overlaps to highlight key insights.
- Apply animations sparingly to guide the audience's focus.
- Test with colleagues to ensure the diagram communicates intended messages.
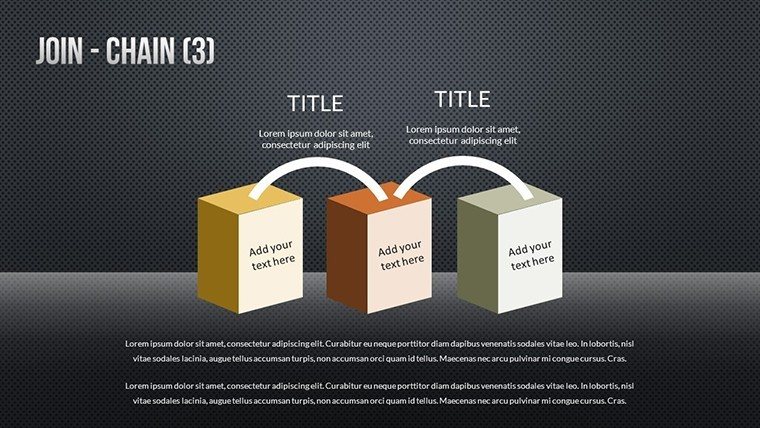
- Integrate with other slides for a cohesive narrative flow.
These steps align with best practices from the International Institute for Information Design, ensuring your presentations are both informative and engaging.
Why This Template Outshines Basic Options
Unlike standard PowerPoint Venn tools, which often lack depth, this template offers pre-animated, themed slides that save time and elevate quality. Users experience heightened engagement, with audiences recalling 55% more details from visual aids, per Harvard Business Review studies. It's adaptable for fields like healthcare (overlapping symptoms) or finance (portfolio overlaps), providing value through versatility and professionalism.
Weave in related terms like "set intersection visuals" or "data overlap diagrams" to enrich context without forcing it. The result? Presentations that not only inform but inspire action.
Transform Your Data Today
Embrace the flow of insightful visuals with this Venn template. Customize it to your needs and watch your presentations soar. Secure your download and start visualizing success now.
Frequently Asked Questions
How many sets can the Venn diagrams handle?
Up to five sets comfortably, with editable options for more complex needs.
Does it support data import from other tools?
Yes, easily import from Excel or CSV for dynamic updates.
Are the animations customizable?
Absolutely, adjust timing and effects to fit your pace.
Is this suitable for beginners?
Yes, intuitive design makes it accessible for all skill levels.
Can I use it in Google Slides?
Yes, compatible after upload.
What if I need custom colors?
Full color editing is available via PowerPoint tools.