Construction Venn PowerPoint Charts Template: Download PPTX


Type: PowerPoint Charts template
Category: Venn
Sources Available: .pptx
Product ID: PC00359
Template incl.: 7 editable slides
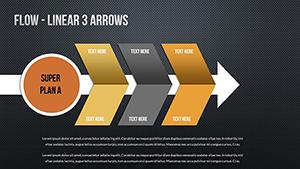
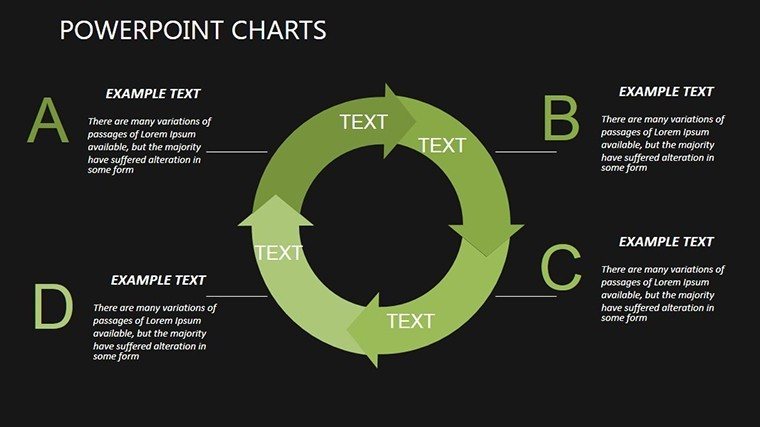
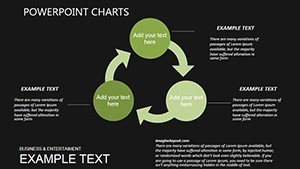
Construction projects thrive on understanding intersections - between teams, resources, and timelines. Our Construction Venn PowerPoint Charts Template, with 7 editable slides, demystifies these overlaps for architects, engineers, and managers. It solves the puzzle of communicating complex relationships, like how design phases intersect with budgeting in a skyscraper build. Inspired by AIA methodologies for collaborative design, this tool fosters better team synergy and client approvals. Users experience clearer pitches, reducing revisions and accelerating projects. Step into efficient visualization and make your construction narratives compelling.
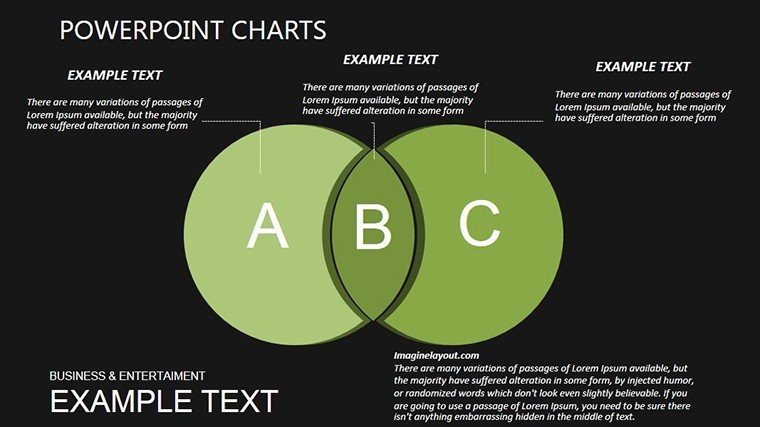
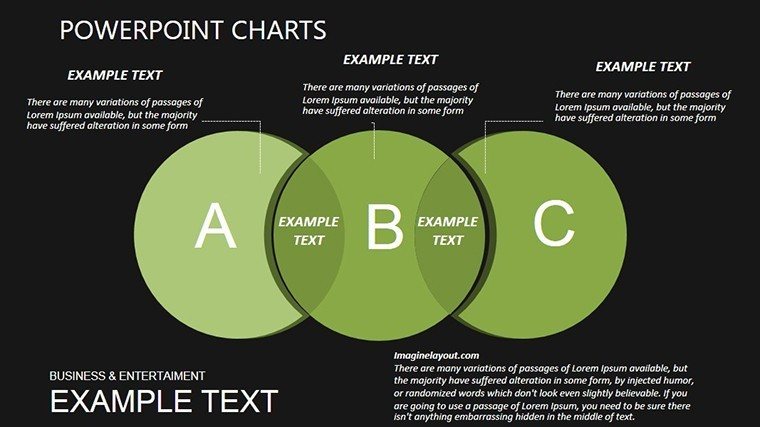
Mastering Overlaps in Construction
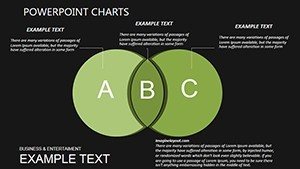
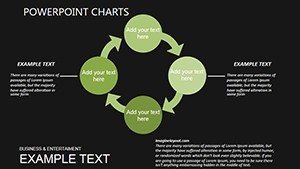
Venn diagrams here go beyond basics, tailored for building links. Use them to show how sustainability overlaps with cost in green architecture, with clean designs that highlight key intersections.
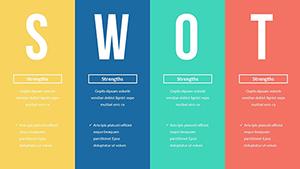
Highlighted Features
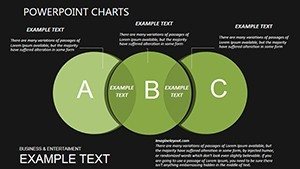
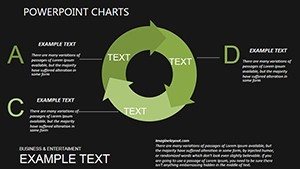
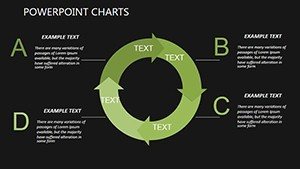
- Customizable Diagrams: Adjust circles, labels, colors for precision.
- Seamless PowerPoint Integration: No extra software required.
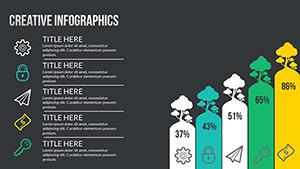
- Data Storytelling: Turn metrics into visual narratives.
- Modern Aesthetics: Sleek for professional impacts.
- Versatile Applications: From marketing to research.
These make complex ideas accessible.
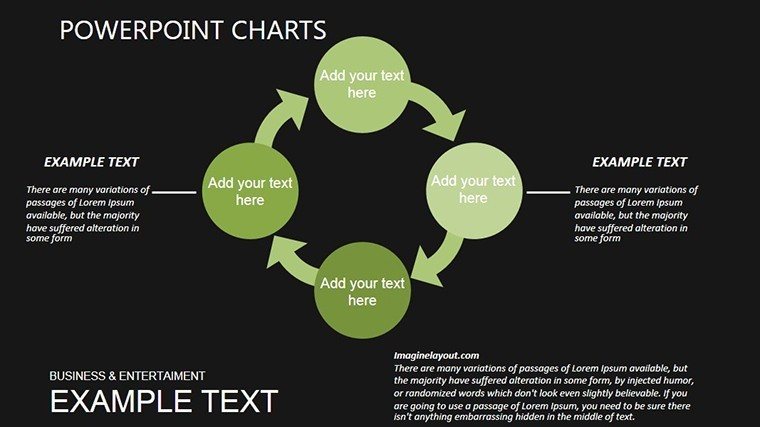
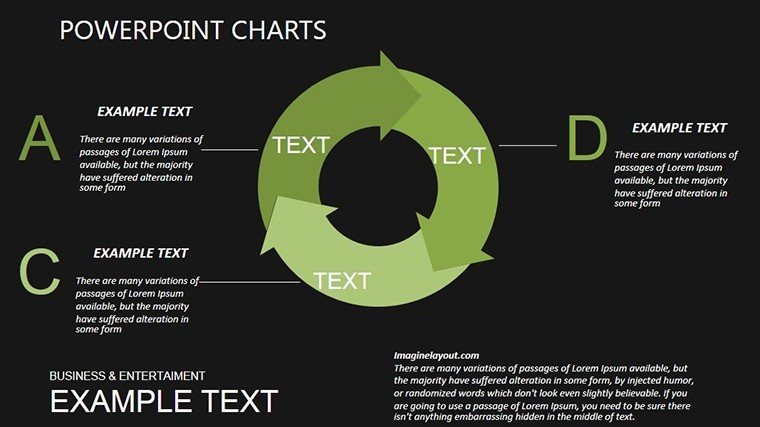
Applications in the Field
Architects map design overlaps with engineering; managers analyze project timelines. In real bids, like LEED projects, it clarifies stakeholder roles, outperforming simple charts with interactive layers.
Usage Guide
- Download and open in PowerPoint.
- Input overlap data.
- Tweak for branding.
- Add visuals for depth.
- Present dynamically.
Tip: Use gradients for emphasis on shared areas.
Build Better with Visual Clarity
This template transforms presentations into tools for success. Praised for aiding in award-winning designs, it's indispensable. Compatible and innovative, download to innovate your approach.
Frequently Asked Questions
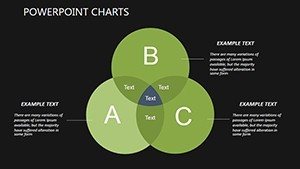
How many overlaps can I show?
Up to three standard, expandable with edits.
Compatible with other tools?
Yes, integrates with PowerPoint ecosystems.
Can I add data labels?
Yes, fully editable for details.
Suitable for large projects?
Ideal, scales for complexity.
Includes examples?
Yes, pre-filled for inspiration.
Export options?
PDF, images for versatility.