SWOT Analysis PowerPoint Charts for Business Presentations


Type: PowerPoint Charts template
Category: Business Models
Sources Available: .pptx
Product ID: PC00499
Template incl.: 16 editable slides
In the competitive landscape of architecture, where strategic planning can define a firm's trajectory, our SWOT Analysis PowerPoint Charts Template emerges as an essential ally. With 16 editable slides, this resource is tailored for architects and business leaders to dissect strengths, weaknesses, opportunities, and threats with visual precision. Envision presenting to your team: Highlighting your firm's strength in sustainable design, addressing weaknesses in digital rendering tools, spotting opportunities in urban revitalization projects, and mitigating threats from economic downturns - all in a cohesive, engaging format. Aligned with business frameworks from Harvard Business Review insights, this template ensures your analysis adheres to proven methodologies, fostering informed decisions that propel projects forward. Whether evaluating a new partnership for a landmark building or assessing internal capabilities for AIA awards, it transforms abstract concepts into actionable visuals, boosting your presentation's impact and credibility.
Demystifying SWOT: A Foundation for Strategic Insight
SWOT analysis isn't just a buzzword; it's a cornerstone for business resilience, especially in architecture where external factors like regulatory changes can pivot project outcomes. Our template breaks it down into intuitive charts, from quadrant matrices to detailed breakdowns, allowing you to map internal assets - like innovative BIM expertise - against external dynamics such as market trends in green architecture. Customization options abound, enabling you to infuse slides with your branding, perhaps using minimalist lines reminiscent of modernist architecture to maintain a professional aesthetic.
Core Features Enhancing Your Analysis
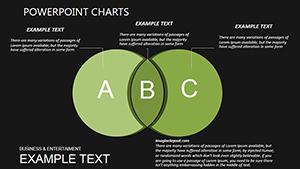
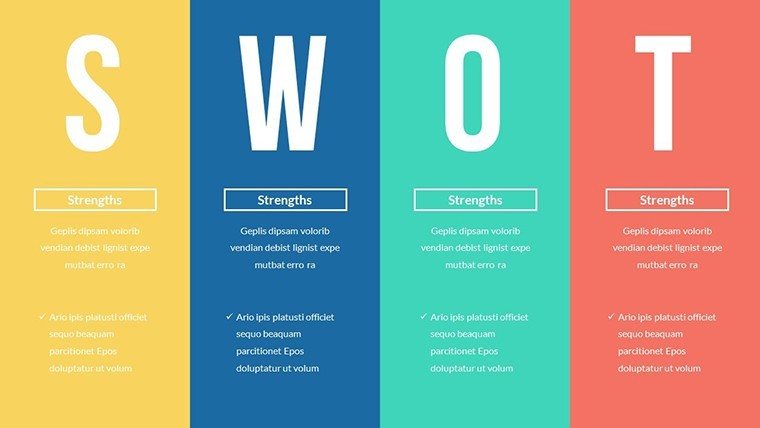
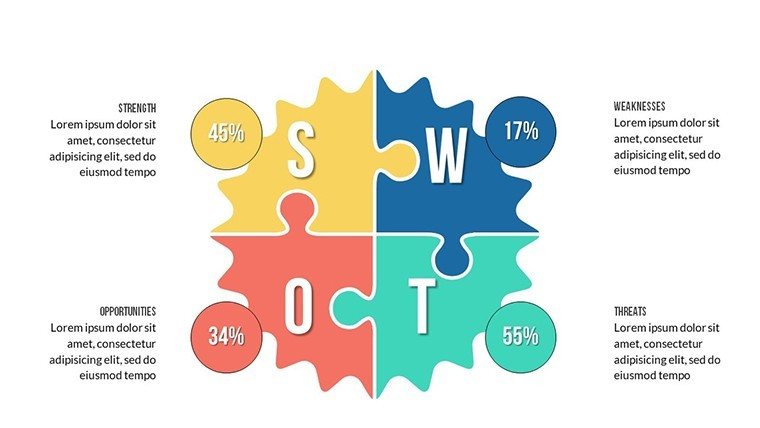
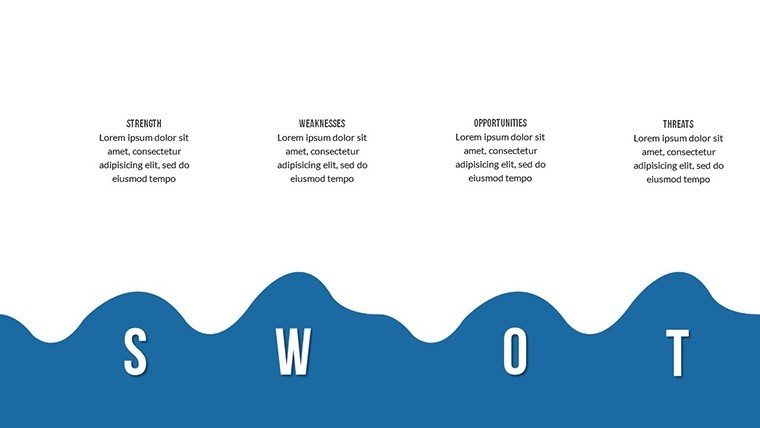
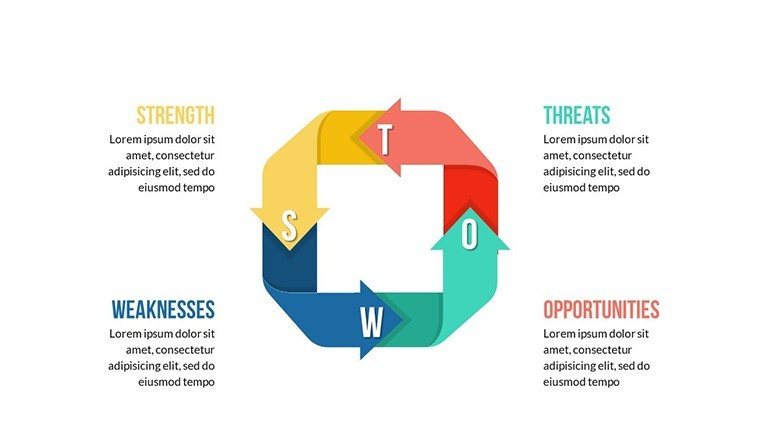
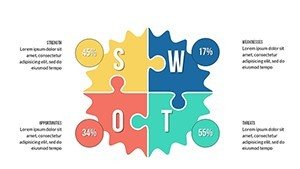
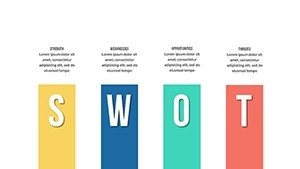
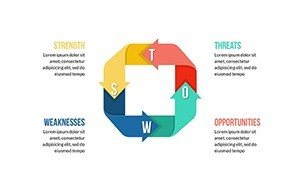
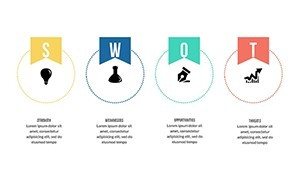
- Quadrant Layouts: Classic four-section designs for balanced SWOT overviews, ideal for quick firm assessments.
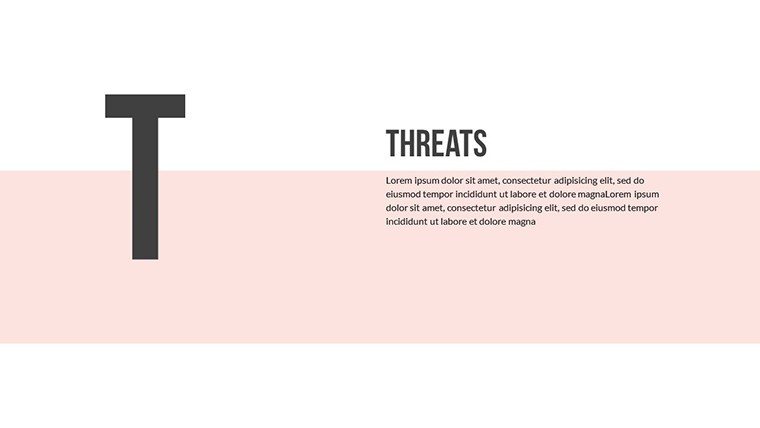
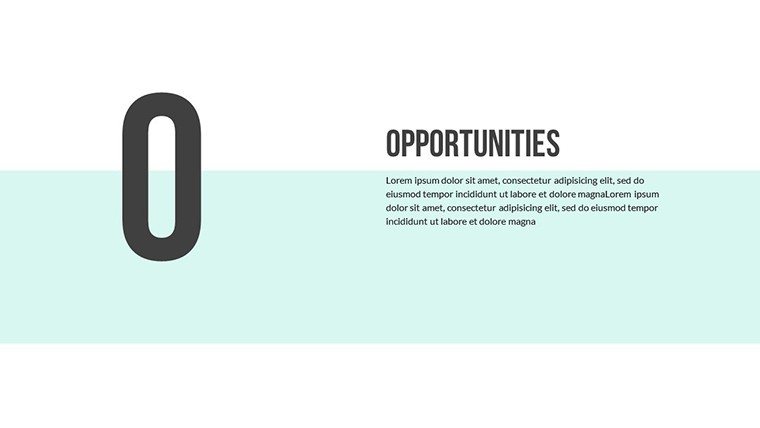
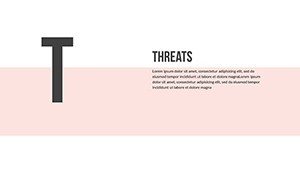
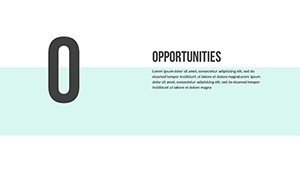
- Detailed Breakdown Slides: Dive deeper into each element, with space for bullet points on specifics like opportunity in smart city initiatives.
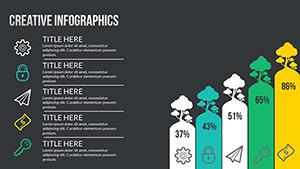
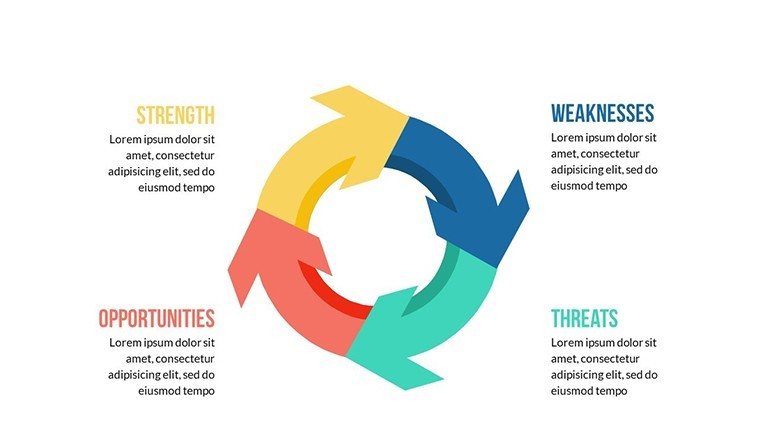
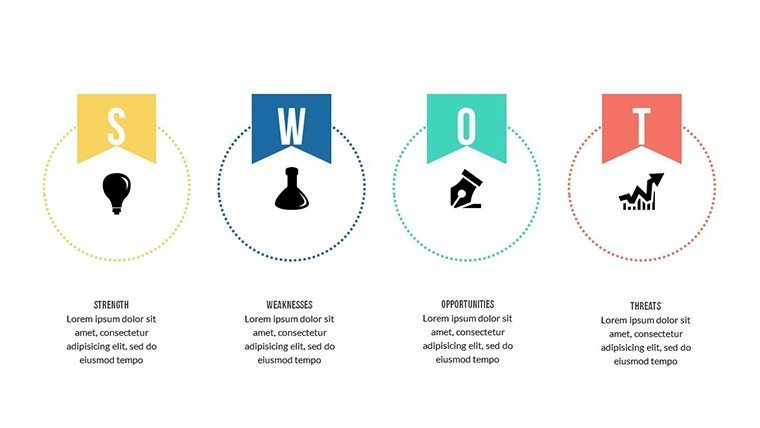
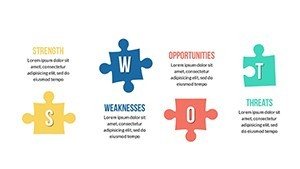
- Visual Enhancements: Icons and color-coding to differentiate categories, making complex data digestible at a glance.
- Editable Elements: Fully adjustable texts and graphics to tailor to architecture-specific scenarios, like threat analysis in volatile material costs.
- Integration Ready: Compatible with PowerPoint tools for adding data from spreadsheets, ensuring accuracy in projections.
Drawing from case studies like Skidmore, Owings & Merrill's SWOT-driven strategies for global expansions, these features empower authoritative presentations.
Strategic Applications in Architecture Business
For architecture firms, SWOT is pivotal in navigating challenges like client acquisition or talent retention. Use this template to present a firm-wide review, identifying strengths in award-winning portfolios while addressing weaknesses in remote collaboration tools post-pandemic. Opportunities might include emerging markets in adaptive reuse projects, as seen in revitalized industrial sites, while threats could encompass rising competition from AI-driven design firms. Educators can employ it in business courses for architecture students, using real examples like Frank Gehry's innovative approaches to illustrate strategic pivots.
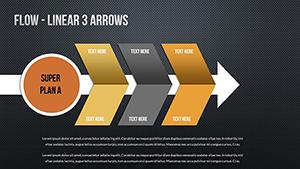
Implementing SWOT: A Practical Workflow
- Gather Data: Collect inputs from team brainstorming sessions on firm capabilities and market conditions.
- Populate Quadrants: Assign elements to SWOT categories, using slides for visual mapping.
- Analyze Interconnections: Link strengths to opportunities, like leveraging eco-design expertise for green certifications.
- Develop Strategies: Create action plans on dedicated slides, prioritizing high-impact areas.
- Present and Refine: Share with stakeholders, incorporating feedback for iterative improvement.
This process mirrors successful applications in firms like Bjarke Ingels Group, where SWOT informs bold, future-oriented designs.
The Edge Over Generic Tools: Depth and Authority
Unlike standard PowerPoint defaults that offer bland grids, our template provides architecturally inspired visuals that convey expertise. Benefits include enhanced decision-making, with users noting clearer strategic paths leading to better project outcomes. Trustworthiness is amplified through structured, evidence-based slides, aligning with principles by referencing industry standards. In architecture, this means turning potential weaknesses into strengths, like upskilling in VR for immersive client presentations, ultimately driving firm growth.
Broadening the Scope: Who Benefits Most?
Primarily architects and executives, but consultants and educators also thrive. A consultant might use it for client audits on building efficiency, while professors teach strategic planning with examples from iconic failures like the Millennium Dome's oversight in threat analysis.
Seize strategic advantage - download our SWOT Analysis PowerPoint Charts Template and chart a course for architectural excellence.
Frequently Asked Questions
What is included in the template?
16 editable slides with various SWOT layouts for comprehensive business analysis.
Can I customize the charts?
Yes, all elements are fully editable to suit your architecture business needs.
Is it compatible with Google Slides?
Yes, works in PowerPoint and Google Slides for versatile use.
How does it help in presentations?
It provides visual clarity for SWOT elements, enhancing audience understanding.
Are there examples included?
Slides offer placeholders for real-world architecture scenarios.